© 2017, IRJET | Impact Factor value: 5.181 | ISO 9001:2008 Certified Journal | Page 1464
PROTOTYPICAL WEBSITE QUALITY MEASUREMENT USING T-SCORE
STATISTICS MODEL
B.Jayanthi
1and Dr. S.Suganya
21
Research Scholar, School of Computer Studies,Rathnavel Subramaniam College of Arts & Science,
Sulur, Coimbatore
2
Associate Professor-Research, School of Computer Studies,Rathnavel Subramaniam College of Arts & Science,
Sulur, Coimbatore
---***---Abstract Websites are used extensively in our daily life to transform information between many users. Transformed information will convey in several forms, styles, languages which includes text, images, sound and video intended to exchange, make agree, sell, and present a viewpoint. In this work, outlined about domain of academic sites with more characteristics and attributes in order to analyze the quality requirement tree and a way to identify them. These fundamentals are used in a numerical methodology for assessment, comparison, and ranking processes. The proposed methodology can be a useful approach to assess the quality in different phases of a Web product life cycle. This work makes an attempt to propose a framework for measuring quality attributes of web-based application systems. Web-based quality properties are referred to as non-functional properties of web applications such as performance, maintainability, security, usability, portability.
Keywords: Computer science, Principle Component Analysis, ANOVA, T-Score, Quality Measure.
1. Introduction
Websites are rising at a fastspeed both in terms of the growing acceptability of Web sites, and in terms of the difficulty of such artifacts. However, a large amount of defined product process model that control the effective development, and evaluation process model that support the Web-site quality assessment and improvement are not being accompanied by that sites development. Consequently, a systematic and disciplined utilization of models, engineering methods, and techniques for the assessment, understanding, and improvement of this type of software is taken as a mandatory constraint. The primary goal for Web-site quantitative evaluation is to understand the extent group of quality characteristics, that is necessary to a choose set of needs in a specific user view.
Web site domains like museums, academic sites, electronic commerce, etc., are becoming increasingly difficult method. Hence, an integral quantitative performance process related all relevant quality characteristics are also a complex problem. The diverse nature of web applications makes it difficult to measure by using existing quality measurement models. Web applications often use large numbers of reusable components which make traditional measurement models less relevant. Estimating web sites quality needs appropriate evaluation criteria. Lot of existing criteria are not simple and easy to calculate and require methods such as heuristic calculation, or/and empirical usability tests. This work aims at defining a quality model and a set of characteristics that is used to measure in an automated fashion, relating internal and external quality factors. As number of existing tools can achieve some analysis, the common architecture will be based upon a conceptual model of the site/page, and the tools will givethe output to a Quality Data Base, which is the basis for subsequent actions.
The rest of this paper is organized as follows. Section II summarizes the concepts and related works. Section III details the analysis of the collected results, which contains a Principal Component Analysis, ANOVA-based analysis and T-Score to evaluate the quality dependency on the application domainand Section IV discusses the experiments and the achieved results. Finally, Section V presents the conclusions of the work.
2. Literature Survey
© 2017, IRJET | Impact Factor value: 5.181 | ISO 9001:2008 Certified Journal | Page 1465
Schrimpsher and Letha (2014) proposed two measures of knowledge content and performance. Mean average recall (MAR) with respect to the original ontology compares the data returned from a series of queries related to a particular concept of interest. Sarstedt and Erik (2014) introduced the hypothesis testing which allows for the determination of statistical significance. The main objectives are the logic of hypothesis testing and common types of t-tests, one-way and two-way ANOVA. Gu Chong (2014) provides efficient ANOVA decompositions are constructed into models on product domains, and modeling and inferential tools are provided for tasks such as interval estimates, the testing of negligible model terms, the handling of correlated data, etc.
Covariance decomposition of output variance is used in this paper to take account of interactions between non-orthogonal components in anchored ANOVA method. Furthermore, Tang et al (2014) emphasized covariance decomposition can be generalized in a straightforward way to decompose high order moments. An anchored ANOVA method is proposed by Tang et al (2014) to decompose statistical moments. Compared to standard ANOVA with mutually orthogonal components, anchored ANOVA, with arbitrary anchor point, loses orthogonality if employing the same measure.
Analytical Methods Committee (2014) suggested a Robust ANOVA is a useful tool, which gives a more representative estimate of the separate variances than classical ANOVA when outlying results are encountered. Lin and Jay (2011) presented a systematic, comprehensive and up-to-date review of perceptual visual quality metrics (PVQMs) to predict picture quality according to human perception. Several frequently used computational modules (building blocks of PVQMs) are also discussed.
Ranking algorithms are assessed with respect to some utility measure that reflects the likelihood of satisfying an information need. Pedersen (2013) discussed how this data can be used to derive Web Search quality metrics that have very different properties than traditional offline metrics. In order to obtain valid correlation between analytical model and user scores, assessment based on networking perspectives and human perception is required. Nguyen et al (2012) have utilized the orthogonal arrays using the Taguchi approach performs the experiment to characterize the application as well as network performance metrics in QoE assessment model for web-based systems.
Many existing retrieval approaches do not take into account the content quality of the retrieved documents, although link-based measures such as Page Rank are commonly used as a form of document prior. Bendersky et al (2011) presented the quality-biased ranking method that promotes documents containing high-quality content, and penalizes low-quality documents. The quality of the document content can be determined by its readability, layout and ease-of-navigation, among other factors. These quality degradations could adversely affect users' quality of experience (QoE). The standard method for comparing an individual's test score with a normative sample involves converting the score to a z score and evaluating it using a table of the area under the normal curve by Crawford et al (1998).
3. Quality Model
The assessment of website quality remains a challenging area of research in the website propagation. Customer satisfaction is based on the quality and also with the level of achievement of user expectation when interfacing a website. As performed in this work, quality captures perceptual aspects, probable to be involved in website interaction. Such focus on quality maps to customer satisfaction assessment to the appearance of website quality as an aggregate composite that brings together formal metrics and perceptual user traits.
The major procedure steps that evaluators should follow by applying the web-site, namely:
Choosing a site or a set of competitive sites to perform or compare
Identifying goals and the user point of view
Defining the Web-site quality characteristics and attributes condition tree
Defining criterion operations for each attribute, and using attribute measurement
Aggregating elementary preference to achieve the global Web-site quality preference
Analyzing, assessing, and comparing partial and global outcomes.
© 2017, IRJET | Impact Factor value: 5.181 | ISO 9001:2008 Certified Journal | Page 1466
This performance is used to produce an automatic classification model for sites quality, then require each quality attribute to be given in terms of automatically collectable quality metrics. The characteristics are used to organize the resulting web quality model, those characteristics are as follows:
Efficiency (E) - includes aspects related to load times and size;
Functionality (F) - includes navigation, identity, forms and other aspects related to the functionality offered by the site;
Maintainability (M) - includes aspects related to the number of items to maintain (e.g. scripts, styles used, tables);
Portability (P) - includes aspects related to page layout, use of html standards, etc.
Reliability (R) - includes aspects related to the validation and links status;
Usability (U) - includes aspects related to accessibility, multimedia and textual contents;
Accessibility (A) - A high quality web site has versions for non PC users as well. It is important that mobile and tablet users can access the web site without any usability issues.
Navigation (N) - Navigation system and links allow incorporating various design elements into the website.
Table I: Web Site Quality Metrics
E efficiency_css_sizecss size per page
E efficiency_homepage_load_time homepage load time E efficiency_img_size [7] image size E efficiency_javascript_size [7] script size per page
E efficiency_page_load_time [10] page load time
E efficiency_page_size page size
F forms_form_info_request [11],[12] contacts/infpresence of o form F forms_labels number of label tags
F identity_author [10] presence of average author
F identity_logo [10] presence of average logo
F identity_sitename_title [12] site name in presence of title
N navigation_bar [7] presence of navigation bar
N navigation_breadcrumbs [7]
presence of breadcrumb
s (path metric)
N navigation_quality_of_links [10] page title in presence of link
© 2017, IRJET | Impact Factor value: 5.181 | ISO 9001:2008 Certified Journal | Page 1467 page
M maintenance_num_tables [13] number per tables page
P pagelayout_device_specific [7] presence of specific css to devices
P pagelayout_html_standards use of html notation in formatting P pagelayout_num_divs [7] number of divs
P pagelayout_num_frames [13] number of frames
P pagelayout_num_tables [7] number of tables
P pagelayout_num_tables_inside_tables tables inside presence of tables
R links_average_num_words [13]
average of number of words in
links
R links_links_title [11] links with title attribute R links_num_broken_links[11], [7] broken links number of
R links_num_extern_broken_links [7]
number of broken links
to another sites
R links_num_extern_links [7]
number of links to another sites
R links_num_image_links [13] number of links with images
R links_num_intern_broken_links [7]
number of broken links
in the same site R links_num_intern_links [7] number of inter links
R links_num_links [11], [7] number of links
R links_num_non_implemented_links[11]
number of non-implemente
d links
R links_page_without_links [13]
pages without links in the
© 2017, IRJET | Impact Factor value: 5.181 | ISO 9001:2008 Certified Journal | Page 1468 per page
R validation_warnings warnings html per page
A accessibility_img_alt [7] alt attribute presence of in images
A accessibility_img_title [13]
presence of title attribute in
images
A accessibility_validate_access [7],[10],[14] accessibility issues per page
U multimedia_num_img [7] number per image page
U text_font_size_average_em
average of font size in em
(percentage) in css
U text_font_size_average_px average font size in css in pixels
U text_font_size_max_em
maximum font size in em (percentage)
in css U text_font_size_max_px max font size in pixels
U U text_font_size_min_em
minimum fonts size in
em (percentage)
in css U text_font_size_min_px min font size in pixels
U text_heading_len [7] heading average length
U text_heading_reverse_order [7] headings in number of reverse order
U text_italic_text
number of italic text bigger than 20
chars
U text_num_diferent_colors different text number of colors in css
U text_num_diferent_fonts [7] different text number of fonts in css
© 2017, IRJET | Impact Factor value: 5.181 | ISO 9001:2008 Certified Journal | Page 1469 U text_num_subheading_heading [7] number of sub headings per
heading
U text_num_syllables_in_word [7] syllables per number of word
U text_num_words_in_sentence [7] number of words per sentence
U text_num_words_meta_keywords
number of words in
metatag keywords U text_paragraph_max_size [7] maximum size of paragraph U text_paragraph_size [7] paragraph size U text_subheading_len [7] sun heading length
U text_total_newlines [7] total number of newlines U text_total_sentences [7] total sentences U text_total_syllables [7] total syllables
U text_total_words [7] total words
U text_uppercase_text number of uppercase sentences
4. Data Analysis
The main purpose of this research is to evaluate and compare the quality of Internet sites. The comparison of the portals and the respective factors will take place by applying the following analysis.
4.1.1 Principal Components Analysis
One of the multivariate analysis method and mostly used method in large multidimensional datasets is Principal Component Analysis (PCA). This PCA procedure entails a mathematical calculation which converts into small uncorrelated variables from number of possible correlated variables. First Principal component will accounts in the data variability as much as possible and the succeeding components will accounts component in the data for remaining variability.
The number of multivariate data set can be reduced by using PCA and maintains possible variation that is, present in the data set. This reduction is achieved by taking p variables X1, X2,…, Xp and finding the combinations of these to produce principal components (PCs) PC1, PC2,…, PCp, that are uncorrelated.
4.1.2 ANOVA
The techniques used to perform the assumptions are simple correlated Analysis of Variance (ANOVA), multiple comparisons in ANOVA. Unlike other inference procedures, ANOVA will make the result fully dependable because which has some underlying assumptions which should be in place. They include:
(i) Subjects are chosen via a simple random sample.
(ii) Response variable is distributed within each group/population.
(iii)
Population standard deviation is the same for all groups while the population has different form from one group toanother.
Assumption 1:
© 2017, IRJET | Impact Factor value: 5.181 | ISO 9001:2008 Certified Journal | Page 1470
The means are not equal, .
Assumption 2:
If differences exist among the mean values of the three Internet sites, then between which sites are these detected?
Simple correlated ANOVA examines the first assumption; the method of multiple comparisons in ANOVA was used to examine the second assumptionalthough remaining assumptions were subject to the t-test. Simple correlated ANOVA examines whether two (or more) value groups differ significantly with regard to the distribution of their mean values. It also assumes that the values of the two groups originate from the same sample of people and that the correlation coefficients are high. The reason that correlated ANOVA was selected on top of uncorrelated is that the data come from the same sample. Yet this method can detect the general tendency and not the points in which differences exist.
For this reason, the multiple comparisons method in ANOVA was applied, with which an attempt was made to detect the statistically significant differences among the mean values of Internet sites. This technique is used when the examined means are two, and it detects which specific pairs of distribution means differ significantly in the variance analysis.
4.1.3 T-SCORE
The t-test is used to examine the differences in mean values of the factors that determine Internet quality. These factors, as mentioned, are usability, functionality, reliability, maintainability etc. However, apart from the evaluation of the portals, the factors that compose the quality of each portal are also assessed and compared. The overall evaluation of the Internet sites examined is performed with statistical tools, based on the scale used in the research questionnaire. To assess and compare the individual quality factors, other inductive-statistical tool t-test was used.
In practice, the research was conducted towards two directions: a part of the sample was approached through personal interviews. Participants came in voluntarily, while exploring the examined Internet sites, they voluntarily answered the questionnaires handed to them in hard copy. The remaining participants were approached via electronic mail, after asking if they would be willing to accept the electronic message. The cover letter itself contained clear information and instructions on the purpose and way to complete the questionnaire. All questionnaires were answered in a unanimous manner.
5. Experimental Results
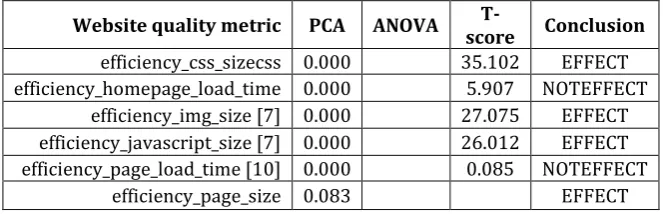
[image:7.595.132.464.611.718.2]Experimental result is performed by parametric of PCA, ANOVA tests and T-Score. As it can be seen there, only three metrics have statistical evidence of normality. The T-Score test significance is shown from Table 2 to Table 9. As it can be seen there, only three metrics have statistical evidence of normality. For the latter we have used the parametric ANOVA test and for all the others we have used the equivalent non-parametric one, the T-score test, whose corresponding statistics are represented in Table 2 through Table 9. In the same table, the last column (named “Conclusion”) shows the label “EFFECT” on those cases where the ANOVA test allowed detecting a statistically significant difference on the variance between the groups. As such, the metrics marked with the “EFFECT” should be considered as possible candidates for a domain-specific website quality model, while the remaining ones are candidates for a domain-independent model.
Table 2: Efficiency Metrics Vs Application Domain
Website quality metric PCA ANOVA score T- Conclusion
efficiency_css_sizecss 0.000 35.102 EFFECT efficiency_homepage_load_time 0.000 5.907 NOTEFFECT
efficiency_img_size [7] 0.000 27.075 EFFECT efficiency_javascript_size [7] 0.000 26.012 EFFECT efficiency_page_load_time [10] 0.000 0.085 NOTEFFECT
© 2017, IRJET | Impact Factor value: 5.181 | ISO 9001:2008 Certified Journal | Page 1471
Table 3: Functionality Metrics Vs Application Domain
Website quality metric PCA ANOVA
T-score Conclusion
forms_form_info_request
[11],[12] 0.000 9.015 EFFECT
forms_labels 0.000 11.021 EFFECT
identity_author [10] 0.000 1.997 NOTEFFECT identity_logo [10] 0.000 0.401 NOTEFFECT identity_sitename_title
[12] 0.000 1.256 NOTEFFECT
Table 4: Navigation Metrics Vs Application Domain
Website quality metric PCA ANOVA
T-score Conclusion
navigation_bar [7] 0.000 0.229 NOTEFFECT navigation_breadcrumbs
[7] 0.000 3.257 NOTEFFECT
navigation_quality_of_links
[10] 0.000 2.658 NOTEFFECT
Table 5: Maintainability Metrics Vs Application Domain
Website quality metric PCA ANOVA score T- Conclusion
maintenanc_num_scripts 0.005 11.298 EFFECT
maintenanc_num_stylecss 0.000 9.198 EFFECT
maintenance_num_tables
[13] 0.000 4.445 NOTEFFECT
Table 6: Portability Metrics Vs Application Domain
Website quality metric PCA ANOVA score T- Conclusion
pagelayout_device_specific [7] 0.000 4.905 NOTEFFECT pagelayout_html_standards 0.000 8.998 EFFECT
pagelayout_num_divs [7] 0.003 29.298 EFFECT pagelayout_num_frames [13] 0.000 3.024 NOTEFFECT
pagelayout_num_tables [7] 0.000 4.892 NOTEFFECT pagelayout_num_tables_inside_tables 0.000 6.024 NOTEFFECT
Table 7: Reliability Metrics Vs Application Domain
Website quality metric PCA AN OV A
T-scor
e
Conclusion
links_average_num_words 0.000 3.70
5 NOTEFFECT links_links_title 0.000 12.0
21 EFFECT links_num_broken_link 0.000 1.08
9 NOTEFFECT links_num_extern_broken_links 0.000 0.11
© 2017, IRJET | Impact Factor value: 5.181 | ISO 9001:2008 Certified Journal | Page 1472 links_num_extern_li
nks 0.000 49.997 EFFECT links_num_image_links 0.000 28.0
54 EFFECT links_num_intern_broken_links 0.000 1.50
2 NOTEFFECT links_num_intern_links 0.059 15.
80 1
EFFECT
links_num_links 0.027 35.1
02 EFFECT links_num_non_implemented_links 0.000 1.69
9 NOTEFFECT links_page_without_links 0.000 12.0
25 EFFECT validation errors 0.000 1.10
2 NOTEFFECT validation warnings 0.000 2.99
[image:9.595.88.526.89.428.2]8 NOTEFFECT
Table 8: Accessibility Metrics Vs Application Domain
Website quality metric PCA ANOVA T-score Conclusion
accessibility_img_alt [7] 0.000 2.001 NOTEFFECT accessibility_img_title [13] 0.000 1.998 NOTEFFECT accessibility_validate_access
[image:9.595.81.532.469.784.2][7],[10],[14] 0.060 5.012 EFFECT
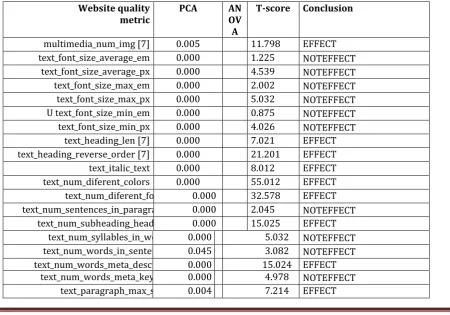
Table 9: Usability Metrics Vs Application Domain
Website quality
metric PCA ANOV A
T-score Conclusion
multimedia_num_img [7] 0.005 11.798 EFFECT
text_font_size_average_em 0.000 1.225 NOTEFFECT
text_font_size_average_px 0.000 4.539 NOTEFFECT
text_font_size_max_em 0.000 2.002 NOTEFFECT
text_font_size_max_px 0.000 5.032 NOTEFFECT
U text_font_size_min_em 0.000 0.875 NOTEFFECT
text_font_size_min_px 0.000 4.026 NOTEFFECT
text_heading_len [7] 0.000 7.021 EFFECT
text_heading_reverse_order [7] 0.000 21.201 EFFECT
text_italic_text 0.000 8.012 EFFECT
text_num_diferent_colors 0.000 55.012 EFFECT
text_num_diferent_fonts [7] 0.000 32.578 EFFECT text_num_sentences_in_paragraph [7] 0.000 2.045 NOTEFFECT
text_num_subheading_heading [7] 0.000 15.025 EFFECT text_num_syllables_in_word [7] 0.000 5.032 NOTEFFECT text_num_words_in_sentence [7] 0.045 3.082 NOTEFFECT text_num_words_meta_description 0.000 15.024 EFFECT
© 2017, IRJET | Impact Factor value: 5.181 | ISO 9001:2008 Certified Journal | Page 1473 text_paragraph_size [7] 0.020 0.702 NOTEFFECT
text_subheading_len [7] 0.000 15.874 EFFECT text_total_newlines [7] 0.000 0.198 NOTEFFECT text_total_sentences [7] 0.002 8.825 EFFECT
text_total_syllables [7] 0.001 4.987 NOTEFFECT text_total_words [7] 0.000 6.124 NOTEFFECT text_uppercase_text 0.000 3.014 NOTEFFECT
5. Conclusion
In this work, website quality measurement criteria are defined which help in relating external and internal quality then presented to a framework for measuring the quality of web-based systems. The performance is based on a website user point of view and has been designed in a form of possible automation of the evaluation process. Attention is given to the identification of criteria which is objectively evaluated and measured. The framework is presented by no means a final conclusion on how web-based systems can be measured, but it provided a framework which can be extended by its users, and believe that this is a step to more effective measurements of web quality. The results that emerged from the use of the PCA, ANOVA and t-test statistical tools included statistical significant differences among the examined means. For the future, it suggests creation of an open knowledge base of web-based software’s quality factors, criteria, and metrics. Software professionals can then make use of already defined model that suits them or find the closest model and modify it according to their needs.
References
[1]. Aladwani, Adel M., and Prashant C. Palvia. "Developing and validating an instrument for measuring user-perceived web quality." Information & management 39, no. 6 (2002): 467-476.
[2]. Abdi, Hervé, and Lynne J. Williams. "Principal component analysis." Wiley Interdisciplinary Reviews: Computational Statistics 2, no. 4 (2010): 433-459.
[3]. Shlens, Jonathon. "A tutorial on principal component analysis." arXiv preprint arXiv: 1404.1100 (2014).
[4]. Redler, Gage, Boris Epel, and Howard J. Halpern. "Principal component analysis enhances SNR for dynamic electron paramagnetic resonance oxygen imaging of cycling hypoxia in vivo." Magnetic Resonance in Medicine 71, no. 1 (2014): 440-450.
[5]. Schrimpsher, Dan, and Letha Etzkorn. "A model to predict quality of a reduced ontology for Web service discovery on mobile devices." The Knowledge Engineering Review 29, no. 02 (2014): 201-216.
[6]. Sarstedt, Marko, and Erik Mooi. "Hypothesis Testing & ANOVA." In A Concise Guide to Market Research, pp. 141-192. Springer Berlin Heidelberg, 2014.
[7]. Gu, Chong. "Smoothing Spline ANOVA Models: R Package gss." JOURNAL OF STATISTICAL SOFTWARE 58, no. 5 (2014): 1-25.
[8]. Tang, Kunkun, Pietro Marco Congedo, and RémiAbgrall. "Some advances on anchored ANOVA expansion for high order moments computation." In 6th European Conference on Computational Fluid Dynamics (ECCOMAS CFD 2014). 2014. [9]. Tang, Kunkun, Pietro Marco Congedo, and RémiAbgrall. "Sensitivity analysis using anchored ANOVA expansion and high
order moments computation." (2014).
[10].No, A. M. C. T. B., and Analytical Methods Committee. "Unbalanced robust ANOVA for the estimation of measurement uncertainty at reduced cost."Analytical Methods 6, no. 18 (2014): 7110-7111.
[11].Lin, Weisi, and C-C. Jay Kuo. "Perceptual visual quality metrics: A survey."Journal of Visual Communication and Image Representation 22, no. 4 (2011): 297-312.
[12].Pedersen, Jan. "Online metrics for web search relevance." In Proceedings of the 2013 workshop on Living labs for information retrieval evaluation, pp. 1-2. ACM, 2013.
[13].Nguyen, Le Thu, Richard Harris, and JusakJusak. "Analysis of networking and Application Layer derived metrics for web Quality of Experience." In Consumer Communications and Networking Conference (CCNC), 2012 IEEE, pp. 321-325. IEEE, 2012.
[14].Bendersky, Michael, W. Bruce Croft, and YanleiDiao. "Quality-biased ranking of web documents." In Proceedings of the fourth ACM international conference on Web search and data mining, pp. 95-104. ACM, 2011.