© 2018, IRJET | Impact Factor value: 6.171 | ISO 9001:2008 Certified Journal | Page 3449
TRAFFIC CONGESTION STUDY AND FINDING ALTERNATE ROUTES
USING GIS
SRUTHY S KUMAR
1, ARCHANA
2, SARATH SATHEESAN
3, NIKSON BABY
4, REHNA P
5, LIGIL
MATHEW
61, 2, 3, 4, 5
B-Tech Students, Civil Engineering, Vijnan Institute of Science and Technology, Kerala, India
6Assistant Professor, Department of Civil Engineering, Vijnan Institute of Science and Technology, Kerala, India
,
---***---Abstract
–General congestion related data collection and congestion management measure is labour intensive and a heavy investment is needed for these mitigation measures. Hence to make this work feasible, latest technologies like GIS will help to analyze the live traffic situation and suggest the cost effective measures to mitigate the congestion, an attempt was made to use GIS effectively for data collecting, data analyzing and result displaying process. Traffic was disrupted on the Kalady – Thanipuzha stretch. Geographic Information System (GIS) is a computer system for capturing, storing, querying, analyzing and displaying geographic data. GIS represents a new para diagram for the organization of the information and the design, the essential aspect of which is the use of concept of location as the basis of structuring of information systems. The advancement of GIS can be put to effective use to map and analyze road traffic situations using tools like linear referencing, spatial analysis and query which can be easily performed, enhanced by graphical representation. Road characteristics, vehicle origin and destination, vehicular traffic congestion nature and volume data can be integrated to enhance analysis of road traffic situation along road corridors.Key Words
:
GIS, Capturing, Storing, Querying,Analyzing, Displaying, Origin and destination, Traffic volume
1. INTRODUCTION
Kalady or kaladi is a census town located in Angamaly east of the Periyar river, in the Ernakulam district of Kerala, India, not far from Cochin International Airport. It is notable as the birthplace of Shankara, commonly known as Adi shankaracharya, and is a popular destination for Hindu pilgrims. Kalady came to prominence only after its rediscovery in the late 19th century by the then
Shankaracharya of Sringery and the subsequent consecration of an Adi Shankara temple in 1910.
Traffic was disrupted on Kalady – Thanipuzha stretch when a large crater developed on the Sree Sankara bridge at mc road, Kalady. The major routes through Kalady are Perumbavoor, Aluva, Angamaly, Malayatoor.
2. LITERATURE REVIEW
F. Farcas a, A. Sivertun IDA (2016) said that traffic noise pollution is a growing problem that highly affects the health
of people. To cope with this problem one has to regulate traffic or construct noise barriers inorder to implement effective measures against traffic noise information about its distribution- noise maps is imperative.
Ravindra Kumar Verma, Sangeeta Kumari & K. Tiwary(2014) proves that urbanization is an index of transformation from traditional rural economies to modern industrial one. It is a progressive concentration of population in urban unit. At the moment, India is one among the country of low level of urbanization. In the last 50 years the population of India has grown two-and- a-half times, but urban India has grown nearly 5 times. Planning and managing cities in the new era of globalization and economic liberalization would be a demanding task calling for new skills and approach.
Mr. R. Chandra Prathap, Mr. A. Mohan Rao (2014) shows that existing system of congestion management system requires more reliable data which is expensive to collect and maintain. Hence advancements in data collection and presentation techniques such as Global Positioning System (GPS) and geographic information system(GIS) if properly used will enhance a good traffic congestion management system.
Mazloh Al-Enazi(2016) Jeddah city is the second largest city in Saudi Arabia. Jeddah city has witnessed a remarkably rapid urban growth rate during the past four decades. The aim of this paper is to use many GIS functions (network analyst, shortest path) in evaluating traffic congestions point during working day hours according to road directions. One of the useful GIS functions to be used for this purpose is known as shortest path.
© 2018, IRJET | Impact Factor value: 6.171 | ISO 9001:2008 Certified Journal | Page 3450
M. Bhagyaiah & B. Shrnagesh(2014) said that globalization has impacted many developing countries across the world. India is one such country, which benefited the most.
There has been increasing trend in road accidents in Hyderabad over a few years. GIS helps in locating the accident hotspots and also in analyzing the trend of road accidents in Hyderabad.
Stephen Jones(2010) said that for this exercise was the Marsh area of Huddersfield, a medium- sized town in the West Yorkshire region of northern England. The impact of road on the environment is a subject of growing concern. Roads and traffic are variously condemned for increasing ambient noise levels, poor childhood respiratory health, loss of wildlife habitat, the division and dislocation of communities and many other manifestations of social and environmental pathology.
Hemant A. Pandit, Dr. Sumedh(2015) said that trend of urbanization, population increase and the increase in number of registered vehicles induces pressure on traffic movements and makes living in urban area more difficult. Latest technologies like GIS will help to analyze the live traffic situation and suggest the cost effective measures to mitigate the congestion.
3. METHODOLOGY
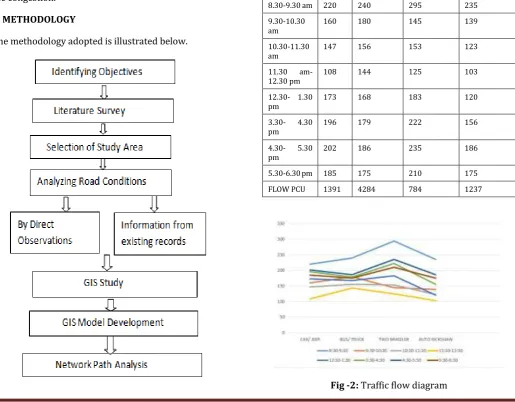
The methodology adopted is illustrated below.
01020304050607080901stQtr2ndQtr3rdQtr4thQtrEastWestNorth3.1 Study Area
Kalady - Thanipuzha is the selected area for conducting the traffic study. It is the place connecting major places like Malayatoor, Angamaly, Aluva, and Perumbavoor.
Fig-1 Kalady route map
3.2 Traffic Survey Details And Traffic Flow Diagram
[image:2.595.318.544.150.271.2]The average traffic survey data are listed below.
Table -1: Traffic survey data
TIME CAR/
JEEP BUS/ TRUCK TWO WHEELER AUTO RICKSHAW
8.30-9.30 am 220 240 295 235
9.30-10.30 am
160 180 145 139
10.30-11.30
am 147 156 153 123
11.30 am-
12.30 pm 108 144 125 103
12.30- 1.30
pm 173 168 183 120
3.30- 4.30
pm 196 179 222 156
4.30- 5.30
pm 202 186 235 186
5.30-6.30 pm 185 175 210 175
FLOW PCU 1391 4284 784 1237
[image:2.595.306.562.347.583.2] [image:2.595.44.560.378.780.2]© 2018, IRJET | Impact Factor value: 6.171 | ISO 9001:2008 Certified Journal | Page 3451 From this diagram we can easily identify that the peak time
of congestion and the type of vehicle causing the congestion.
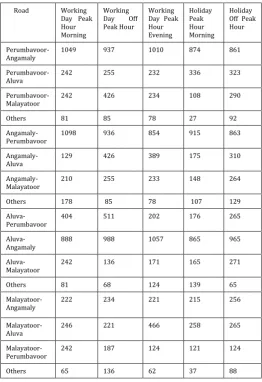
3.3 Origin And Destination Survey Details
[image:3.595.360.503.84.425.2]Traffic volume collected by means of origin and destination survey is give below.
Table-2: Origin And Destination Survey Data
Road Working Day Peak Hour Morning
Working Day Off Peak Hour
Working Day Peak Hour Evening Holiday Peak Hour Morning Holiday Off Peak Hour
Perumbavoor-
Angamaly 1049 937 1010 874 861
Perumbavoor-
Aluva 242 255 232 336 323
Perumbavoor-
Malayatoor 242 426 234 108 290
Others 81 85 78 27 92
Angamaly-
Perumbavoor 1098 936 854 915 863
Angamaly-
Aluva 129 426 389 175 310
Angamaly-
Malayatoor 210 255 233 148 264
Others 178 85 78 107 129
Aluva-
Perumbavoor 404 511 202 176 265
Aluva- Angamaly
888 988 1057 865 965
Aluva-
Malayatoor 242 136 171 165 271
Others 81 68 124 139 65
Malayatoor- Angamaly
222 234 221 215 256
Malayatoor-
Aluva 246 221 466 258 265
Malayatoor-
Perumbavoor 242 187 124 121 124
Others 65 136 62 37 88
3.4 GPS Survey Details
By using the mobile GPS application called GPS survey we take the GPS co-ordinates of certain locations. They are called control points.
Table- 3: GPS co-ordinates
LATTITUDE LONGITUDE 10.1617 76.44186 10.1631 76.44095 10.16401 76.4403 10.16461 76.43976
10.16541 76.43928 10.16876 76.44226 10.16825 76.44111 10.16595 76.43999 10.16606 76.43885 10.16339 76.43529 10.16465 76.43977 10.16708 76.43695 10.16659 76.43797 10.16624 76.43867 10.16561 76.43918 10.16502 76.43952 10.16399 76.43586 10.16464 76.4364 10.16513 76.43708 10.16554 76.43796 10.16648 76.43827 10.15917 76.44305 10.16587 76.43889 10.16593 76.43891
4. RESULT ANALYSIS
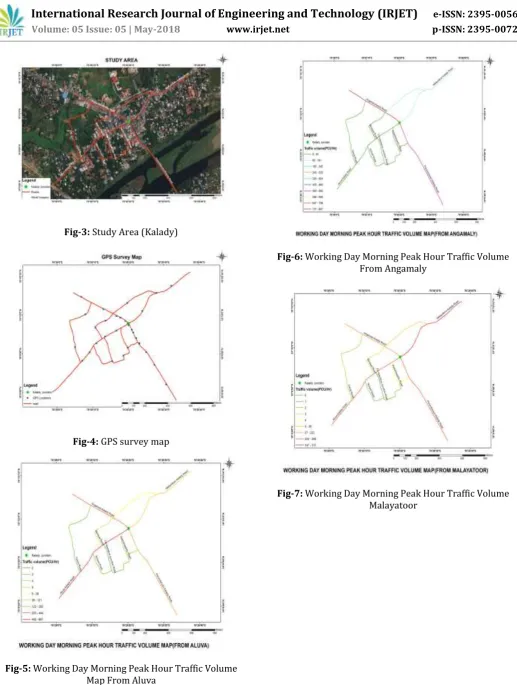
The results are represented in the form of maps. By those maps we can easily analyze the traffic volume through each routes and we can find the alternate routes. By suggesting alternate routes we can reduce the traffic volume and reduce the congestion at Kalady junction. Study area map, GPS maps, and traffic volume map with different origins are obtained by using the software. And these are used for the analysis and finding the alternate routes using GIS.
The main alternate routes obtained are Kadukkapilly road, Co-operative junction road, School road. Canal road, Mosque road and Sree sankara university road. These routes can be adopted at the time of congestion.
[image:3.595.30.293.189.572.2]© 2018, IRJET | Impact Factor value: 6.171 | ISO 9001:2008 Certified Journal | Page 3452
Fig-3: Study Area (Kalady)
Fig-4: GPS survey map
Fig-5: Working Day Morning Peak Hour Traffic Volume Map From Aluva
Fig-6: Working Day Morning Peak Hour Traffic Volume From Angamaly
[image:4.595.40.558.30.716.2] [image:4.595.319.554.52.269.2] [image:4.595.55.273.262.680.2] [image:4.595.324.543.312.501.2]© 2018, IRJET | Impact Factor value: 6.171 | ISO 9001:2008 Certified Journal | Page 3453
Fig-8: Working Day Morning Peak Hour Traffic Volume Map From Perumbavoor
5. CONCLUSION
By using the traffic congestion study using the GIS software, we find out the alternate routes and these routes can be adopted at time of congestion. Canal road, Mosque road, Sree Sankara University, Kadukkapilly road, Co-operative junction road and School road are the alternate routes that we obtained. At the time of congestion we can adopt these routes to reduce the traffic congestion at the Kalady intersection. As we explained in the role of GIS in the traffic study, here we can reduce the congestion spots.
Fig-9: Alternate Route Map
6. FUTURE SCOPE
Analysis is one of the major and most influential phases of infrastructure lifecycle. Some of the analysis that can be performed by GIS are Water distribution analysis, Traffic management analysis, Soil analysis, River and canal pattern analysis.
REFERENCES
[1] P. Pahlavani, F. Samadzadegan And M.R Delavar, “a gis –
based approach for urban multi-criteria”,2006.
[2] N.M.Waters,John Wiley And Sons, “Geographical
Information Systems, 2nd Edition”,1998.
[3] B. Ran And D.Boyce, “modelling dynamic transportation
network”, 1996.
[4] K. Chen And J.C.Miles, Newyork, 1999.
[5] M.A. Chowdhury And A.W. Sadek, “Fundamentals Of
Intelligent Transportation Systems Planning”, 2003.
[6] M. Morrow, “Evaluating Intelligent Transportation
System”, 2008.
[7] A.U. Frank, “A Theory For Geographic Information
Systems”, 2005.
[8] A.U. Frank And A. Greuenbacher, “Temporal Data, 2nd
[image:5.595.48.282.65.247.2] [image:5.595.46.282.433.617.2]