© 2016, IRJET | Impact Factor value: 4.45 | ISO 9001:2008 Certified Journal | Page 1130
EDUCATIONAL DATA MINING: CLUSTERING PROFICIENT STUDENTS
BASED ON KSA
Ashok.M.V
1, Apoorva.A
2, Dr.G.Suganthi
31
Head of the department, Dept. Of Computer Science, Teachers Academy, Bangalore,karnataka
2Assistant Professor, MCA Dept., GIMS, Bangalore,Karnataka
3
Associate Professor, Dept. of Computer Science,
Women’s Christian College, Nagercoil, Tamil Nadu, India
---***---Abstract -
Educational Data Mining is a part where in a
combination of techniques such as data mining, machine Learning and statistics, is applied on educational data to get valuable information. The objective of this paper is to cluster proficient students (skillful) among the students of the educational institution to predict placement chance. Data mining approach used is Clustering. Clustering algorithm used to accomplish this task is X-means based on KSA ( knowledge, Communication skill and attitude). To assess the performance of the algorithm, a student data set from an institution in Bangalore were collected for the study as a synthetic data. A model is proposed to arrive at the result. The accuracy of the results obtained from the algorithm was found to be promising when compared to other clustering algorithms.
Key Words: Educational data mining, clustering,
proficient student, X-means algorithm , KSA concept
1.INTRODUCTION
Educational Data Mining (EDM) is the presentation of
Data Mining (DM) techniques to educational data, and
so, its objective is to examine these types of data in
order to resolve educational research issues.
An institution consists of many students. For the
students to get placed, he/she should have good score
in KSA. KSA is nothing but Knowledge, communication
skills and attitude. This is one of the very important
criteria for selection of student while placing him/her.
It is also a known fact that better placements results in
good admissions. All the students will not have high
KSA score. Hence it is necessary to identify those
students who possess good KSA and who don’t. Thus
there is a need for clustering to eliminate students who
are not competent to be placed.
2. PROBLEM STATEMENT
Normally hundreds of students will be there in institutions. It is a tedious task and time consuming to predict placement chance for all students and it is not necessary also to predict placement chance for those students who are incompetent academically. Hence there is a need for clustering the proficient students having good KSA score whose placement chance can be predicted.
3. RELATED WORKS
© 2016, IRJET | Impact Factor value: 4.45 | ISO 9001:2008 Certified Journal | Page 1131
[image:2.595.49.272.89.267.2]1. METHODOLOGY
Fig 1: Proposed Methodology Concept and research framework
The methodology along with its computational processes for determining the proficient student, is outlined below: Step 1: Data collection.
Knowledge represented in terms of Marks scored in selected subjects of a student over a period of three years i.e., from June, 2011 to April, 2014 is considered and collected from an institution in Bangalore.
Step 2: Data preprocessing
Preprocessing was done using chi-square test for the goodness of fit to remove the attributes which doesn’t contribute to the result.
Step 3: X-means clustering technique
This step clusters proficient students among all the students of the institution using X-means clustering algorithm. Step 4: Evaluate the result
2. DATA DESCRIPTION Table 1: Database description
Variables Description Possible Values
Stu_id Id of the student {Int}
Name Name of the student {Text}
Sub Subject name {Text}
M1,M2,M3,M4 …
Marks scored in each subject
{1, 2, 3, 4, 5...100}
T Total marks { 1% - 100% }
Com (Communication {1, 2, 3, 4, 5...10}
skills+Attitude) score out of 10
Min Minimum marks for passing
a subject
32
Max Maximum marks for passing
a subject 100
Stu_Id :– ID of the student. It can take any integer values. Name :- Name of the student.
Sub :– represents the name of the subject. It can take only text values ranging from A-Z.
M1,M2,M3… :–various subject marks scored by a student. It can take only the numeric values from 0 to 100.
T: – total marks scored by each student represented in the form percentage i.e., 1% to 100%.
Com: –Communication and attitude score out of 10 Min:-Minimum marks for passing a subject
[image:2.595.305.527.466.598.2]Max :- Maximum marks for passing a subject 3. EXPERIMENTAL EVALUATION Step 1: Data collection
Table 2 : Input Table
Stu_id 1 2 3 4 …
Name Vikas Guru Sayed Deepak …
Sub Min Max M1 M2 M3 M4 M5
Ca 32 100 20 98 45 92 …
Bi 32 100 23 98 69 83 …
Java 32 100 24 97 67 74 …
Se 32 100 25 96 89 92 …
Cf 32 100 26 95 88 88 …
Db 32 100 28 90 56 81 …
… … … … .. … … …
T 624 1910
1416 1482 …
Com 7 9 7 8 …
This is an extract of the student database with the fields or variables listed above. Marks scored in selected subjects of a student over a period of three years i.e., from June, 2011 to April, 2014 is considered and collected from an institution in Bangalore.
Step 2: Data preprocessing:
© 2016, IRJET | Impact Factor value: 4.45 | ISO 9001:2008 Certified Journal | Page 1132 Chi-square test: is applied to remove the useless variable
[image:3.595.303.486.157.309.2]that doesn’t contribute to the result. From the above table II, name, max and min were removed.
Table 3: Preprocessed table
stu_id 1 2 3 4 …
Sub M1 M2 M3 M4 M5
ca 20 98 45 92 …
bi 23 98 69 83 …
java 24 97 67 74 …
se 25 96 89 92 …
cf 26 95 88 88 …
db 28 90 56 81 …
… … .. … … …
T 627 1910 1416 1482 …
Com 7 9 7 8 …
Steps of the X-means algorithm is explained below: Step 1: Clustering using X-means algorithm.
Step 1.1: Preprocessed table will be the input for X-means. Step 1.2: Cluster proficient student segment [PCS] and determine the exact number of clusters. The value of X is calculated using heuristic method by incrementing the value of X in each step by one and the results are shown below. Partition of PCS is done initially by taking X=2
[image:3.595.31.202.171.276.2]After Applying X-means clustering with X=2, we have Table- 6.3 : Partial view of clusters of students, for X=2 Cluster1 Cluster2
1 2
10 3
11 4
12 5
13 6
16 7
18 8
21 9
22 14
24 15
26 17
27 19
29 20
30 23
25 28
The above table shows the grouping of students into two groups. .
Table 6.4 : Difference between clusters for X=2
Cluster Cluster1 Cluster2
Custer 1 0 0.229
Custer 2 0. 229 0
For X= 2, the distance between the groups are labeled, in this 0.23 is the minimum value.
For X=3 applying X- means clustering, we have the following results
Table 6.5 : Partial view of three clusters, for X=3
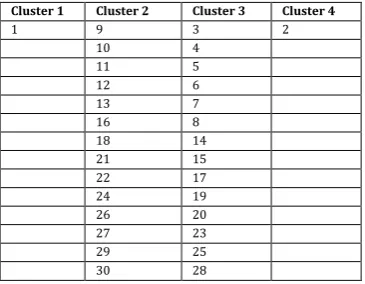
Cluster 1 Cluster 2 Cluster 3
1 9 2
10 24 3
11 4
12 5
13 6
16 7
18 8
21 14
22 15
26 17
27 19
29 20
30 23
25 28
The above table indicates the partial view of 3 -clusters. Table 6.6 : Differences between clusters
Cluster Cluster1 Cluster2 Cluster3
Custer 1 0 0.116 0.165
Custer 2 0.116 0 0.154
Custer 3 0.165 0.154 0
For X= 3, the distance between the groups are labeled, in this 0.12 is the minimum value
[image:3.595.29.103.486.629.2]For X=4: we have the following results.
Table 6.7 : Partial view of four clusters, for X=4
Cluster 1 Cluster 2 Cluster 3 Cluster 4
1 9 3 2
10 4
11 5
12 6
13 7
16 8
18 14
21 15
22 17
24 19
26 20
27 23
29 25
30 28
Table 6.8 : Comparison of distance between the clusters
Cluster Cluster1 Cluster2 Cluster3 Cluster4
Custer 1 0 0.104 0.187 0.342
Custer 2 0. 104 0 0.083 0.238
Custer 3 0.187 0.083 0 0.154
Custer 4 0.342 0.238 0.154 0
[image:3.595.303.486.503.645.2]© 2016, IRJET | Impact Factor value: 4.45 | ISO 9001:2008 Certified Journal | Page 1133 =0.104537 given in row 1 column 3.Similarly the other
values are calculated. This table is the resultant of application of X-means, incrementing value of X in every step by 1.
Table 6.9 : Cluster distance table
Number of cluster The short cluster distance
Cluster 2 0.2293
Cluster 3 0.1658
Cluster 4 0.3428
Cluster 5 0.3133
The first value 0.2293 in the shorter cluster distance field represents the distance between the cluster 1and 2,similarly the second value viz., 0.1658 represents the distance between 1 and 3. The other values in the table can be interpreted similarly.
From the above table it can be observed that, values in the ‘ shorter cluster distance’ attribute starts increasing by great extent i.e., from 0.1658 to 0.3428, after cluster 2..Hence it can be concluded that the maximum number clusters that can be formed is 3. So we choose X=3 and 3rd cluster because the centroid of the third cluster is nearest to maximum marks of the subjects i,e., 2000(20 subjects).
Step 2: Choosing the cluster
When X takes value 3 i.e., X=3, the 3rdcluster is chosen as the best cluster as the centroid value of the third cluster is nearest to maximum marks of the subjects i,e., 2000(20 subjects).
Step 3: Identifying the elements of the cluster.
Table 6.10: Elements of Cluster 3
Cluster
3 2 3 4 5 6 7 8 14 15 17 19 20 23 25 28
The table above represents the elements of the best cluster identified.
4. Results:
Cluster 3 is found to be the best cluster having the number of proficient students given below:
Table 7.1 : Elements of Cluster 3
Cluster
3 2 3 4 5 6 7 8 14 15 17 19 20 23 25 28
Calculation of Precision and Recall for X-Means and Other clustering algorithms
To analyze the accuracy of X-Means algorithm in comparison with other clustering algorithms like K-means fast and K-Medoids it is necessary to identify the number of elements placed correctly and incorrectly into the clusters. Following attributes represent the count of elements placed correctly and incorrectly in class A and class B.
Table no 7.2 : list of elements placed correctly and incorrectly in class A and B
ALGORITHM TA FA TB FB
X-Means 437508 50440 480293 59220
k-medoids 397940 61802 397940 169779
k-means fast 386752 69788 480457 90464
Table no
7.3
:Comparison of precision, recall and
accuracy for various algorithms
ALGORITHM PRECISION RECALL ACCURACY
X-Means 0.90 0.88 89.33
k-medoids 0.87 0.70 77.46
k-means fast 0.85 0.81 84.40
© 2016, IRJET | Impact Factor value: 4.45 | ISO 9001:2008 Certified Journal | Page 1134 Chart -1: Graph representing the values of Precision,
Recall and Accuracy for different algorithms
5. Conclusion
The main objective was to identify proficient students by clustering based on KSA concept using data mining approach. X-means algorithm was used to accomplish the same. It was found that cluster 3 having proficient students emerged among the students of the institution as the best cluster. The algorithm was compared with other clustering algorithms and it is observed that X- means outperformed other algorithms with an accuracy of 89.33%. Thus the solution for the above problem was found successfully. References
[1] Kim, S. Y., Jung, T. S., Suh, E. H., & Hwang, H. S. (2006). Student segmentation and strategy development based on student lifetime value: A case study. Expert Systemswith Applications, 31(1), 101–107.
[2] Shin, H. W., &Sohn, S. Y. (2004). Product differentiation and market segmentation as alternative marketing strategies. Expert Systems with Applications, 27(1), 27– 33.
[3] Jang, S. C., Morrison, A. M. T., & O’Leary, J. T. (2002). Benefit segmentation of Japanese pleasure travelers to the USA and Canada: Selecting target markets based on the profitability and the risk of individual market segment. Tourism Management, 23(4), 367–378. [4] Hruschka, H., & Natter, M. (1999). Comparing
performance of feed forward neural nets and k-means of cluster-based market segmentation. European Journal of Operational Research, 114(3), 346–353.
[5] Leon Bottou, YoshuaBengio, “Convergence Properties of the K-Means Algorithms”, Advances in Neural Information Processing Systems 7, 1995.
[6] Dan pelleg, Andrew Moree,"X-means: Extending
K-means with Efficient Estimation of the Number of Clusters"
[7] Thomas Laloe, Remi Servien, "The X-Alter algorithm : a parameter-free method to perform unsupervised clustering"
[8] Archer-North and Associates, “Performance Appraisal”, http://www.performance-appraisal.com, 2006, Accessed Dec, 2012.
[9] Chein, C., Chen, L., "Data mining to improve personnel selection and enhance human capital: A case study in high technology industry", Expert Systems with Applications, In Press (2006).
[10] K. Pal, and S. Pal, “Analysis and Mining of Educational Data for Predicting the Performance of Students”,(IJECCE) International Journal of Electronics Communication and Computer Engineering, Vol. 4, Issue 5, pp. 1560-1565, ISSN: 2278-4209, 2013.
[11] Z. N. Khan, “Scholastic achievement of higher secondary students in science stream”, Journal of Social Sciences, Vol. 1, No. 2, pp. 84-87, 2005.
[12] B.K. Bharadwaj and S. Pal. “Mining Educational Data to Analyze Students’ Performance”, International Journal of Advance Computer Science and Applications (IJACSA), Vol. 2, No. 6, pp. 63-69, 2011.
[13] M. Bray, The shadow education system: private tutoring and its implications for planners, (2nd ed.), UNESCO, PARIS, France, 2007.