© 2017, IRJET | Impact Factor value: 5.181 | ISO 9001:2008 Certified Journal
| Page 1056
SEISMIC ANALYSIS AND COMPARATIVE STUDY OF A STRUCTURE WITH
SHEARWALL AND WITHOUT SHEARWALL FRAME SYSTEM
Obaid Yassin, M-Tech (Structure and Foundation Engineering)
Rizwanullah, Assistant Professor
Department of Civil Engineering, Al-Falah University, Faridabad, India
---***---Abstract-
The main objective of the research work presented in this paper is to study the seismic behavior and to compare the results of buildings with reinforced concrete shearwall and without shearwall. Three buildings with same plan and equal number of storeys with two different configurations of shearwalls and one structure with no shearwall are considered. A brief review of design concept is presented and need of shear wall, effect of earthquake are discussed.Response spectrum analysis has been done to buildings with different configurations of shearwall with same plan.The storey displacements are obtained and compared to each other for different models to meet the shear wall effect.The analysis and design of models are done according to IS codes in an eco friendly software ETAB 2015.Key Words:
- Etabs , Response spectrum,Shearwall, Stiffness, Story drifts1. INTRODUCTION
Shear walls are vertical elements that resists the
horizontal forces. Shear walls are like
vertically-oriented wide beams that carry earthquake loads ,
wind loads and transfers them to the foundation.
Shear wall system is often used for resisting the
lateral forces caused by seismic excitation, because of
their high stiffness and strength. Shear wall can be
used effectively for controlling the drift against
seismic loads acting on them.
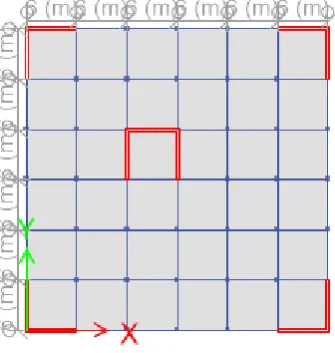
1.1 MODEL CONFIGURATION
Three buildings with thirty five story regular
reinforced concrete building are considered in
seismic zone IV. The beam length in (x) transverse
direction are 6m ,and beams in (y) direction are of
length 6m. Figure 1 and 2 shows the plan and 3D
view of the thirty five story building having 7 bays in
x-direction and seven bays in y-direction upto
twenty story and five bays in x-direction and five
bays in y-direction from story twenty one to thirty
five. Story height of each building is assumed
3m.Beam cross section 450X600 mm and Column
cross section is 750x750 mm (upto 10 floors),
600x600 (from 11
thstory to 20
thstorey) and
450x450 above
.
Fig-1.1:Building1 Fig-1.2:Buildind2
© 2017, IRJET | Impact Factor value: 5.181 | ISO 9001:2008 Certified Journal
| Page 1057
Fig-1.4:Plan Of Building 2
Fig-1.5:Plan Of building 1
Fig-1.6:Plan Of Building3
1.2 TIME PERIOD
IS-1893-2016 defines different Sa/g values for
different values of approximate time period (T).
The fundamental natural period (Ta) is taken for
moment resisting frame building without brick infill
panels as Ta = 0.075h
0.75, Where, h = Height of the
building in m
Table 1.1- Time Period for Building 1,2 and 3 .
Time Period Building 1 Building 2 Building 3 Global x 2.46sec 2.46sec 2.46sec Global y 2.46sec 2.46sec 2.46sec
1.3 DESIGN BASE SHEAR
The design base shear of a building can be calculated
by using the code IS-1893-2002
V
b=A
h*W
Where A
h=design horizontal seismic coefficient
W= seismic weight
The Design horizontal seismic coefficient (Ah) is a
function of peak ground acceleration (z), Importance
Factor (I), Response Reduction Factor (R) and Design
acceleration coefficient (Sa/g) for different types of
soil normalized corresponding to 5 % damping.
© 2017, IRJET | Impact Factor value: 5.181 | ISO 9001:2008 Certified Journal
| Page 1058
Table 1.2- Design Base Shear of Building 1,2 and 3 for Equivalent Static Load
Design base shear
Building 1 Building 2 Building 3
Global X(KN)
4524.8659 4647.1664 1949.8072
Global Y(KN)
4507.9978 4860.1705 1894.1824
[image:3.595.51.549.316.797.2]1.4 STIFFNESS
Table-1.3:Story Stiffness in x direction for equalent static loads
Story SW2 SW1 WSW
Story35 118793.7 120253.7 177090.4 Story34 248371.8 231602 264527.4 Story33 366247.6 321026.3 309371.3 Story32 471965.9 391462.8 337344.7 Story31 566407.5 447765 356611.4 Story30 650790.7 493787.8 370874.1 Story29 726590 532496.3 382037.7 Story28 795403.3 566181.5 391199.9 Story27 858858.6 596746.5 399041.5 Story26 918594.3 626009 406011.8 Story25 976279.2 656094.7 412431.8 Story24 1033621 690058.6 418554 Story23 1092718 733406.6 425075.7 Story22 1155339 795987.3 435797.6 Story21 1227680 922322.9 508573 Story20 1381498 1476312 1228143 Story19 1482575 1589763 1251401 Story18 1585220 1700410 1264875 Story17 1678840 1803913 1273926 Story16 1767401 1904355 1282296 Story15 1852962 2004154 1290421 Story14 1938149 2106076 1298612 Story13 2025946 2213332 1307026 Story12 2119832 2330048 1315901
Story11 2225127 2459581 1325328 Story10 2340574 2617225 1337849 Story9 2512603 2811380 1526922 Story8 2678568 3026401 1541771 Story7 2902680 3306739 1558958 Story6 3198674 3677287 1588130 Story5 3616874 4197985 1654464 Story4 4255396 4988078 1848429 Story3 5354901 6339829 2712356 Story2 7675323 9175584 9790680 Story1 16868653 20218692 9787738
Base 0 0 0
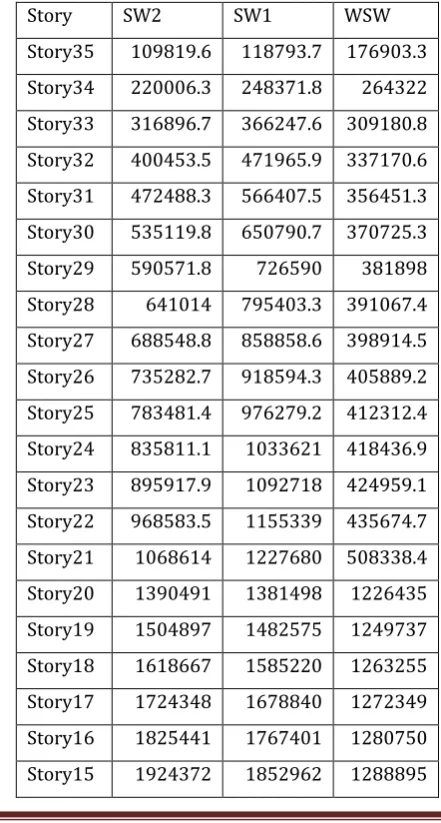
Table -1.4Storey Stiffness in Y Direction for equalent
Story SW2 SW1 WSW
Story35 109819.6 118793.7 176903.3 Story34 220006.3 248371.8 264322 Story33 316896.7 366247.6 309180.8 Story32 400453.5 471965.9 337170.6 Story31 472488.3 566407.5 356451.3 Story30 535119.8 650790.7 370725.3 Story29 590571.8 726590 381898 Story28 641014 795403.3 391067.4 Story27 688548.8 858858.6 398914.5 Story26 735282.7 918594.3 405889.2 Story25 783481.4 976279.2 412312.4 Story24 835811.1 1033621 418436.9 Story23 895917.9 1092718 424959.1 Story22 968583.5 1155339 435674.7 Story21 1068614 1227680 508338.4 Story20 1390491 1381498 1226435 Story19 1504897 1482575 1249737 Story18 1618667 1585220 1263255 Story17 1724348 1678840 1272349 Story16 1825441 1767401 1280750 Story15 1924372 1852962 1288895
[image:3.595.320.541.368.780.2]© 2017, IRJET | Impact Factor value: 5.181 | ISO 9001:2008 Certified Journal
| Page 1059
Story14 2024081 1938149 1297098 Story13 2127940 2025946 1305513 Story12 2240151 2119832 1314382 Story11 2364400 2225127 1323796 Story10 2514230 2340574 1336297 Story9 2698239 2512603 1524914 Story8 2905313 2678568 1539730 Story7 3175510 2902680 1556866 Story6 3535163 3198674 1585953 Story5 4045141 3616874 1652073 Story4 4828176 4255396 1845557 Story3 6188443 5354901 2705164 Story2 9112720 7675323 9789972 Story1 20854936 16868653 9787049
Base 0 0 0
1.5 MAXIMUM STORY DISPLACEMENTS
Table-1.5:Max Displacement in Y Direction
story WSW SW1 SW2
Story35 111.432 70.293 77.939 Story34 109.978 68.087 75.615 Story33 108.007 65.848 73.16 Story32 105.52 63.574 70.566 Story31 102.547 61.258 Story30 99.12 58.896 64.92 Story29 95.272 56.489 61.872 Story28 91.034 54.039 58.687 Story27 86.439 51.55 55.381 Story26 81.518 49.03 51.974 Story25 76.301 46.486 48.494 Story24 70.82 43.929 44.97 Story23 65.106 41.373 41.443 Story22 59.196 38.832 37.965 Story21 53.177 36.322 34.6 Story20 47.833 33.869 31.549 Story19 45.45 31.54 29.326 Story18 42.961 29.24 27.134
Story17 40.366 26.98 24.98 Story16 37.672 24.754 22.862 Story15 34.891 22.563 20.78 Story14 32.037 20.409 18.738 Story13 29.122 18.295 16.74 Story12 26.159 16.229 14.793 Story11 23.159 14.218 12.906 Story10 20.133 12.273 11.089 Story9 17.096 10.402 9.355 Story8 14.406 8.641 7.723 Story7 11.72 6.976 6.192 Story6 9.045 5.43 4.782 Story5 6.407 4.021 3.509 Story4 3.864 2.771 2.391 Story3 1.578 1.707 1.453
Story2 0 0.86 0.719
Story1 0.196 0.269 0.219
Base 0 0 0
Chart-1:Max Displacement in mm in Y direction
Table-1.6:Max Displacement in x direction
story WSW SW1 SW2
Story35 111.323 70.293 91.451 Story34 109.87 68.087 89.366 Story33 107.901 65.848 86.971 Story32 105.415 63.574 84.228 Story31 102.444 61.258 81.113
-50 0 50 100 150
0 20 40
Displacem ent,mm
Storey
Displacement in Y Direction
WSW
SW1
© 2017, IRJET | Impact Factor value: 5.181 | ISO 9001:2008 Certified Journal
| Page 1060
Story30 99.019 58.896 77.629 Story29 95.172 56.489 73.79 Story28 90.936 54.039 69.618 Story27 86.342 51.55 65.144 Story26 81.422 49.03 60.403 Story25 76.207 46.486 55.438 Story24 70.728 43.929 50.309 Story23 65.015 41.373 45.097 Story22 59.107 38.832 39.928 Story21 53.09 36.322 34.999 Story20 47.737 33.869 31.158 Story19 45.358 31.54 29.013 Story18 42.872 29.24 26.888 Story17 40.281 26.98 24.788 Story16 37.589 24.754 22.713 Story15 34.812 22.563 20.665 Story14 31.961 20.409 18.65 Story13 29.05 18.295 16.675 Story12 26.09 16.229 14.748 Story11 23.094 14.218 12.878 Story10 20.071 12.273 11.075 Story9 17.038 10.402 9.355 Story8 14.352 8.641 7.735 Story7 11.669 6.976 6.215 Story6 8.998 5.43 4.813 Story5 6.364 4.021 3.544 Story4 3.828 2.771 2.428 Story3 1.552 1.707 1.487
Story2 0 0.86 0.745
Story1 0.187 0.269 0.232
Base 0 0 0
Chart-2:Displacement in X Direction
1.6STORY DRIFTS
Table-1.7:Story drifts of buildings with shearwalls i.e building 1(B1) &building 2(B2) due to Response
spectrum.
story B2 RSX B2 RXY B1 RSX B1 RXY Story35 0.00044 0.000548 0.000481 0.000479 Story34 0.00053 0.000556 0.000489 0.000487 Story33 0.00063 0.000563 0.000496 0.000494 Story32 0.00072 0.000587 0.000504 0.000502 Story31 0.00081 0.000613 0.000512 0.00051 Story30 0.00088 0.000637 0.000518 0.000516 Story29 0.00094 0.000657 0.000523 0.000521 Story28 0.001 0.000673 0.000525 0.000523 Story27 0.00105 0.000685 0.000526 0.000524 Story26 0.0011 0.000691 0.000525 0.000523 Story25 0.00113 0.000691 0.000521 0.000519 Story24 0.00114 0.000684 0.000515 0.000513 Story23 0.00112 0.000667 0.000506 0.000504 Story22 0.00106 0.00064 0.000494 0.000493 Story21 0.00087 0.000583 0.000478 0.000477 Story20 0.0004 0.000415 0.00045 0.000449 Story19 0.0004 0.000411 0.000443 0.000441 Story18 0.0004 0.000406 0.000434 0.000433 Story17 0.0004 0.000402 0.000428 0.000427 Story16 0.0004 0.000398 0.000424 0.000422 Story15 0.00039 0.000393 0.00042 0.000419
-50 0 50 100 150
0 20 40
D I S P L A C E M E N
T , m m
STORY
Displacement in x dirction
WSW
SW1
© 2017, IRJET | Impact Factor value: 5.181 | ISO 9001:2008 Certified Journal
| Page 1061
Story14 0.00039 0.000388 0.000417 0.000415 Story13 0.00038 0.000382 0.000413 0.000412 Story12 0.00037 0.000374 0.000409 0.000407 Story11 0.00036 0.000366 0.000402 0.000401 Story10 0.00035 0.000354 0.000395 0.000394 Story9 0.00033 0.000339 0.000381 0.000379 Story8 0.00032 0.000324 0.000369 0.000367 Story7 0.0003 0.000305 0.000351 0.00035 Story6 0.00027 0.000281 0.000329 0.000327 Story5 0.00025 0.000253 0.0003 0.000299 Story4 0.00021 0.000218 0.000263 0.000262 Story3 0.00017 0.000175 0.000216 0.000215 Story2 0.00012 0.000123 0.000156 0.000155
Story1
7.00E-05 6.60E-05 8.80E-05 8.70E-05
Base 0 0 0 0
Table-1.8:Story drifts of buildings with shearwalls i.e building 3(B3) due to Response spectrum.
Story B3 RSX B3 RSY Story35 0.000369 0.000367 Story34 0.000522 0.000519 Story33 0.000671 0.000668 Story32 0.000803 0.000799 Story31 0.000915 0.00091 Story30 0.001007 0.001002 Story29 0.001082 0.001077 Story28 0.001145 0.00114 Story27 0.0012 0.001194 Story26 0.001252 0.001245 Story25 0.0013 0.001294 Story24 0.001345 0.001339 Story23 0.001384 0.001377 Story22 0.0014 0.001393 Story21 0.001235 0.001229 Story20 0.000544 0.000541 Story19 0.000574 0.000571
Story18 0.000609 0.000606 Story17 0.000645 0.000642 Story16 0.000678 0.000675 Story15 0.000706 0.000703 Story14 0.000729 0.000725 Story13 0.000748 0.000744 Story12 0.000765 0.000761 Story11 0.000782 0.000778 Story10 0.000799 0.000795 Story9 0.000723 0.000719 Story8 0.000737 0.000733 Story7 0.000751 0.000747 Story6 0.000766 0.000763 Story5 0.000786 0.000782 Story4 0.000816 0.000812 Story3 0.000872 0.000867 Story2 0.000993 0.000988 Story1 0.001311 0.001305
Base 0 0
Chart-3:Story Drifts of buildings 1,2 and 3 due to response spectrum
2. CONCLUSIONS
The analysis of buildings considering shear wall at
different positions and orientation we conlude by
the results given in tables above that the maximum
displacement at top story occurs in building with no
shear wall (building 3) with a displacement of
0 0.0005 0.001 0.0015
0 20 40
Displacem ent,mm
STORY STORY DRIFTS
B2 RSX
B2 RXY
B1 RSX
B1 RXY
B3 RSX