Challenges Faced During Designing, Simulation of
Microstrip Patch Antenna in HFSS and Testing
Af-ter Fabrication
Devwrat Shah#1, Rashmi Rajgure#2, Tejas Tandalekar#3, V.R.Waghmare#4
#E&Tc Department, Marathwada Mitra Mandal’s Institute of Technology Lohgaon,Affiliated to Savitribai Phule Pune University
Abstract: The Microstrip antenna we are designing here needs to go through the following three stages theoretical calculations, simulation and testing after fabrication. In the process of testing we are comparing the obtained results with the ideal values of antenna characteristics but when we analyzed the compared results, we could see that the results diverted from the ideal values. This paper is mainly focused on the various challenges faced during the designing, simulation and fabrication of microstrip an-tenna.
Keywords-- HFSS, Patch Antenna, VSWR, S-Parameter, SMA connector
I. INTRODUCTION
Microstrip antenna is the good choice for wireless communication and wireless devices because of their properties like light weight, low cost, low-profile, small dimension easy fabrication, advantages, compactness and its efficiency . Though the antenna is small in size still it gives good results in terms of radiation pattern, return loss, VSWR.
In designing of MSA, first we have to calculate the different designing parameters of patch antenna by theoretical method. After calculating designing parameters, we design antenna on HFSS. After designing, we have got simulated results. Considering the di-mensions of design, we have fabricated the antenna. Here, we have got some differences in simulated results and the tested antenna results. For the same, we have mentioned the reasons and results during the processes in the paper further.
II. DESIGNPROCESS
We are designing Microstrip antenna with 2.4 GHz. Frequency using glass epoxy as the substrate. Here are the three steps for de-signing of Microstrip antenna.
A. Designing Calculations
We are designing antenna for the frequency of 2.4 GHz using dielectric constant of 4.4 of height 1.6mm. Using this values we have calculated width and length of patch, effective dielectric constant, effective length. Considering these parameters, we have deter-mined dimensions of substrate. The width of feedline is designed by considering the input impedance of 50 ohm.
B. Simulation Process
We have deigned antenna using HFSS with following steps for designing MSA in HFSS:
1) Draw the geometric models.
2) Create Perfectly Matched Boundaries
3) Add the Excitation
4) Setup Mesh Operations
5) Specify solution setting for the design.
6) Validate the design setups.
7) Run HFSS simulations.
C. Fabrication Process
A. Designing Calculations
One of the important part of antenna designing is the selection of substrate which has particular dielectric constant and should not change its characteristics in any circumstances.
B. Simulation Process
Even a small change in dimensions of patch affects the fringing fields from the edges. It affects the effective length, thereby chang-ing the resonance frequency. In the simulation process assignchang-ing of waveport is very important. The feed is fed with coaxial cable with proper calibration of antenna with short circuit and open circuit current and proper termination of transmission line whereas there is no such concept of feeding through cable present in the HFSS software. So, the energy is provided with the help of a sheet called as waveport, placed at the beginning of the feedline to provide excitation to the waveport. Assigning proper boundary condi-tions in simulation process is most critical parameter. A boundary can be assigned to any two-dimensional area such as a plane, a face of an object or an interface between two objects. Most boundary conditions are used to define electromagnetic characteristics such as conductivity or resistivity. This also includes exciting the structure, and hence any error can result in inaccurate results.
C. Fabrication and Testing Process
There is a little variation in the parameters studied in simulation process and results obtained after fabrication process.
After fabrication of antenna, antenna radiates in the atmosphere. At the time of radiation of antenna, there are many metallic objects present in the environment which affects the propagation of electromagnetic waves. Due to these objects, reflections of EM waves take place. This leads to the variation in radiation pattern of antenna. Thus, we get variation in the antenna characteristics.
The differences in the results after fabrication can also have a reason of manufacturing defects. It may contain impurities present in the material used for antenna fabrication. Also the environmental conditions like humidity; high temperature affects the charge dis-tribution of patch which affects the characteristics of an antenna.
IV. RESULTS
A. Ideal Results
These are the ideal values considering which we have determined the values for simulation process.
1) Frequency = 2.4 GHz
2) S-Parameter (Return Loss) = less than -10dB
3) VSWR = in between 1 and 2
B. Simulation Results 1) Frequency = 2.3976 GHz
2) S-Parameter (Return Loss) = -15.70dB
3) VSWR = 1.5
Fig.2 VSWR
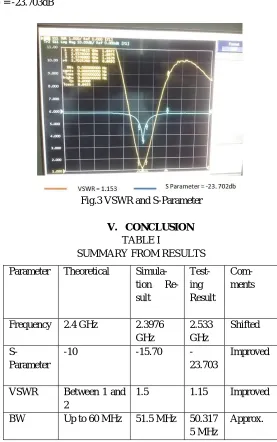
B. Practical Results
It could be seen that the simulated and fabricated results are almost similar.
1) Frequency = 2.53 GHz
2) S-Parameter (Return Loss) = -23.703dB
3) VSWR = 1.15
Fig.3 VSWR and S-Parameter
V. CONCLUSION
TABLE I
SUMMARY FROM RESULTS
Parameter Theoretical Simula-tion Re-sult Test-ing Result Com-ments
Frequency 2.4 GHz 2.3976 GHz 2.533 GHz Shifted S-Parameter
-10 -15.70
-23.703
Improved
VSWR Between 1 and 2
1.5 1.15 Improved
BW Up to 60 MHz 51.5 MHz 50.317 5 MHz
feedline. The variations in testing results are subject to real time boundary conditions in present medium, various reflections from objects and external EM interferences.
REFERENCES
[1] Constantain.A. Balanis,Antenna Theory Analysis and Design. III Edn, Wiley-Interscience.AJohnWiley&sonsInc.Pulication, 2005.
[2] KUNAL PARIKH,“SIMULATION OF RECTANGULAR,SINGLE LAYER ,COAX FEED PATCH ANTENNA USING AGILENT HIGH FREQUENCY STRUCTURE S
IMULA-TOR”,2003
[3] CALAFELL,P.J.FERRER,J.M.GONZALEZ-ARBESU AND J.ROMEU,“MICROSRIP PATCH ANTENNA DESIGN USING ARTIFICIAL MATERIAL LOADINGS”,ANTENNA
LAB-TSC,UNIVERSITAT POLITECNICA DE CATALUNYA (UPC) C/JORDI GIRONA,1-3,D3-212,08034BARCELONA,SPAIN
[4] A.D.YAGHJIAN,S.R.BEST,“IMPEDANCE,BANDWIDTH AND Q FOR ANTENNAS”,IEEETRAN.ANTENNAS PROPAG., VOL.53, NO.4,PP.1298-1324,APRIL 2005.
[5] KEITHR.CARVER,JAMES W.MINK,MEMBER,“MICROSTRIP ANTENNA TECHNOLOGY”,IEEETRANSACTIONS ON ANTENNAS AND PROPAGATION,VOL. "-29, NO.1,JANUARY1981
[6] DALIA NASHAAT,“HALA A.ELSADEK,ESMAT ABDALLAH,HADIA ELHENAWY,MAGDY F.ISKANDER,”ELECTROMAGNETIC ANALYSES AND AN EQUIVALENT