Developing Noise Pollution Linear Regression
Model of Una Town
Alpesh K. Sankhat1, Prof. C. B. Mishra2, Prof. Aakar N. Roghelia3
1 M. Tech (TE), Student, 2 Associate Professor in Civil Engineering,
3 AssistantProfessor, Department of Mathematics, BVM Engineering College, V. V. Nagar, Anand, India.
Abstract- Pollution is the main issue everywhere throughout the globe. Today's reality is finding a way to battle against air pollution, water pollution and land pollution; however fewer eyes are on noise pollution. It has the third dangerous risk to earth after air and water pollution as per World Health Organization (WHO). Noise pollution can neither be seen, touched nor noticed however it effect slightly individuals and on animals. Road transportation is one of the significant wellsprings of noise pollution in Una town. From this review, it was watched that vehicle noise pollution is more than 80dB and this is because of absence of legitimate activity framework, driver training, congestion, tire road interaction and vehicle engine noise. Direct relapse investigation was performed to create relationship of the average noise and most extreme noise with aggregate vehicles. Hoping to pattern of noise level, noise pollution legislation and observing is prescribed as a piece of control measures.
Keywords: Noise pollution, vehicular traffic, correlation, noise pollution legislation.
I. INTRODUCTION
This period of new advancements and improvement has welcomed numerous inconspicuous real issues. One of them is pollution. Expanding development rate of vehicles has contributed significantly towards noise pollution. The general population working and abiding close to the fringe of the highway are vanquished by the evil impacts of the noise pollution [2]. The noise levels of activity noise in urban territories surpasses as far as possible and influences the people and in addition creatures. The general population taking a shot at the outskirts of the street particularly national thruway or state expressway and are presented to noise levels more than 75 dB, for 8 hours are probably going to experience the ill effects of mental and additionally physical scatters [5]. The present review manages the noise pollution in Una town. It demonstrates the information of noise pollution review which was done at three distinct areas for 18 hours at every area. In view of the noise level information, the relationship between noise levels and the vehicular movement is discovered. The review additionally proposes a portion of the medicinal measures for decrease of the high noise levels in the Una Town.
Una town is situated on the outskirts of the National Highway 8 E, now known as NH 51. The population of the town is 58528 according to enumeration 2011.The noteworthy disadvantage of the town is that it does not have a bypass. So the greater part of the movement particularly the overwhelming business vehicles whose goal are business centre point like Veraval and so on needs to go through the CBD range of the Una town. This can be viewed as a noteworthy wellspring of movement noise pollution.
II. STUDY AREA PROFILE
The choice of UNA town NH8E as the study area (see Figure 1) was due to the fact that this road could serve as a typical traffic noise pollution source as it becomes the important operating route connecting Bhavnagar and Somnath. Noise level is unavoidably high and yet it is given little or no consideration on environmental policies, implementation and enforcement. Here limestone business is most prominent which grabs revenue of nearly 80-90 crores per month and has becoming the main transit access road, which qualifies it as a good sampling area to gather data to generate a representative model for traffic noise pollution. The study has been completed in Una Town (Figure 1) located at 20.8235°N, 71.0409°E Gujarat which is growing unevenly on the edges of NH 8E. The noise levels were measured at three different sites:
A. Site 1: Near Trikon baug.
B. Site 2: Vegetable Market Road.
Figure 1: Location of Study Area
III. METHODOLOGY
The measurement instrument used in this study was sound level meter of Class 2, Model SL-1352, manufactured by HTC. Sound level meter SL-1352. All readings were made by SL-1352 sound level meter with calibrated condenser microphone. The microphone of the sound level meter was guarded by polyurethane windscreen, in order to eliminate wind effects on measurements as recommended by ISO-1996/1:2003 standard. Measurements were made at for 18 hours, between 06:00 am to 12:00 mid night at each site. The data was collected for both direction of traffic at each sites. Sound level meter was placed at a uniform height of 1.2 meter from the ground and was placed at a distance of 3 meters away from the edge of the road pavement, as recommended by ISO-1996/1:2003 standard. Classified Volume Count Study was carried out simultaneously at the time of survey, to get the data related to total number of vehicles passing at each sites. The data obtained were analysed and the correlation between total number of vehicles and noise levels was obtained using excel software.
IV. RESULTS AND DISCUSSION
From the data collected at three different sites, following results were drawn. The tables below shows the total vehicles passed and prevailing noise levels at a particular site within a given interval of time.
Table 1: Data of Site 1 (Flow of Traffic: Upstream On Una-Veraval Road)
Time Total Vehicles
Average Noise Levels
Max. Noise Levels
06:00 Am To 08:00 Am 1601 78.1125 80.6
08:00 Am To 10:00 Am 1742 82.775 88.6
10:00 Am To 12:00 Pm 1745 84.4375 88.1
12:00 Pm To 02:00 Pm 1726 82 88.7
02:00 Pm To 04:00 Pm 1733 82.6875 88.7
04:00 Pm To 06:00 Pm 1765 82.9125 87.3
06:00 Pm To 08:00 Pm 1721 81.25 88.6
08:00 Pm To 10:00 Pm 1728 79.6125 87.4
Figure 2: Graph 1 Figure 3: Graph 2
Table 1 shows the total number of vehicles passed and average and maximum noise levels at the interval of 2 hours. The Graph 1and Graph 2 shows the equation and correlation of the data of total number of vehicles with average noise levels and maximum noise levels respectively. The equation obtained is helpful to find out average noise levels or maximum recorded noise levels at Site 1 if the number of vehicles of the upstream traffic flow is known.
[image:4.612.95.550.73.282.2]Similarly the data of different sites with different direction of traffic flow are shown in tables below. Also the graphs of correlation and equation of the linear relationship between total vehicles passed and average noise levels and maximum recorded noise levels, prevailing at different sites with different direction of traffic flow, are shown below.
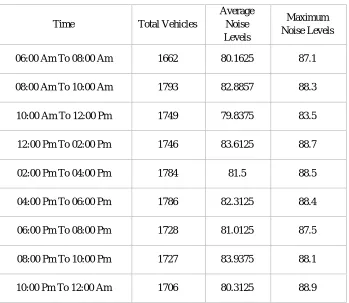
Table 2: Data of Site 1 (Flow of Traffic: Downstream On Una-Veraval Road)
Time Total Vehicles
Average Noise Levels
Maximum Noise Levels
06:00 Am To 08:00 Am 1662 80.1625 87.1
08:00 Am To 10:00 Am 1793 82.8857 88.3
10:00 Am To 12:00 Pm 1749 79.8375 83.5
12:00 Pm To 02:00 Pm 1746 83.6125 88.7
02:00 Pm To 04:00 Pm 1784 81.5 88.5
04:00 Pm To 06:00 Pm 1786 82.3125 88.4
06:00 Pm To 08:00 Pm 1728 81.0125 87.5
08:00 Pm To 10:00 Pm 1727 83.9375 88.1
10:00 Pm To 12:00 Am 1706 80.3125 88.9
y = 0.0173x + 52.145 R² = 0.719
75 76 77 78 79 80 81 82 83 84 85
0 500 1000 1500 2000
A
v
er
ag
e
N
o
is
e
L
ev
el
s
Total Vehicles
y = 0.0217x + 50.049 R² = 0.7034
79 80 81 82 83 84 85 86 87 88 89 90
0 500 1000 1500 2000
M
axi
m
um
N
o
is
e
L
ev
el
s
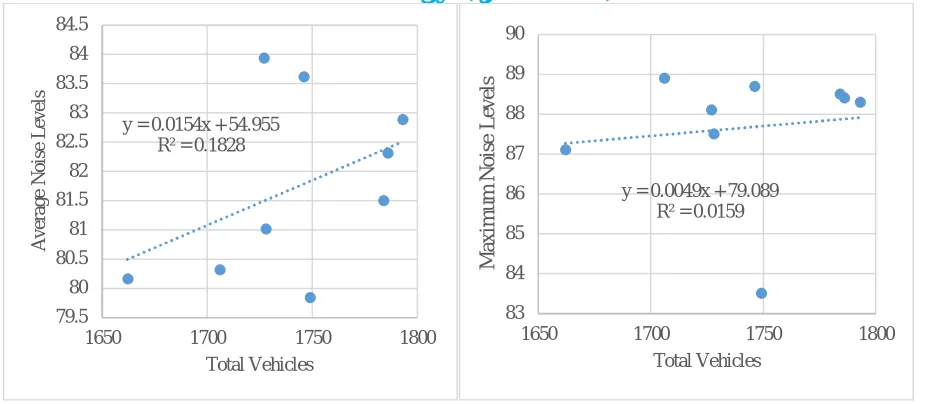
[image:4.612.134.483.411.714.2]Figure 4: Graph 3 Figure 5: Graph 4
Table 3: Data of Site 2 (Flow of Traffic: Upstream on Una-Veraval Road)
Time Total
Vehicles
Average Noise Levels
Maximum Noise Levels 06:00 Am To 08:00 Am 1687 79.3 84.2 08:00 Am To 10:00 Am 1662 79.5125 84.7 10:00 Am To 12:00 Pm 1792 82.5 87.7 12:00 Pm To 02:00 Pm 1717 79.8875 83.6 02:00 Pm To 04:00 Pm 1730 81.5285714 87.9 04:00 Pm To 06:00 Pm 1802 84.22857 87.8 06:00 Pm To 08:00 Pm 1670 80.9428571 88.1 08:00 Pm To 10:00 Pm 1736 80.8285714 85.3 10:00 Pm To 12:00 Am 1470 75.3125 80.3
y = 0.0154x + 54.955 R² = 0.1828
79.5 80 80.5 81 81.5 82 82.5 83 83.5 84 84.5
1650 1700 1750 1800
A v er ag e N o is e L ev el s Total Vehicles
y = 0.0049x + 79.089 R² = 0.0159
83 84 85 86 87 88 89 90
1650 1700 1750 1800
M a xi m um N o is e L ev el s Total Vehicles
y = 0.0239x + 39.994 R² = 0.8907
74 76 78 80 82 84 86
0 500 1000 1500 2000
A v er ag e N o is e L ev el s Total Vehicles
y = 0.0213x + 49.32 R² = 0.6267
79 80 81 82 83 84 85 86 87 88 89
0 500 1000 1500 2000
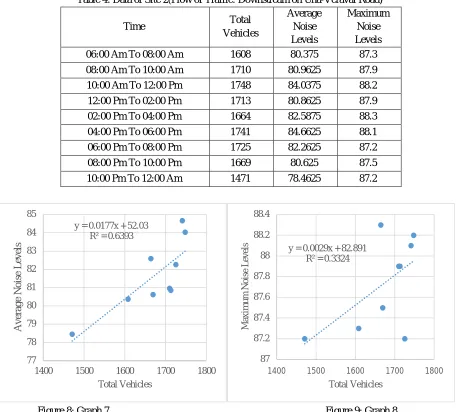
Table 4: Data of Site 2(Flow of Traffic: Downstream on Una-Veraval Road)
Time Total Vehicles
Average Noise Levels
[image:6.612.75.531.83.495.2]Maximum Noise Levels 06:00 Am To 08:00 Am 1608 80.375 87.3 08:00 Am To 10:00 Am 1710 80.9625 87.9 10:00 Am To 12:00 Pm 1748 84.0375 88.2 12:00 Pm To 02:00 Pm 1713 80.8625 87.9 02:00 Pm To 04:00 Pm 1664 82.5875 88.3 04:00 Pm To 06:00 Pm 1741 84.6625 88.1 06:00 Pm To 08:00 Pm 1725 82.2625 87.2 08:00 Pm To 10:00 Pm 1669 80.625 87.5 10:00 Pm To 12:00 Am 1471 78.4625 87.2
[image:6.612.136.477.538.721.2]Figure 8: Graph 7 Figure 9: Graph 8
Table 5: Data of Site 3 (Flow of Traffic: Upstream on Una-Veraval Road)
Time Total Vehicles Average Noise Levels
Maximum Noise Levels 06:00 Am To 08:00 Am 1617 75.4 79.3 08:00 Am To 10:00 Am 1700 79.9125 85.2 10:00 Am To 12:00 Pm 1698 81.8 88.4 12:00 Pm To 02:00 Pm 1700 78.7428571 80.5 02:00 Pm To 04:00 Pm 1693 77.85 81.5 04:00 Pm To 06:00 Pm 1720 83.7625 87.9 06:00 Pm To 08:00 Pm 1702 83.6375 88 08:00 Pm To 10:00 Pm 1707 81.9625 87.1 10:00 Pm To 12:00 Am 1543 77.8375 85.4
y = 0.0177x + 52.03 R² = 0.6393
77 78 79 80 81 82 83 84 85
1400 1500 1600 1700 1800
A
v
er
a
ge
N
o
is
e
L
ev
el
s
Total Vehicles
y = 0.0029x + 82.891 R² = 0.3324
87 87.2 87.4 87.6 87.8 88 88.2 88.4
1400 1500 1600 1700 1800
M
axi
m
um
N
o
is
e
L
ev
el
s
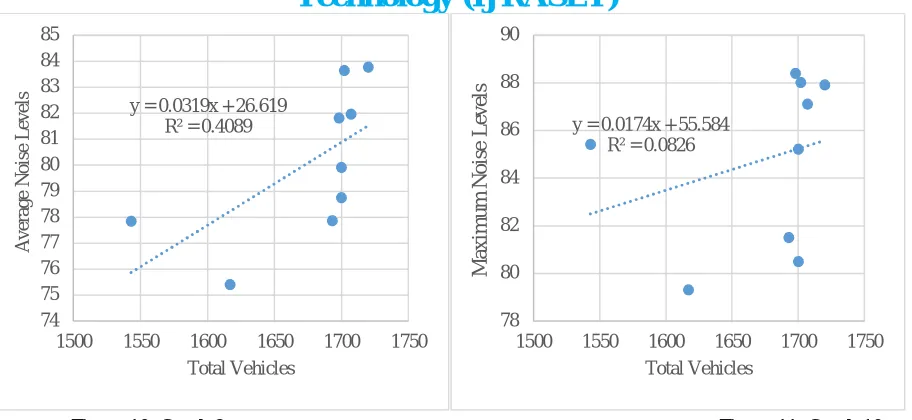
Figure 10: Graph 9 Figure 11: Graph 10
Table 6: Data of Site 3 (Flow of Traffic: Downstream on Una-Veraval Road)
Time Total Vehicles
Average Noise Levels Maximum Noise Levels 06:00 Am To 08:00 Am 1635 75.95 80.4 08:00 Am To 10:00 Am 1647 79.0875 82.1 10:00 Am To 12:00 Pm 1694 80.425 86.9 12:00 Pm To 02:00 Pm 1682 82.225 87.7 02:00 Pm To 04:00 Pm 1654 78.825 81.1 04:00 Pm To 06:00 Pm 1711 82.65 87.2 06:00 Pm To 08:00 Pm 1655 80.45 86.1 08:00 Pm To 10:00 Pm 1586 78.175 82.6 10:00 Pm To 12:00 Am 1499 76.8125 80.4
y = 0.0319x + 26.619 R² = 0.4089
74 75 76 77 78 79 80 81 82 83 84 85
1500 1550 1600 1650 1700 1750
A v er ag e N o is e L ev el s Total Vehicles
y = 0.0174x + 55.584 R² = 0.0826
78 80 82 84 86 88 90
1500 1550 1600 1650 1700 1750
M a xi m um N o is e L ev el s Total Vehicles
y = 0.026x + 36.742 R² = 0.5416
75 76 77 78 79 80 81 82 83
1450 1500 1550 1600 1650 1700 1750
A v er ag e N o is e L ev el s Total Vehicles
y = 0.0339x + 28.256 R² = 0.496
78 79 80 81 82 83 84 85 86 87 88 89
1400 1500 1600 1700 1800
[image:7.612.75.533.310.699.2]The correlation of the total number of vehicles and the noise levels at different sites is shown in the table below. The correlation values are above 0.5 which shows a healthy relation between both the parameters [10]. It simply states that as the number of vehicles increases, the noise levels also increases
Table 7: Correlation of Total Number of Vehicles with Average and Maximum Noise Levels
Sites/Traffic Flow
Correlation Between :-
Total Vehicles And Average Noise Levels
Total Vehicles And Maximum Noise Levels
1 (Upstream) 0.847910447 0.838660582 1 (Downstream) 0.427577895 0.125974516 2 (Upstream) 0.943787386 0.791658498 2 (Downstream) 0.799549997 0.576540191 3 (Upstream) 0.639483803 0.287371217 3 (Downstream) 0.735928415 0.704293031
V. CONCLUSION
The Noise levels in Una Town Exceeds the limits given by the Indian standard for ambient noise levels which is listed below. Table 8: Permissible Limits of Noise Levels Given By Indian Standards
Sr. No Area Category Limit in dB
Day Time Night Time
1 Industrial 75 70
2 Commercial 65 55
3 Residential 55 45
4 Silence area 50 40
Road traffic noise has been recorded as a nuisance to residents and pedestrians near the major highways. The road traffic noise measured is at a level of health concern particularly to those who are working or dwelling near the periphery of NH 8 E. the ill effects of noise pollution invites the deadly psychological as well as physical disorders in a human body.
Based on the results of this study the following conclusion can be drawn:
A. There is a high correlation between traffic volume and noise level as per the statistical modeling of the noise data in the range of threshold of pain to very loud noise.
B. The major noise source in the study area is traffic vehicles contributing in the range of 85 to 89 dB(A) and is very frequent and disturbing. All the values exceed outdoor noise limit by the World Health Organization (WHO, 2000).
C. Long-term exposure toward noise levels more than 70 dB(A) can cause trouble, hypertension, high stress levels, hearing loss, sleep disturbances, and other harmful effects to the people living around the highway
VI. RECOMMENDATIONS
A. The accompanying proposals could fill in as noise decrease measures for the review zone given that no current crucial reduction measures are set up.
B. Driving sense culture should be there among drivers.
C. Highway Code Implementation, for example, marking of highways such as speed limits, directions, keep clear, no u-turn, and so on and arrangement of caution or risk signs could incredibly diminish the activity noise level
E. Noise Pollution Policy should be executed and legitimate authorization measures are in this manner basic to create sufficient noise control arrangements.
F. Education: - In order to accelerate the awareness on traffic noise pollution on this road and any other roads, it is recommended that a public awareness on the effect of traffic noise should be created through the media such as television, radio, and symposia.
REFERENCES
[1] Araghi M, Yaghobi MM,”The study of noise pollution caused by Birjand Airport on the surrouindings residents”. Indian Journal of Science and technology, vol
8, issue 11, 2015.
[2] Banerjee D.”Research on road traffic noise and human health in India: review of literature” from 1991 to current. Noise Health, pp 113-118, 2012.
[3] C. R. Patil, J.P Modak, P. Vaishali Choudhari and D.S Dhote,”Subjective Analysis of Road Traffic Noise Annoyance Around Major Arterials in Intermediate
City” European Journal of Applied Sciences 3 {2}, pp 58-61, 2011 ISSN 2079-2077, IDOSI Publication, 2011.
[4] Chanaud R. .”Noise ordinaces, tools for enactment modification and enforcement of a community noise ordinanc.” 2014
[5] Davor Suskovic,” Noise Induced Hearing Loss.” 5th Congress of Alps.” Adria Acoustics Association, pp 12-14, septmember 2012
[6] Djamel Quis,”Annoyance Caused by Exposure to Road Traffic Noise. An updatev.” Noise & Health pp 69-79, 2002.
[7] Demain Halperin, “Environmental Noise And Sleep Disturbance: A Threat To Health?”, pp 209-212, December 2014.
[8] Garg N. Sharma, O and Maji S.” Noise Impact Assesment of Mass Rapid Transit System In Delhi City.” Indian J. Pure Appl. Phys pp 257*262,2011.
[9] Garg N. Vishesh and Maji S. “Fuzzy Topsis Approach in the Selection of Optimal Noise
[10] Garg N. “Investigation of Modelling transportation Noise and Passive Noise Control Measures for its Abatment.” Ph D dissertation, Delhi Technological
University,2016.
[11] Garg N. Sharma O. Moharian V. and Maji S. “Passive Noise Control Measures For Traffic Noise Abatment In Delhi.” India J. Sci, Ind. Res, pp 226-234,2012
[12] Garreth Prendergast, Hannath Guest.”Effect Of Noise Exposure On Young Adults With Normal Audiogram 1: Electrophysiology.” Hearing Research. Pp 1-14,
2016
[13] Goswami S. S. Nayak, A. Pradhan amd S.K Dey,”an study of traffic noise of two campuses of university.” Balasore, India J. Environ. BioL32. Pp 105-109,
2011
[14] Jamir, L. Nongkymuh and Gupta, S. K. “Community Noise Pollution In Urban India: Need For Public Health Action.” Indian J. Community Mod. Pp
8-12,2014.
[15] Karami K. Cheraghi M, “Traffic Noise As A Serious Effect On Class Teachers In Farrozabad City.” Iran Journal Of Islamic World Academy Of Science. Pp
39-42, 2012
[16] K. S Jadaan,. Msallam, D A. Abu-Shanab. “The Impact Of The Road Traffic Noise On Hospital Workers.” January 2016
[17] Mr. Ranjit Singh, ”Legal Controll Of Noise Pollution in India: A Critical Evaluation.” International Journal of Research in Humanities and Social Studies
Volume 3, Issue 4, pp 34-45 ISSN 2394-6288 & ISSN 2394-6296, April 2016.
[18] Mandal P. K and Bandyopadhyay, “A Case Study From West Bengal, India. Management of noise levels during festival time in Kolkata and Howrah Municipal
Corporation areas from 2002 to 2011. Envi. Qual Manage., pg 13-32. 2014.
[19] Martin, M.A. Tarrero, M.A. Gonzalez, “Exposure-Effect Relationship between Road Traffic Noise Annoyance And Nois Cost Valluations In Valladoid.”
Spain. Appl. Acoust, pg 945-958, 2006.
[20] Prashant Bhavel, Khalid Sayed “Noise Pollution in Sensitive Zone And Its Effect” A Review International Advance Research Journal In Science, Engineering