5
VIII
August 2017
923
©IJRASET (UGC Approved Journal): All Rights are ReservedHybrid Algorithm Analysis for Brain Tumor
Detection using Segmentation Technique with
Efficient Intensity Adjustment in MRI Images
Priya1, Beant Kaur 2
1,2Department of Electronics and Communication Engineering, Punjabi University, Patiala, Punjab, India, 147001
Abstract: The proposed paper presents a Hybrid algorithm for MRI Images which has been developed along with the image segmentation, edge detection techniques and intensity enhancement to detect Brain Tumor Efficiently. The developed Technique using K-means clustering algorithm is integrated with the Fuzzy C-means (KIFCM) and Edge Detection for abnormal MRI images is a novel image segmentation approach to overcome the limitations and to make it more beneficial. The performance of proposed Technique has been analyzed in terms of Tumor Area, White pixels, Black pixels, Tumor detected area, Accuracy value, Processing time, Precision value, and Recall value. The accuracy was evaluated by the ground truth of each processed image. The experimental results clarify the effectiveness of proposed approach to deal with a higher number of segmentation problems via improving the segmentation quality and accuracy in minimal execution time. The Experiment Proposed on Dataset of images giving 100% Accuracy. The proposed technique is quite sensitive towards the detection, specification and highlighting the detected Tumor Area. The work was implemented using MATLAB R2015a (8.5.0.197613)-64Bit.
Keywords: Medical Image Segmentation, K-means clustering, Fuzzy C-means, Level Set, Edge Detection, Intensity Adjustment, Brain Tumor, MRI Images
I. INTRODUCTION
[image:2.612.224.404.488.714.2]The brain is a very complex structure of body and it is tightly bounded within the skull because of this it is more difficult to diagnose its diseases. The abnormal growth in brain cells creates a cluster known as brain tumor which is a very complicated to diagnose. There are two general classifications of tumors; benign tumor or malignant tumor. In the case of a benign tumor, the tumorous mass lacks the ability to attack adjacent healthy cells which means that it is unable to metastasize therefore it is termed as non-cancerous. [2] A tumor is a name for a neoplasm or a solid lesion formed by an abnormal growth of cells (termed neoplastic) which looks like a swelling. The tumor is not synonymous with cancer.
924
©IJRASET (UGC Approved Journal): All Rights are ReservedII. MAGNETIC RESONANCE IMAGING (MRI)
Magnetic Resonance Imaging (MRI) scan or Computed Tomography (CT) scan are the techniques used to scan the anatomy of the brain. The MRI scan does not use any radiation and is more comfortable than CT scan for diagnosis thus it does not affect the human body. MRI is based on the Magnetic Field and Radio Waves. [1]
Fig. 2 Image of Magnetic Resonance Imaging (MRI) scan [23]
III.IMAGE SEGMENTATION
Image segmentation is the process of partitioning a digital image into multiple regions. The goal of segmentation is to change the representation of an image. It is more meaningful and easier to analyze and used in order to locate objects and boundaries in images. The result of image segmentation occurs as a set of regions that collectively covers the entire image. [1]
Input (MRI) Output (Label Field)
Fig. 3 Image Segmentation Process
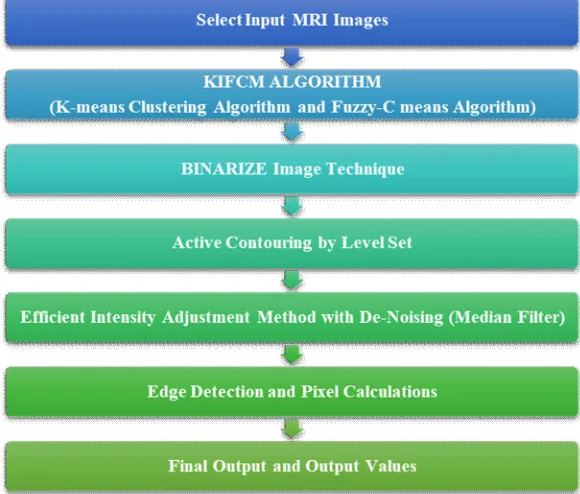
IV.PROPOSED MEDICAL IMAGE SEGMENTATION SYSTEM
925
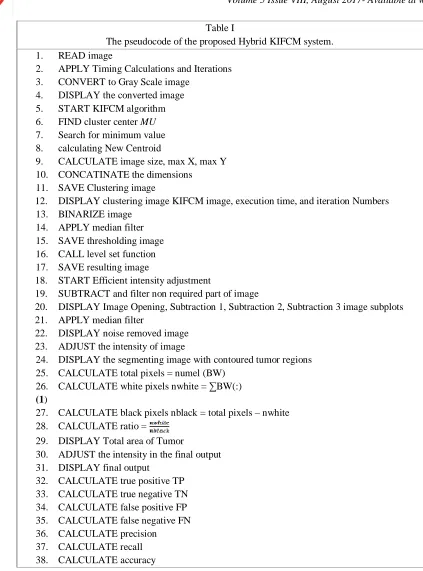
©IJRASET (UGC Approved Journal): All Rights are ReservedTable I
The pseudocode of the proposed Hybrid KIFCM system.
1. READ image
2. APPLY Timing Calculations and Iterations
3. CONVERT to Gray Scale image
4. DISPLAY the converted image
5. START KIFCM algorithm
6. FIND cluster center MU
7. Search for minimum value
8. calculating New Centroid
9. CALCULATE image size, max X, max Y
10. CONCATINATE the dimensions
11. SAVE Clustering image
12. DISPLAY clustering image KIFCM image, execution time, and iteration Numbers
13. BINARIZE image
14. APPLY median filter
15. SAVE thresholding image
16. CALL level set function
17. SAVE resulting image
18. START Efficient intensity adjustment
19. SUBTRACT and filter non required part of image
20. DISPLAY Image Opening, Subtraction 1, Subtraction 2, Subtraction 3 image subplots
21. APPLY median filter
22. DISPLAY noise removed image
23. ADJUST the intensity of image
24. DISPLAY the segmenting image with contoured tumor regions
25. CALCULATE total pixels = numel (BW)
26. CALCULATE white pixels nwhite = ∑BW(:) (1)
27. CALCULATE black pixels nblack = total pixels – nwhite
28. CALCULATE ratio =
29. DISPLAY Total area of Tumor
30. ADJUST the intensity in the final output
31. DISPLAY final output
32. CALCULATE true positive TP
33. CALCULATE true negative TN
34. CALCULATE false positive FP
35. CALCULATE false negative FN
36. CALCULATE precision
37. CALCULATE recall
38. CALCULATE accuracy
A. Pre-Processing Stage
926
©IJRASET (UGC Approved Journal): All Rights are ReservedFig. 4 Image before Pre-Processing
1) Initial Values: In this step, the initial values for the computation of Maximum number of Iterations is defined along with Iteration Number, the elapsed time during the initial process of proposed approach is given to the algorithm such that the total elapsed time from start to the end of processing will be calculated.
[image:5.612.247.364.297.423.2]2) Image Conversion: Pre-processing step translate the image, completes filtering of noise, sharpening the edges, RGB to gray conversion, Reshaping and other parameters in the image. It enhances the quality of the images and make the segmentation and feature extraction phase more reliable.
Fig. 5 Image after Pre-Processing
[image:5.612.160.450.453.700.2]927
©IJRASET (UGC Approved Journal): All Rights are ReservedB. Clustering Stage
The images are fed to KIFCM technique by setting cluster numbers k, max iterations, and termination parameter after Pre-Processing. The pseudo-code of the proposed KIFCM is listed in Table 1. The cluster centers are calculated by:
MU (2)
Where MU is the initial means that can be calculated due to k (number of clusters). m is defined as:
(3)
1) Assign each point to the nearest cluster center based on a minimum distance by checking the distance between the point and the cluster centers then re-compute the new cluster centers.
2) It is repeated until some convergence criterion is obtained.
3) Also, there are some points scattered and distant from any cluster center.
4) The resulted new cluster centers, the clustered points, and the scattered points can be entered in the same time to the looping step that calculates the new distances and clustering the points due to membership value.
5) The membership and means values are then updated by determining the condition of closing.
[image:6.612.252.360.596.698.2]The initial centers of the clusters were not randomly chosen which saves time and effort, thus looping step takes less number of iterations than the random selection. Although, the points were re-clustered due to its membership. There is no huge change done by the re-clustering process therefore there is no inference between points in their clusters [15]. The output of the technique is the clustering image, execution time, and iteration numbers that are recorded to compare with other clustering methods. In this stage, we make a hybrid clustering method based on hard and soft clustering. The hard clustering technique put each point to belong to only nearest cluster. Whereas, the soft clustering technique gives every point a degree of membership, rather than belonging wholly to just one cluster.
Fig. 7 Image after KIFCM Process
C. Extraction and Contouring Stage
In this phase, we used two segmentation methods: thresholding and active contour level set methods:
1) Thresholding Segmentation: Thresholding or image binarization is intensity-based segmentation and is used to extract the object from the background. The segmented image obtained by thresholding is of smaller storage space, fast processing speed, and ease of manipulation, compared with gray level image which generally contains a large number of gray levels (maximum 256 levels). The result output is the segmenting image with dark background and lighting tumor area.
928
©IJRASET (UGC Approved Journal): All Rights are Reserved2) De-Noising by Median Filter: Since, the brain images are more sensitive than other medical images; they should be of minimum noise and maximum quality. It may reach due to the thermal effect. The main purpose of this paper is to detect and segment the tumor cells, but for the complete stage it needs the process of noise removal.
MRI images are usually corrupted by disturbances like Gaussian and Poisson noise. The vast majority of the de-noising algorithms assume additive white Gaussian noise. There are some algorithms that designed for Gaussian noise elimination, like edge preserving bilateral filter, total variation, and non-local means. In this paper, median filter is used which works by moving pixel by pixel through the image, replacing each value with the median value of neighboring pixels. The median is calculated by first sorting all the pixel values from the window (pattern of neighbors) into numerical order, and then replacing the pixel being considered with the middle (median) pixel value. Image processing researchers commonly assert that median filtering is better than linear filtering for removing noise in the presence of edges [14]. The output of this sub-step in preprocessing is the free noising MRI image.
Fig. 9 Image after De-Noising by Median Filter
3) Active Contour by Level Set: Active contours have been used for image segmentation and boundary tracking. The basic idea is to start with initial boundary shapes represented in a form of closed curves, i.e. contours, and iteratively modify them by applying shrink/expansion operations according to the constraints. The used active contour method shows robust segmentation capabilities in medical images where traditional segmentation methods show poor performance [11]. An advantage of the active contours as an image segmentation method is that they partition an image into sub-regions with continuous boundaries. While the edge detectors based on the threshold or local filtering, it often results in discontinuous boundaries. The use of level set theory has provided more flexibility and convenience in the implementation of active contours. Depending on the implementation scheme, active contours can use various properties used for other segmentation methods such as edges, statistics, and texture [13].
a) The clustering image is entered to the binarization process using inverse thresholding method with iteration number equals 3. b) The noise of the image is removed by using the median filter that eliminates the small regions that are far away from the tumor
cluster.
c) We can consider this step as a post processing step in our system. Of course, these two steps can be converted to one step if the classical FCM is used which user can enter the cluster to be a threshold or appeared only in image. In our proposed technique, we get rid of user interaction that may be true or false. After that, the thresholding image with the lighting tumor cluster is fed to the level set.
d) Level set contours the tumor area of the thresholding image on the original image.
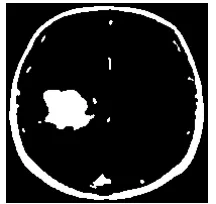
[image:7.612.231.381.589.719.2]e) The output of this step is the thresholding image and original free noising image with contouring tumor area. f) The tumor area can be calculated by computing the white pixels of total pixels of the image.
929
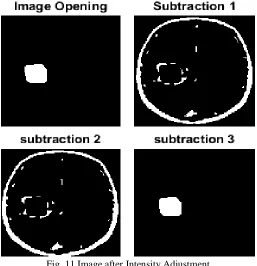
©IJRASET (UGC Approved Journal): All Rights are Reserved [image:8.612.178.435.133.399.2]4) Intensity Adjustment: The Novel Intensity Adjustment Approach has been introduced with Image segmentation. Intensity adjustment is an image enhancement technique that maps intensity values of an image to a new range. This technique modifies the Low contrast of an image to high contrast value along with removing and subtracting the image portion which is not required. It increases the processing speed and the results are more refined by adjusting the contrast of the experimented image.
Fig. 11 Image after Intensity Adjustment
V. EXPERIMENTAL RESULTS
A. Data Sets
In order to check the performance of our image segmentation approach, we used the available MRI data sets. The suggested algorithm was successfully run on fifteen MRI images publicly available Brain Tumor Segmentation (BRATS) challenge dataset. The data set consists of multi-contrast MRI scans (both low-grade and high-grade)
B. Results and Discussion
In this section, we show the results of our proposed image segmentation technique that obtained using real MRI brain images from different data sets. This work was implemented using MATLAB R2015a (8.5.0.197613)-64Bit. We run our experiments on a core i3/1.8 GHZ computer with 4 GB RAM and intel HD Graphics 4000 VGA card. After that, the images are smoothed by median filter. Then, they are clustered by the proposed KIFCM technique and segmented by using thresholding and contouring the tumor region by level set.
[image:8.612.199.416.568.714.2]930
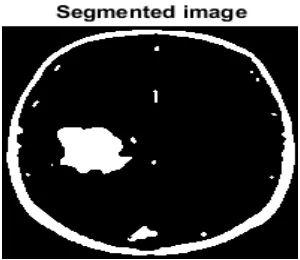
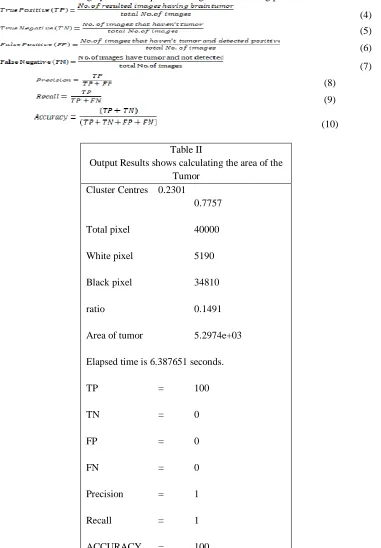
©IJRASET (UGC Approved Journal): All Rights are ReservedC. The final Output Shows Calculating the Area of the Tumor.
The result is apparent for the user to discover the tumor with his eyes before doing thresholding and level set stages. For the proposed algorithm in some images, we found that the KIFCM method is more accurate. Comparing with the previous research in the same field, we can say that their iteration number is 8 and elapsed time is 12 seconds but in our hybrid method technique iteration number is 7 and elapsed time is 6.38 seconds.
The comparison was done and tested using hybrid technique according to the following performance measures:
(4)
(5)
(6)
(7)
(8)
(9)
[image:9.612.120.501.154.702.2](10)
Table II
Output Results shows calculating the area of the Tumor
Cluster Centres 0.2301
0.7757
Total pixel 40000
White pixel 5190
Black pixel 34810
ratio 0.1491
Area of tumor 5.2974e+03
Elapsed time is 6.387651 seconds.
TP = 100
TN = 0
FP = 0
FN = 0
Precision = 1
Recall = 1
931
©IJRASET (UGC Approved Journal): All Rights are ReservedVI.CONCLUSION
Image segmentation plays a significant role in medical image. In the field of medical diagnosis, an extensive diversity of imaging techniques is available presently, such as CT and MRI. MRI is the most effective image model used for diagnostic image examination for brain tumor. The MRI scan is more comfortable than CT scan for diagnosis. On the other hand, K-mean algorithm can detect a brain tumor faster than Fuzzy C-means, but Fuzzy C-means can predict tumor cells accurately. Therefore, we have used K-means clustering technique integrated with Fuzzy C-means algorithm and along with the efficient intensity adjustment method to detect brain tumor accurately and more precisely in minimal execution time. Our framework consists of four stages: pre-processing, clustering (integration of Kmeans and Fuzzy C-means), extraction and contouring (thresholding and level set), and validation stages. We are getting the improved results as compared to the previous work in the same field [1]. We have done this hybrid method work for 7 Iterations, and some images from the dataset are showing results even for the 4th or 5th Iteration number. From the experimental results, we proved the effectiveness of our approach in brain tumor segmentation by comparing it with previous work. Our proposed system determines the initial cluster k value to minimize the execution time. The performance of the proposed technique, its minimization time strategy, and its quality has been demonstrated in several experiments. An intensity adjustment process has been provided for more challenging and refined results of the segmentation techniques to the MRI brain tumor segmentation.
VII.FUTURE SCOPE
The proposed method gives more accurate result. In future the 3D evaluation of the brain tumor detection using 3D slicer of brain using 3D slicers with MATLAB can be developed. The work can be extended by using network training for auto analyzing and determining the affected area by saving using fuzzy logics. Also we can use more advance processors to enhance the processing speed.
REFERENCES
[1] E. Abdel-Maksoud, Mohammed Elmogy, Rashid Al-Awadi, “Brain tumor segmentation based on a hybrid clustering technique”, ELSEVIER, Egyptian Informatics Journal (2015) 16, 71–81
[2] L. Farhi, Adeel Yusuf, Rana Hammad Raza, “Adaptive stochastic segmentation via energy-convergence for brain tumor in MR images”, ELSEVIER, J. Visual Communication and Image Representation, doi: http://dx.doi.org/10.1016/j.jvcir. 2017.04.013, 2017
[3] N. Gupta, Pritee Khanna, Pushpraj Bhatele, “Identification of Gliomas from Brain MRI through Adaptive Segmentation and Run Length of Centralized Patterns”, [CDATA [Journal of Computational Science]] (2017), http://dx.doi.org/10.1016/j.jocs.2017.02.009
[4] S. Abbasi and Farshad Tajeripour, “Detection of Brain Tumor in 3D MRI Images using Local Binary Patterns and Histogram Orientation Gradient”, Neurocomputing, http://dx.doi.org/10.1016/j.neucom.2016.09.051, 2016
[5] A. Aprovitola, Luigi Gallo “Knee bone segmentation from MRI: A classification and literature review”, ELSEVIER, Biocybernetics and Biomedical Engineering (2016) BBE-115; No. of Pages 13
[6] I. Mehmood, N. Ejaz, M. Sajjad, S. Wook Baik, “Prioritization of brain MRI volumes using medical image perception model and tumor region segmentation”, ELSEVIER, Computers in Biology and Medicine 43 (2013) 1471–1483, 2013
[7] U. Bagci, J. K. Udupa, N. Mendhiratta, B. Foster, Z. Xu, J. Yao, X. Chen, D. J. Mollura, “Joint segmentation of anatomical and functional images: Applications in quantification of lesions from PET, PET-CT, MRI-PET, and MRI-PET-CT images”, ELSEVIER, Medical Image Analysis 17 (2013) 929–945 [8] A. Ella Hassanien, H. M. Moftah, A. Taher Azar, M. Shoman, “MRI breast cancer diagnosis hybrid approach using adaptive ant-basedsegmentation and
multilayer perceptron neural networks classifier”, ELSEVIER, Applied Soft Computing 14 (2014) 62–71.
[9] S. Yousefi, R. Azmi, M. Zahedi, “Brain tissue segmentation in MR images based on a hybrid of MRF and social algorithms”, ELSEVIER, Medical Image Analysis 16 (2012) 840–848
[10] Y. Zhang, Z. Dong, L. Wu, S. Wang, “A hybrid method for MRI brain image classification”, ELSEVIER, Expert Systems with Applications 38 (2011) 10049– 10053
[11] Li-H. Juang, Ming-Ni Wu, “MRI brain lesion image detection based on color-converted K-means clustering segmentation” ELSEVIER, Measurement 43 (2010) 941–949
[12] M. A. Balafar, A. R. Ramli, M. I. Saripan, S. Mashohor, “Review of brain MRI image segmentation methods” Springer, Artif Intell Rev (2010) 33:261–274, DOI 10.1007/s10462-010-9155-0
[13] H. Khotanlou, O. Colliot, J. Atif, Isabelle Bloch, “3D brain tumor segmentation in MRI using fuzzy classification, symmetry analysis and spatially constrained deformable models” ELSEVIER, Fuzzy SetsandSystems160(2009)1457–1473
[14] Kai Xie, Jie Yang, Z.G. Zhang, Y.M. Zhu, “Semi-automated brain tumor and edema segmentation using MRI”, ELSEVIER, European Journal of Radiology 56 (2005) 12–19
[15] H. Tanga, E.X. Wu, Q.Y. Ma, D. Gallagher, G.M. Perera, T. Zhuang, “MRI brain image segmentation by multi-resolution edge detection and region selection” ELSEVIER, Computerized Medical Imaging and Graphics 24 (2000) 349–357
932
©IJRASET (UGC Approved Journal): All Rights are Reserved[17] Sandra González-Villàa,⁎, Sergi Valverdea, Mariano Cabezasa, Deborah Paretob, Joan C. Vilanovac, Lluís Ramió-Torrentàd, Àlex Rovirab, Arnau Olivera, Xavier Lladóa, “Evaluating the effect of multiple sclerosis lesions on automatic brain structure segmentation” ELSEVIER, Neuro Image: Clinical 15 (2017) 228–238 http://dx.doi.org/10.1016/j.nicl.2017.05.003
[18] Mohammad Havaeia,1, Axel Davyb, David Warde-Farleyc, Antoine Biardc,d, Aaron Courvillec, Yoshua Bengioc, Chris Palc,e, Pierre-Marc Jodoina, Hugo Larochelle, “Brain Tumor Segmentation with Deep Neural Networks” ELSEVIER, Medical Image Analysis, May 23, 2016
[19] Ankita Kapil, Shailja Shukla, “Brain Tumour Extration from MR Images Using Segmentation Techniques: A Review”, GRD Journals- Global Research and Development Journal for Engineering | Volume 2 | Issue 4 | March 2017, ISSN: 2455-5703
[20] Jayali Vilas Bhagat1, N.B. Dhaigude, “A Survey on Brain Tumor Detection Techniques”, International Research Journal of Engineering and Technology (IRJET), Volume: 04 Issue: 03 | Mar -2017, e-ISSN: 2395 -0056 p-ISSN: 2395-0072
[21] Kdnuggets.http://www.kdnuggets.com/faq/precision-recall.html
![Fig. 1 Image of Brain Tumor [22]](https://thumb-us.123doks.com/thumbv2/123dok_us/8307236.856608/2.612.224.404.488.714/fig-image-of-brain-tumor.webp)