5
IX
September 2017
Optimisation of EDM Parameter of Titanium Alloy
(Ti-6Al-4V) using Taguchi Methodology
Anubhav Gupta1, M.A. Akhtar2
1
M.Tech Student, 2Associate Professor, Department of Mechanical Engineering, SLIET, Longowal, Punjab, India
Abstract: The objective of this research study is to investigate the optimal process parameter of EDM on titanium alloy (Ti-6Al-4V) material with copper as a tool electrode. The input parameters considered as voltage, current, pulse-on-time and pulse-off-time are used for experimental work and their effect on surface roughness. The Taguchi method is used to formulate the experimental layout, ANOVA method is used to analysis the effect of input process parameter on machining characteristics and find the optimal process parameter of EDM. The result of the present work reveals that proper selection of input parameters will play a significant role in EDM. A result of ANOVA shows that current and pulse-on-time have major contribution on Surface roughness. P-Value shows that with 95% confidence level, current and pulse-on-time is significant parameters.
Keywords: Electrical Discharge Machining, Titanium alloy, Optimization, Taguchi Method, ANOVA, Surface Roughness.
I. INTRODUCTION
Electrical discharge machine (EDM) is a modern machine with that purpose of can drilling milling, grinding as well as other traditional machining operation. EDM now become the most important traditional technologies in manufacturing industries since many complicated 3D shapes can be machined using a simple shaped tool electrode. In manufacturing industry, Electrical Discharge Machining (EDM) is usually used for producing mould and die component. This machine is use as the ability of machining process that is very exact in creating complex or simple shape within parts and assemblies. In EDM, a possible difference is applied between the tool and work piece. Together the tool and the work material are to be conductors of electricity. The tool and the work material are immersed in a dielectric medium. Generally kerosene or deionised water is used as the dielectric medium. A gap is maintained between the tool and work piece. Depending upon the applied possible difference and the gap between the tool and work piece, an electric field would be established. Generally the tool is connected to the negative terminal of the generator and the work piece is connected to positive terminal. The work material chosen for the present work is Titanium alloy (Ti-6Al-4V). Titanium alloy (Ti-6Al-4V) featuring high strength, low weight ratio and excellent corrosion resistance. The tool material chosen for present work is copper. Copper is a chemical element with symbol Cu and atomic number 29. It is a soft, malleable and ductile metal with very high thermal and electrical conductivity. The Taguchi method solves this problem by a special design of orthogonal arrays. The entire process parameter can be studied by a minimum number of experiments. The Analysis of Variance (ANOVA) consists of simultaneous hypothesis tests to determine whether any of the effect is significant or not.
II. EXPERIMENTAL PROCEDURE
A. Work Material and Electrode material
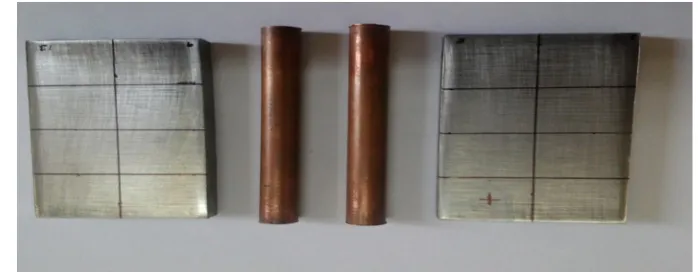
The work includes the Electrical Discharge Machining of Titanium alloy using Taguchi methodology. In this paper Titanium alloy (Ti-6Al-4V) will be used as a work material and Copper will be used as an electrode material.
[image:2.612.137.486.584.720.2]Composition of Titanium alloy (Ti-6Al-4V) is shown in table I. Titanium alloy is alloyed with aluminium (6.07%) for increase the conductivity of work material.
Table I: Chemical composition of Titanium alloy (Ti-6Al-4V)
Ti% Al% V% O% Fe% H% N% C%
Balance 6.07 4.02 0.1497 0.03 0.0115 0.0036 Max. 0.014
B. Taguchi´s orthogonal array
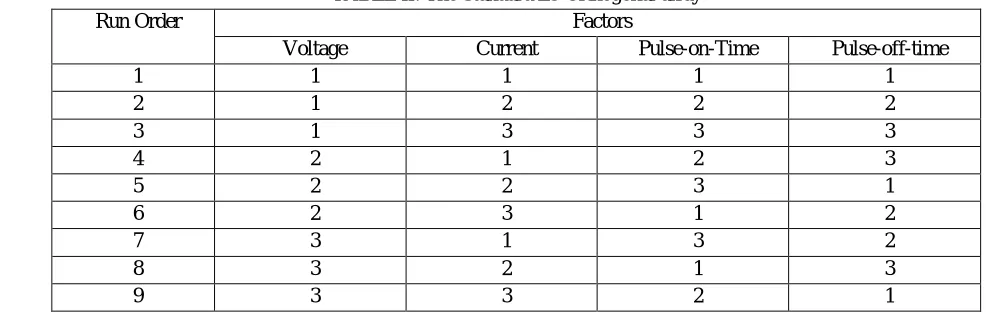
Orthogonal array are highly utilized in engineering analysis. While there are many standard orthogonal arrays available, each of the arrays is meant for a specific number of independent design variables and levels. For example, if one wants to conduct an experiment to understand the influence of 4 different independent variables with each variable having 3 set values (level values), then an L9 orthogonal array might be the right choice. The L9 orthogonal array is meant for understanding the effect of 4 independent factors each having 3 factor level values.
TABLE II: The Standard L9 Orthogonal array
Run Order Factors
Voltage Current Pulse-on-Time Pulse-off-time
1 1 1 1 1
2 1 2 2 2
3 1 3 3 3
4 2 1 2 3
5 2 2 3 1
6 2 3 1 2
7 3 1 3 2
8 3 2 1 3
9 3 3 2 1
Where 1- Low level: 2- Medium level: 3-High level:
[image:3.612.48.541.245.411.2]C. Selection of process parameters and levels
Table III: Process Parameters and Levels
S. No. Factors (units) Parameter designation Level 1 Level 2 Level 3
1 Voltage (V) A 45 60 70
2 Current (A) B 9 12 15
3 TON(µs) C 120 150 210
4 TOFF(µs) D 4 5 6
D. Constant Parameters
The various parameters which are not changed during the machining are: Work-piece material = Titanium alloy (Ti-6Al-4V) Tool material = copper
Depth of cut = 0.7 mm
E. Surface Roughness Measurement
There are various methods available for measuring the surface roughness of the work piece. Surface roughness is measured in Ra (arithmetic mean surface roughness) is calculated by surf coder available in metallurgy lab at SLIET longowal, Sangrur (Punjab). The unit of Surface Roughness is µm.
III. RESULTS AND DISCUSSION
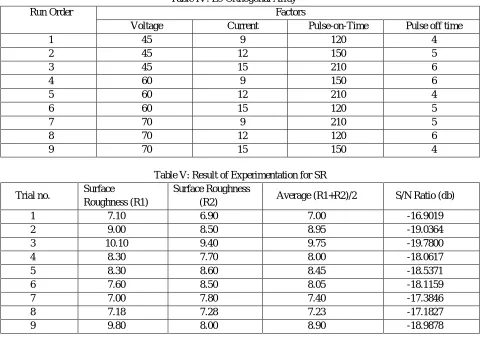
[image:4.612.66.547.177.514.2]After all the experimentations and measurements, it is required to study the effect of different machining parameter of EDM for machining of Titanium alloy. This chapter presents the analysis of experimental results using Taguchi Method, Analysis of Variance (ANOVA) and optimization EDM process for minimum surface roughness (SR). Optimization has been carried out using desirability approach. A total 9 experiments have been performed as per experimental plan. Each experiment will be done for two times. These results are further analyzed by Taguchi method. The ANOVA has been implemented to find out the significant process parameters.
Table IV: L9 Orthogonal Array
Run Order Factors
Voltage Current Pulse-on-Time Pulse off time
1 45 9 120 4
2 45 12 150 5
3 45 15 210 6
4 60 9 150 6
5 60 12 210 4
6 60 15 120 5
7 70 9 210 5
8 70 12 120 6
9 70 15 150 4
Table V: Result of Experimentation for SR
Trial no. Surface Roughness (R1)
Surface Roughness
(R2) Average (R1+R2)/2 S/N Ratio (db)
1 7.10 6.90 7.00 -16.9019
2 9.00 8.50 8.95 -19.0364
3 10.10 9.40 9.75 -19.7800
4 8.30 7.70 8.00 -18.0617
5 8.30 8.60 8.45 -18.5371
6 7.60 8.50 8.05 -18.1159
7 7.00 7.80 7.40 -17.3846
8 7.18 7.28 7.23 -17.1827
9 9.80 8.00 8.90 -18.9878
An Average SR is getting by addition of Surface Roughness 1 and Surface roughness 2 and divides this addition by 2.
[image:4.612.58.461.553.727.2]Average SR =
A. Surface Roughness (SR)
Experiments conducted according to the orthogonal array designed for the investigation i.e. L9. Each trial has been done two times for better result.
B. Analysis of Signal to Noise (S/N) ratio
A high value of S/N ratio implies that the signal is much higher than the random effects or noise factors. Process operation consistent with highest S/N ratio always yields optimum quality with minimum variation. The equation for calculating S/N ratio for lower-is-better is: Lower is better (Surface Roughness)
=−10log(1 y
Yt = value of the characteristics in an observation r = no. of repetition in a trial
C. The Average or Mean S/N Ratio and overall Means
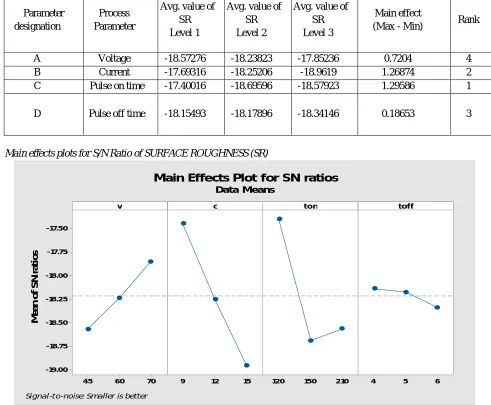
The average value and main effect of S/N ratio for each level of the parameter are summarized and called the average and main effect of S/N data table for surface roughness is listed in table VI.
Table VI: Average values and main effects (S/N data: SR)
Parameter designation
Process Parameter
Avg. value of SR Level 1
Avg. value of SR Level 2
Avg. value of SR Level 3
Main effect
(Max - Min) Rank
A Voltage -18.57276 -18.23823 -17.85236 0.7204 4 B Current -17.69316 -18.25206 -18.9619 1.26874 2 C Pulse on time -17.40016 -18.69596 -18.57923 1.29586 1
D Pulse off time -18.15493 -18.17896 -18.34146 0.18653 3
[image:5.612.54.545.315.720.2]D. Main effects plots for S/N Ratio of SURFACE ROUGHNESS (SR)
Figure 3 Main effects plots for S/N Ratio of Surface Roughness (SR) on Titanium alloy (Ti-6Al-4V)
70 60 45 -17.50 -17.75 -18.00 -18.25 -18.50 -18.75 -19.00 15 12
9 120 150 210 4 5 6
v M e a n o f S N r a ti o s
c ton toff
Main Effects Plot for SN ratios Data Means
From the above figure 3 in subplot 1, it is observed that when the value of voltage increases from 45V to 70V the value of SR decrease. In subplot 2, it is observed that when current increase from 9A to 15A the value of SR also increase. In Subplot 3, shows that TON increase from 120µs to 150µs SR increase but after its SR decrease. In subplot 4, as the TOFF increase from 4µs to 6µs SR also increase.
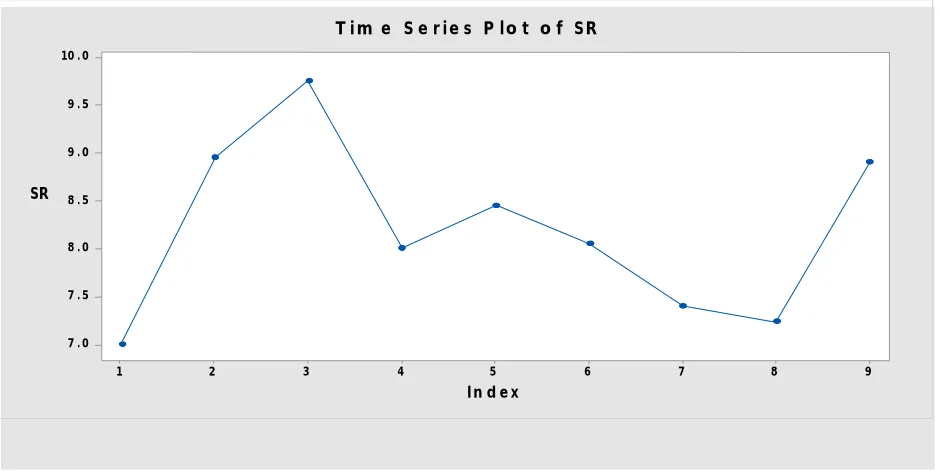
E. Time Series Plot for SR
Time series plot is used to analyze the data which is sequence of measurement and follows non random order. It is based upon the assumption that successive value in the data file represents consecutive measurement taken at equally spaced time interval. The Time series Plot for SR is shown in fig 4. The minimum value of SR is at first run (7µm) and the maximum SR is during third run (9.75µm).
[image:6.612.66.536.207.443.2]
Figure 4 Time series plot of Surface Roughness on Titanium alloy (Ti-6Al-4V)
F. Calculation of Degree of Freedom Dp (Degree Of Freedom) = Number of levels-1 DA (Degree of Freedom for Voltage) = 3-1=2 DB (Degree of Freedom for Current) = 3-1=2 DC (Degree of Freedom for Pulse-on-Time) = 3-1=2 DD (Degree of Freedom for Pulse-off-Time) = 3-1=2 De (Degree of Freedom for Error) = 4.
G. Calculation of Sum of Square
First of all we find out the total sum of square (SST) and after that sum of square due to each process parameter (SSP) and in the last sum of square due to error (SSe).
SST = ∑ ( − )2
Where N is the number of experiments in the orthogonal array and n is the S/N ratio for the experiment and nm is the overall mean S/N ratio.
The sum of square due to each parameter (SSP) calculated as. SSP = ∑ − [∑ ]2
Where t = no. of levels, m = no. of experiments, ni = S/N ratio of each experiment, Sn = S/N ratio at each level And SSe = SST - ∑ P
9 8
7 6
5 4
3 2
1 10 . 0
9 . 5
9 . 0
8 . 5
8 . 0
7 . 5
7 . 0
I nd e x SR
H. Calculation of mean square or variance
The mean square or variance of the parameter is tested by VP= SSP/DP Variance for the parameter voltage (VA) = SSA/DA=0.3906
Variance for the parameter current (VB) = SSB/DB=1.7164 Variance for the parameter pulse on time (Vc) = SSc/Dc=1.5279 Variance for the parameter pulse off time (VD) = SSD/DD=0.0337 Variance for error (Ve) = SSe/De = 0.2122
I. Calculation of F-Ratio
The F-value for each processed is calculated by simply the mean of square deviation to the square error (Fp=Vp/Ve) F-value for the parameter voltage FA = 1.8407
F-value for the parameter current FB = 8.0885 F-value for the parameter Pulse on Time FC = 7.2002 F-value for the parameter pulse off time FD = 0.1588
J. Calculation of P-Value
When we perform a hypothesis test in statics, a P-value helps in determine the significance of result. All hypothesis tests ultimately use a P-Value to weight the strength of the evidence. The P-value is a number between 0 and 1 interpreted in the following ways: A small P- value (typically <0.05) indicates strong evidence against the Null hypothesis, so reject the null hypothesis.
A large P-Value (> 0.05) indicates weak evidence against the Null hypothesis, so fail to reject the null hypothesis.
P-value very close to the cut-off (0.05) are considered to be marginal (could go either way).Always report the P-value and so drawn their own conclusion as follows.
P-value for the parameter voltage PA= 0.3799 P-value for the parameter current PB=0.0393 P-value for the parameter Pulse on Time Pc =0.0472 P-value for the parameter pulse off time PD=0.6512
K. Calculation of percentage contribution
To find out the percentage contribution of each design parameter is carried out by Pp= SSp/SST Percentage contribution of Voltage (PA) = SSA/SST= 10.64%
Percentage contribution of Current (PB) = SSB/SST= 46.78% Percentage contribution of Pulse on time (PC) = SSC/SST= 41.64% Percentage contribution of Pulse off time (PD) = SSD/SST= 0.91%
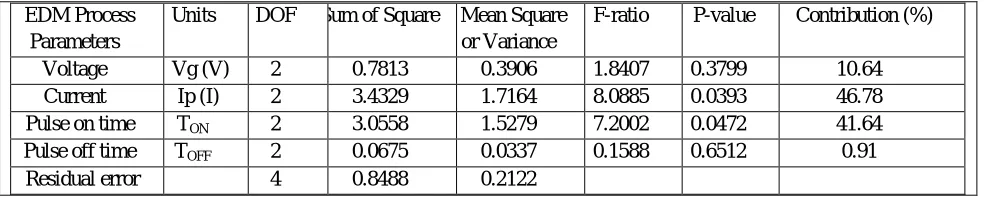
L. ANOVA for Surface Roughness (SR)
[image:7.612.65.557.566.665.2]Result of ANOVA for S/N ratio of surface roughness (SR) is presented in table VII. This gives the average effect of parameters on surface roughness (SR).
Table VII: ANOVA for S/N ratio of SR EDM Process
Parameters
Units DOF Sum of Square Mean Square or Variance
F-ratio P-value Contribution (%)
Voltage Vg (V) 2 0.7813 0.3906 1.8407 0.3799 10.64 Current Ip (I) 2 3.4329 1.7164 8.0885 0.0393 46.78 Pulse on time TON 2 3.0558 1.5279 7.2002 0.0472 41.64 Pulse off time TOFF 2 0.0675 0.0337 0.1588 0.6512 0.91 Residual error 4 0.8488 0.2122
M. Confirmation test
When the optimal level of process parameter selected and in final step predicted and confirmed the improvement of the performance characteristic using the optimal level of process parameter.
The estimated S/N ratio ň using the optimal level of the process parameter calculated as: ň = nm +∑ (ń − m)
Where,
nm = the total mean of S/N ratio
ń = the mean S/N ratio at the optimal level
q = the no. of process parameter that disturb the performance characteristics
The estimated S/N ratio using the optimal machining parameter for surface roughness achieved and the corresponding surface roughness calculated.
ň = nm + (ń1-nm) + (ń2-nm) + (ń3-nm) + (ń4-nm) ň= -19.9079
Put the value of ň in the equation “Smaller the better" gets the value of surface roughness (SR). Corresponding to estimated S/N ratio using the optimal machining parameter;
-19.9079 = -10 log (y2) Y = 9.89
This is predicted value for SR for optimal operation parameter, now take the initial cutting parameters as A2B2C2D2 and the optimal cutting parameter as A3B1C1D1 and then conducted two experiments according to above value of parameters maintained the previous experimental condition same.
Corresponding initial parameters and optimal parameter were taken A2B2C2D2 and A3B1C1D1 and accordingly measured the value of surface roughness (SR) were measured 10.23µm and 9.18µm respectively. The S/N ratio calculated to the corresponding measured surface roughness (SR) value as follows:
For A2B2C2D2
S/N RATIO = -10 log (10.232) = -20.1975 Similarly for A3B1C1D1
S/N ratio = -10log (9.182) = -19.2568
[image:8.612.63.548.526.652.2]Increment of the S/N ratio from the initial cutting parameter: = (-19.2568+20.1935) = 0.9406
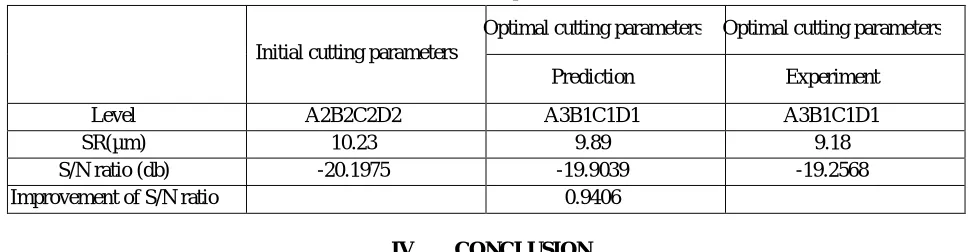
Table VIII displays the results of the confirmation experiment using the optimal machining parameter for surface roughness (SR). Good agreement between the predicted machining performance and actual machining performed is exposed. Based on the confirmation test, the value of SR is reduced by 0.89 times the experimental results confirm the prior parameter design for the optimal machining parameter with the multiple performance characteristics in EDM process.
Table VIII: Confirmation Experiment Result of SR
Initial cutting parameters
Optimal cutting parameters Optimal cutting parameters
Prediction Experiment
Level A2B2C2D2 A3B1C1D1 A3B1C1D1
SR(µm) 10.23 9.89 9.18
S/N ratio (db) -20.1975 -19.9039 -19.2568
Improvement of S/N ratio 0.9406
IV. CONCLUSION
Based on the achieved results following conclusions can be drawn:
A. For surface roughness, "Smaller the better" approach is used as it is desired that SR should be minimum so that better quality of the products is achieved.
C. The result of the ANOVA also reveals that discharge current makes (46.78%) contribution, which is major contribution in overall performance. The contribution percentage for voltage, pulse-on-time and pulse-off-time are lower, at 10.64%, 41.64% and 0.91% respectively.
D. The optimal settings obtained for SR are as follows: (a) Pulse current = 9A, (b) Pulse-on-time 120µs, (c) Pulse-off-time = 4µs and (d) Voltage =70V.
E. It is also seen that Taguchi´s method is the most appropriate method for the electrical discharge machining process of Titanium alloy (Ti-6Al-4V).
REFERENCES
[ 1 ] C.G. Che Heron, B. Md. Deros., A. Ginting, M. Fauziah, Investigation on the influence of machining parameters when machining tool steel using EDM, Journal of Material Processing Technology 116(2001) 84-87.
[ 2 ] Jothimurugan.R, K.S.Amirthagadeswaran and Joel Daniel, Performance of silver coated copper tool with kerosene-servotherm dielectric in EDM of Monel 400, Journal of Applied Sciences 12 (10): 999-1005, 2012.
[ 3 ] Jung. Jong Hyuk, Kwon Won Tae. Optimization of EDM process for multiple performance characteristics using Taguchi method and Grey relational analysis. Journal of Mechanical Science and Technology 24 (5) (2010); 1083-1090.
[ 4 ] Kocher. Gautam, Chopra Karan, Kumar Sandeep, Investigation of Surface integrity of A1S1 D3 tool steel After EDM. International Journal of Engineering Technology and Advanced Engineering (2012); Volume 2 ISSN 2250-2459.
[ 5 ] K. Ponappa., Aravindan S., Rao P. V., Ramkumar J., Gupta M. The effect of process parameters on machining of magnesium nano alumina composites through EDM. Int J Adv Manuf Technol (2010); 46:1035-1042.
[ 6 ] Lin J.L., K.S. Wang, B.H. Yan, Y.S. Tarng, "Optimization of the electrical discharge machining Process based on the Taguchi method with fuzzy logics” Journal of Material Processing Technology, 102 (2000)48-55
[ 7 ] Norlina, Abbas Mohd. The Research Trends in EDM on Ultrasonic Vibration, Dry EDM Machining. Int J Adv Manuf Technol 2007; 42:321-28.
[ 8 ] Patel. K. M., Pandey P. M., Rao P. V. Optimization of process parameters for multi performance characteristics in EDM of Al2 O3 ceramic composite. lnt J Adv
Manuf Technol (2010); 47: 1137-1147.
[ 9 ] Tomadi. S. H., Hassan M. A., Hamedon Z., Daud R., Khalid A. G. Analysis of the Influence of EDM Parameters on Surface Quality, Material Removal Rate and Electrode Wear of Tungsten Carbide. Proceedings of the International Multi-Conference of Engineers and Computer Scientists; (2009); Vol. 11 1MECS 2009, March 18 - 20, 2009, Hong Kong.
[ 1 0 ] Tsai, Lu. Influence of current impulse on machining characteristics in EDM. Journal of Materials Processing Technology (2007); 21: 1617-1621. [ 1 1 ] Yeo. H, A Method for Green Process Planning in Electric Discharge Machining, Int J Adv Manuf Technol (1999) 15:287-29 PP-35
[ 1 2 ] Yusuf. Keskin, Halkacy H.Selcuk., Kizil Mevlut. An experimental study for determination of the effects of machining parameters on surface roughness in electrical discharge machining (EDM). Int J Adv Manuf Teehnol (2006); 28: 1118-1121.