Hadoop.TS: Large-Scale Time-Series Processing
Mirko K ¨ampf
Martin-Luther-Universit ¨at, Institute of Physics 06099 Halle (Saale), Germany
Jan W. Kantelhardt
Martin-Luther-Universit ¨at, Institute of Physics 06099 Halle (Saale), Germany
ABSTRACT
The paper describes a computational framework for time-series analysis. It allows rapid prototyping of new algorithms, since all components are re-usable. Generic data structures repre-sent different types of time series, e. g. event and inter-event time series, and define reliable interfaces to existing big data. Standalone applications, highly scalable MapReduce pro-grams, and User Defined Functions for Hadoop-based anal-ysis frameworks are the major modes of operation. Effi-cient implementations of univariate and bivariate analysis al-gorithms are provided for, e. g., long-term correlation, cross-correlation and event synchronization analysis on large data sets.
General Terms:
Data Analysis Algorithms, Data Mining
Keywords:
Time Series Analysis, Detrended Fluctuation Analysis, Return Interval Statistics, Cross Correlation, Event Synchronization, Hadoop, MapReduce
1. INTRODUCTION
Time series analysis techniques are used in a wide range of appli-cations including complexity science, physics, climate research, (neuro-) physiology, medical diagnostics, economics, and sys-tems operations [1, 2, 3, 4]. As more and more large data sets be-come publicly available [5, 6], time series analysis is also needed in social and communication sciences. A robust set of tools on top of an easy-to-use scalable processing environment can sup-port interdisciplinary research, since it enables the application of advanced statistical methods across disciplines.
1.1 The Hadoop Ecosystem and Hadoop.TS
The emergence of the still growingHadoop[7, 8] ecosystem is motivated by limitations of existing database servers and analysis applications. It is driven by the need for scalable robust solutions for large-scale data analysis.
Large-scale computing, in general, is not new. In grid comput-ing, large computational units process relatively small data sets, which are often stored on separated storage clusters. Opposite to this approach, a Hadoop cluster combines processing resources, distributed storage, and efficient data and workload distribution within one single computer cluster. For time series analysis, such an environment is more efficient than traditional relational databases, although Hadoop is not a database server system. It is a large-scale processing platform, which is optimized for filter and join operations implemented in high level query languages likeHive and Pig[9, 10] on top of the core Hadoop system. TheJava programming language is used to implement multiple
types of scientific applications, e. g. for machine learning, graph analysis or – in the case of Hadoop.TS – forTime Seriesanalysis. One of the important strengths of a Hadoop cluster is its capa-bility of storing large-scale unstructured or semi-structured data sets. A schema or a record structure is introduced during the pro-cessing stage, not while the data are being loaded. Large amounts of data can be collected and processed without the need of defin-ing a certain format in the beginndefin-ing. This implies that there is no guarantee for the accuracy and reliability of data, since data were not checked while they were stored. One has to handle missing data, and the quality of data has to be evaluated as part of the pro-cessing procedures. Beside this, one has to find an appropriate data representation which fits well to certain algorithms. In par-ticular, time series have to be of the same resolution and length for some algorithms like cross-correlation analysis. In this case, missing values can be interpolated or replaced by averages of the whole data row or the whole data set.
The Hadoop.TS framework is a collection of core data types, data type mappers, and connectors to existing storage frame-works. Specifically, Hadoop.TS consists of loosely coupled soft-ware components implemented in Java. The project’s focus is on an easy implementation of time series analysis applications, which process large-scale data sets. The major components can be used within a Hadoop cluster or in standalone applications. With special components calledUser Defined Functions(UDF) Hadoop.TS hooks smoothly into Hive and Pig. This way, the im-plementations of time-series algorithms can be re-used in exist-ing script-based applications. The framework was created and initially used in the complex-systems research project SOCIONI-CAL[11].
In this paper, the core concepts of Hadoop.TS are outlined to illustrate the advantages of the approach. Details about impor-tant related projects are given in Section 2, followed by a de-scription of the data structures for scalable time-series process-ing (Section 3) and data flow and processprocess-ing stages (Section 4). Section 5 describes the data analysis methodology implemented in Hadoop.TS. Then the Hadoop.TS packages (Section 6) and core components (Section 7) are detailed, explaining how they interact with each other and with the environment. Finally, re-sults for surrogate data created by integrated data generators are presented (Section 8), followed by conclusion and outlook (Sec-tion 9).
1.2 Motivation for Scalable Time Series Analysis
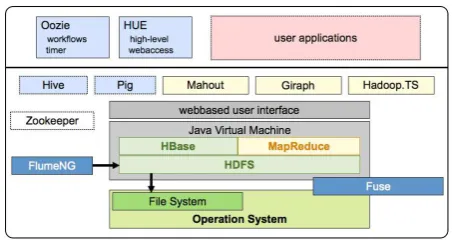
Fig. 1. The Hadoop.TS library extends the Hadoop ecosystem. It can even be used as component for standalone applications which interact with a Hadoop cluster. Data collection is done via Flume and Sqoop, depending on the origin of the data. Sqoop is used for bulk import of time-series data from relational data base servers. On the other hand, FlumeNG provides a reliable data collection and preprocessing framework for collecting sporadic events. More
advanced data preprocessing is done with Hive (HiveQL) and Pig (Pig Latin). Complete applications are created as workflows with multiple stages of MapReduce jobs, which are managed by Oozie. A very easy user interface is available with HUE. All of these software
components are available with an open source license.
more research projects and scientific applications will benefit from a collection of efficient and well tested implementations of established time-series analysis algorithms.
The authors’ previous work onWikipediaaccess-rate and edit-event time series [12] is just one example. Content creation and information retrieval in Wikipedia has been studied to compare the dynamical properties of both processes. In particular, the long-range correlation properties of single time series derived from the log data of each single Wikipedia page have been in-vestigated. The computational procedures forDetrended Fluc-tuation Analysis(DFA) [13, 14, 15, 16],Multifractal Detrended Fluctuation Analysis(MFDFA) [17, 18, 19], andReturn Inter-val Statistics(RIS) [20, 21, 22, 23] (see also [24] for a review paper) were implemented as part of the Hadoop.TS package. Al-gorithms in this group are used for a characterization of single-element properties. The calculated properties of each time series form real world objects.
Another group contains algorithms to calculate correlations be-tween pairs of such elements. For example, in their studies on information spread within social networks, the authors used the Hadoop.TS implementation ofCross-Correlation(CC) [1] and Event Synchronisation(ES) [25] algorithms for pairs of time se-ries to reconstruct correlation-based functional networks among groups of Wikipedia pages [26]. The very recent concept of Time-Delay Stability(TDS) [27] also calculates CC-based prop-erties for pairs of time series in a physiological context. In [28] CC analysis has been applied to classify traffic states based on episodes of time series measured in an traffic control system. In both cases, one takes into account that the interaction of system elements determines the system state, not just the average prop-erties of the elements at a certain time. While RIS, DFA, and MFDFA are applied to individual data rows as parts of a large ensemble, pairs of data rows are processed in the case of CC, TDS, and ES analyses.
These and many other applications in physics, climate research, and medical research have demonstrated that the algorithms al-low new insights and even completely new research approaches based on large data sets, which can now be combined as well. The applications show why time series analysis is an important part of complex systems research. The evolution of a system and emerging phenomena cannot be understood by just looking at single snapshots of independent measurements. There is the need
for a solid framework that allows a rapid development of new time-series analysis algorithms while it offers a tight integration into large-scale processing frameworks. Short iteration cycles are supported by agile development processes and high-level ab-stractions for application developers. Therefore, the Hadoop.TS framework was created, with the goal of providing a set of core components and a set of best practices to support the develop-ment of time-series analysis applications for interdisciplinary re-search.
2. RELATED WORK
Generic use cases for Hadoop include log file analysis or de-normalization of sometimes very large tables stored in relational databases. Such join operations on large data sets lead to even larger portions of data. To work efficiently with these data one needs a scalable platform. Another typical application is the cre-ation of an inverted index which has driven the development of the core Hadoop system during the last decade. It consists of the Hadoop Distributed Filesystem(HDFS) [8] and theMapReduce [7] framework. Special purpose applications, e. g. the implemen-tation of multiple machine learning algorithms likeApache Ma-hout[29] are available as standalone libraries, but they can be used in an Hadoop cluster as well. The purpose ofApache Gi-raph[30] is a different one. Although many graph algorithms can be implemented based on the MapReduce paradigm, in Apache Giraph the MapReduce framework is just used within a bootstrap phase to load a distributed graph representation into the memory of the cluster nodes. Afterwards, theBulk Synchronous Process-ingapproach [31] (comparable to theGoogle Pregelproject [32]) is used for faster and more efficient implementations of, e. g., calculation of page rank, network diameter, or shortest path be-tween nodes in really large networks. In many cases the proper-ties of nodes and edges are measured or collected directly, but for functional networks such information is calculated based on time series. Hadoop.TS provides data for such algorithms and works as an integration layer between multiple existing systems. The following subsections will report details about related projects in the Apache ecosystem and discuss their relations to Hadoop and Hadoop.TS.
2.1 Apache Commons Math
A bunch of mathematical software is collected in theApache Commons Mathpackage [33], but not with the focus on parallel processing. The classAbsractRealMartrix, an implementation of a distributed large matrix and a parallel computation of covari-ance, was developed by Pebayet al.[34] and implemented in the classStorelessCovarianz. Although the focus of the package is not on parallel computing, many very useful components can be applied in Hadoop related software.
2.2 Apache Hadoop
data type implementations. Internally, it re-uses the Hadoop and Java core data types as often as possible with focus on interoper-ability.
2.3 Apache Mahout and Apache Giraph
Some more problem specific data types or data containers are implemented in theApache Mahoutpackages. However, such classes are not intended to be available in all future versions. One has to be careful if data, represented in a binary form based on such types, have to be stored or exported to other systems. The code to read the data should be maintained and published to-gether with the data set. Time series can be implemented based on objects of typeVectororNamedVector, but there is a need to add more meta data to a time series like a time stamp of its first value, a time interval or a distance for equidistant time se-ries or even a complete list of all distances. Apache Mahout as well as Apache Giraph are software components developed for the Hadoop platform. Besides this, some algorithms in Mahout can be used on single computers like desktop PCs or a single servers. In order to reuse existing implementations of several Machine Learning(ML) orGraph Processing(GP) algorithms, Hadoop.TS provides data type converters and procedure connec-tors for both systems.
2.4 OpenTSDB and Apache HBase
Beside the processing framework and some generic libraries, Hadoop.TS is related to the data storage layer as well. Fast ran-dom access to small portions of large data sets is a key issue. While HDFS does not allow random access to a certain record within a file and because data cannot be appended to an HDFS file, time series data are stored inApache HBaseWith this ser-vice one is able to store time series data as a binary encoded data structure or even as a set of single values together with meta data describing previous processing steps and applied parame-ters. To identify a single value or a complete data row, the keys are defined in an application-specific but efficient way. On top of HBase, retrieval of single values (random access) or even bulk processing of all available data can be done very efficiently based on MapReduce programs. Another storage system for time series data isOpenTSDBwhich is also build around HBase. This sys-tem offers a set of best practices together with quite flexible tools to collect and manage time series from several IT Systems.
2.5 Apache Hive and Apache Pig
Some simple functions which can be used for time series anal-ysis are implemented inHive[9] andPig[10]. Both are high-level analysis frameworks on top of Hadoop. Both have their spe-cific scripting languages (HiveQL and Pig-Lattin) used for data analysis applications or data analysis work flows. Both systems require data stored within the underlying cluster, which means data have to be stored in HDFS, before they can be processed. Those systems are well accepted and very flexible, as well as extendable. With such high-level analysis tools the implementa-tion of scalable distributed procedures like filter, join, and group-ing operations or re-partitiongroup-ing of existgroup-ing data sets are very intuitive. The creation of time series pairs, which are used for cross-correlation or event-synchronization calculations, is a typ-ical case to use a join operation, which creates a cartesian prod-uct [35]. Operations on a record level, which means each single time series or each pair of time series is handled as a record here, are implemented by so-calledUser Defined Functions(UDF). Therefore, Hadoop.TS offers a set of UDF which help to reuse the implementations within Hive and Pig. This approach allows a quick integration of the Hadoop.TS algorithms within exist-ing analysis procedures or applications. An official collection of UDF for Pig is available in the project calledPiggyBank[36]. The projectSQLWindowing [37] is also focused on analytical
functions with some pre-built functions for windowing (to do ranking, aggregation, and linear regression) and table functions (to do time series analysis, market basket analysis, etc.). Analy-sis algorithms implemented in Hadoop.TS will be re-usable also within the SQLWindowing framework.
3. SCALABLE TIME SERIES PROCESSING –
THE BUCKET CONCEPT
Efficient data collection and accurate preprocessing of data are at least as important as the selection of the appropriate algorithm for a given problem. In research settings these types of questions cannot be answered in the beginning. Hadoop.TS is focused on such situations, since it separates data management and algo-rithm development while it connects both to the storage and pro-cessing platform. In many applications one has to organize the data according to the way they are processed later. This step is called partitioning of data and can be done as soon as data ap-pears or is collected. If one collects data in a more unstructured way, a preprocessing step is necessary for many algorithms. Even some re-partitioning might be needed if one wants to work with a different set of parameters like time resolution, sampling rate, time frame etc. Sometimes not the time series but some addi-tional information is used for grouping data, e. g. properties of reconstructed functional networks.
Hadoop.TS works with the concept of time seriesBuckets. Such a Bucket is a collection of time series which was created for a specific or even generic application of several time series al-gorithms. It is comparable to a table in a relational data base or to a Hive table, and beside this, it contains also the full pre-processing history. Buckets also contain descriptive statistics to support traceability across the whole data analysis workflow. Based on such data, some algorithms can do consistency checks before data are processed or before data from multiple Buck-ets are merged. Simple transformations of BuckBuck-ets are filtering, sampling and resampling or merging of multiple Buckets. Self-adapting algorithms will stop automatically with a warning if data do not fit to predefined compatibility roles. Such consistency or compatibility roles are useful in large applications with data from different sources and help to produce valid results, even if preprocessed data are used.
The storage procedures for Buckets have been optimized for bulk processing as well as for random access to each single time series identified by a unique identifier. Data synchronization and con-sistency checks have been implemented as a part of Hadoop.TS. While time series analysis is done as part of more complex anal-ysis workflows, Hadoop.TS tracks processing steps and collects a set of well defined properties to describe the life cycle of the data set. All relevant properties of each applied algorithm are col-lected in a processing history, which describes its state or phase within a longer life cycle.
4. DATA FLOW AND PROCESSING STAGES
After some important non-functional requirements were de-scribed in the previous section, the architecture and the core functionality of Hadoop.TS is explained in the following sec-tions.
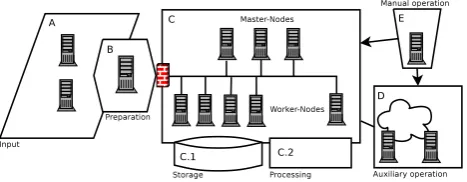
Fig. 2. Generic architecture of a Hadoop time series analysis cluster.
HDFS or HBase. An efficient import from relational database servers is done withSqoop.
A generic representation of data is a key to efficient analysis pro-cess integration. While HBase stores all data just as a byte array, analysis applications have to transform such data to a higher level representation in a consistent way. Figure 2 shows a Hadoop cluster and related systems between which data and metadata flow. Usually data are created or measured in one subsystem (A) before the data can be stored in the cluster (C), which is shielded by a firewall. The data collection and aggregation layer (B) is re-sponsible for data preprocessing. This is the place where a time series Bucket can be created and stored in HDFS (C.1). If data should be stored in HBase or OpenTSDB an additional prepro-cessing step (C.2) is necessary to create such Buckets, which are used later within a certain analysis task or workflow. An analy-sis context, which contains the process history of a data set, is defined within the metadata management tool (D). All process-relevant information, like parameter settings or even runtime logs, is managed by this external service, which offers a pro-cess memory and allows traceability of individual results. Beside metadata, also the binary libraries used in each procedure can be managed by this service. This provides a short path to reproduce a certain step later on, independent of the software version cur-rently available. Manual interactions with the whole system are done from a remote workstation (E), a cluster client.
Within a Hadoop cluster, multiple generic data flows can be identified. A classification for operations, implemented in Hadoop.TS is given in the following list:
—Collection and aggregation of un- or semi-structured data
—Extraction of event-data from documents or time series
—Creation of time series Buckets
—Change of sampling rate and filtering of Buckets
—(Re-) partitioning and extraction of random samples of time series from a Bucket
—Time series transformation or single time series processing
—Grouping and processing of time series pairs
5. TIME SERIES ANALYSIS IN COMPLEX
SYSTEMS RESEARCH
This section describes the details of the selected time series al-gorithms for complexity research, which have already been im-plemented in Hadoop.TS libraries. There are two major types, although in both cases many time series are used to calculate properties characterizing the complex system. Firstly, individual time series are used to calculate data later used for averages like the average fluctuation function of an ensemble of time series. With such results, one can find out if the underlying processes have long-term memory or feedback loops. Secondly, time se-ries pairs are used to calculate cross correlations, and then cross-correlation networks are reconstructed. With such functional net-works, the evolution of dynamical properties can be studied.
5.1 Long-Term Correlations in Time Series
5.1.1 Auto Correlations. The analysis begins with the subtrac-tion of the average value ∆xj(t) = xj(t)−x¯j withx¯j =
hxj(t)i= L1P L
t=1xj(t). Here,Lis the lengths of the
consid-eredjth time series(xj(t)). Then the (auto-) correlation function
is calculated for various time delayss(see, e. g. [24]),
C(s) = 1
h∆xj(t)2i(L−s) L−s
X
t=1
∆xj(t)∆xj(t+s) (1)
If the∆xj(t)are uncorrelated,C(s)is fluctuating around zero
fors >0. For the relevant case of long-term correlations,C(s)
decays as a power law characterized by a correlation exponentγ,
C(s)∼s−γ, 0< γ <1. (2) A direct calculation ofC(s)is often hindered by unreliable be-havior ofC(s)for largesdue to finite-size effects (finiteL) and non-stationarities in the data (i. e. a time-dependent, not well-defined averagehxj(t)ithat changes with the considered length
L).
5.1.2 Detrended Fluctuation Analysis (DFA). The DFA method was introduced in order to overcome these obstacles [13]. It has become a widely used technique for the detection of long-term correlations in noisy, non-stationary time series with more than 750 publications using the approach up to now (2013); see [15, 24, 16] for more detailed discussions of the method and its properties. In general, the DFA procedure consists of the following four steps:
(1) calculateYj(i) =P i
t=1[xj(t)−hxj(t)i],i= 1, . . . , L, the
so-called ’profile’,
(2) divideYj(i)intoLs= int(L/s)non-overlapping segments
of equal lengths,
(3) calculate the local trend for each segment by a least-square fit to the data, where linear, quadratic, cubic, or higher order polynomials [14] are used in the fitting procedure,
(4) determine the varianceF2
s(ν) of the differences between
profile and fit in each time segmentνofsdata points, (5) calculate the average ofF2
s(ν)over all segmentsνand take
the square root to obtain the fluctuation functionF(s). Multiple iterations with segments of differentsare necessary to determine the dependency ofF(s)on the time scales. For long time series this is a time consuming procedure which fits well to the distributed approach supported by Hadoop.TS. Usually,F(s)
increases with increasings. If dataxj(t)are long-term
power-law correlated according to Eq. (2),F(s) increases, for large values ofs, as a power-law, [13, 15, 24]
F(s)∼sα, α= 1−γ/2. (3) The fluctuation exponentαis calculated by a linear fit applied to a plot ofF(s)as a function ofson double logarithmic scales. For long-term correlated time series one findα >0.5, and in the case ofα= 0.5the data is uncorrelated.
5.1.3 Return Interval Statistics (RIS). Long-term memory ef-fects in dynamic systems can also be identified based on the analysis of return intervals between extreme events that exceed a given threshold. Depending on the properties of the underlying system the distribution of inter-event times can follow a power-law distribution, a Poisson distribution, an stretched exponen-tial distribution or even a bimodal distribution like it was shown recently by an analysis of telecommunication data [38] of hu-man interaction events. To describe the recurrence of events ex-ceeding a certain thresholdq, i. e.,xj(t) > q, one investigates
the statistics of the return time intervalsr =t2−t1|xj(t1) >
at timest1andt2. In an uncorrelated time series (’white noise’),
the return intervals are also uncorrelated and distributed accord-ing to the Poisson distribution,
Pq(r) = (1/Rq) exp(−r/Rq), (4)
whereRqis the mean return intervalhrifor the given threshold
q. For long-term correlated data, on the other hand, a stretched exponential distribution
Pq(r) =
aγ
Rq
exp[−bγ(r/Rq)γ] (5)
has been observed [20, 21, 22, 23, 39] where the exponentγis the correlation exponent from Eq. (2), and the parametersaγand
bγare independent ofq[22, 23]. In order to compare time series
with different average inter-event timesRqthe normalized
distri-butionsPq(r)Rqof return intervalsrbetween events exceeding
the different thresholdsqhave to be used.
5.1.4 Towards the Implementation in Hadoop.TS. RIS and DFA are applied individually to elements of a set of time series, organized in a Bucket, to study correlation properties within the time series. While RIS works with event time series that are usu-ally not equidistant, equidistant time series with constant sam-pling rate are required for DFA; thus one might have to pre-process the data accordingly. It is not a strong requirement to have time series of the same lengthL, but in case of differentL, one has to consider weighted averages and also different ranges for error bars, depending on the number of episodes considered for each length.
Event time series are given as an ordered list of time stamps, of times when an event happened. The RIS algorithm operates directly on such lists. In case of continuous time series, one has to convert the data to an event time series. A simple approach is to determine the times then a threshold is crossed, but also more sophisticated algorithms like described by Chiu et. al. [40] can be applied.
5.2 Dynamic Correlation Networks
A correlation network is a useful representation of a complex system. The evolution of the network allows the dynamical (time-dependent) analysis of structural properties due to interac-tions or couplings between individual elements of the complex system.
5.2.1 Cross Correlation (CC). CC analysis works on pairs of time series,(xj(t))and(xk(t)), which must have the same
sam-pling rate and the same lengthL. The calculation of the CC function is a common technique in order to quantify similarity of pairs of time series. It is defined as (compare with Eq. (2))
Rj,k(s) =
1
σj,k(L−s) L−s
X
t=1
∆xj(t)∆xk(t+s), (6)
with σj,k =
p
h∆xj(t)2ih∆xk(t)2i. The parameter s
de-termines the time delay between both time series, and again
∆xj(t) =xj(t)−¯xj. A linear correlation betweenxj(t)and
xk(t)can be analyzed this way if the values are Gaussian
dis-tributed. A time dependent analysis can be realized based on sliding windows.
5.2.2 Event Synchronization (ES). For pairs of event time se-ries ES is calculated, especially if the number of events within a certain time range is low or if no continuous time series are available. For very dense event time series one can increase the threshold which defines an event or one calculates the number of events within a certain time interval. This will lead to time series, for which the DFA and cross-correlation analysis can be applied as well.
A pair of event time series (with indexesjandk) consists of or-dered lists of the times when events occurred:tjl, l= 1, . . . , Lj
andtk
m, m = 1, . . . , Lkwith lengthsLj andLk, respectively.
Events attjl andtk
mwill be considered as synchronized if they
are closer to each other in time than to any of the other neighbor-ing events [25]. Therefore one defines reference time lagsτlnjk as
τlmjk= 1 2min t
j l+1−t
j l, t
j l−t
j l−1, t
k m+1−t
k m, t
k m−t
k m−1
, (7) and considers the two events attjlandtk
msynchronous if
t
j l−t
k m
≤τ
jk
lm. (8)
In the second step the quantityJlmjk is set to 1 if0< tjl−tk m<
τlmjk, and to 1/2 iftjl−tk m=τ
jk
lm, and 0 otherwise.J jk
lm>0thus
indicates thattjl precedestk
m, while both are synchronized. For
the opposite direction,0< tk m−t
j l ≤τ
jk lm,J
kj
mlis set
accord-ingly. In the third step all valuesJlmjk are cumulated:
c(j|k) =
Lj X l=1 Lk X m=1
Jlmjk. (9)
FinallyQjk= c(j
|k)+c(k|j)
√
LjLk describes the strength of event
syn-chronization, whileqjk=
c(j√|k)−c(k|j)
LjLk contains the
directional-ity information;√LjLkis used for normalization.
6. PACKAGES IN Hadoop.TS
Several packages of Hadoop.TS provide sample code and refer-ence implementations for specific tasks:
hadoopts.data.types Efficient implementations of time series al-gorithms depend on the compact presentation of data and fast procedures. Therefore meta data is separated from raw data. Data is loaded from standard data formats. Later it is converted to specific representations, optimized for several algorithms. For example, one dimensional arrays can be used for equidis-tant time series, while two dimensional arrays or even hash tables are used for event time series. The core functionality is implemented in a class calledTimeSeriesand more use-case specific functionality is added to subclasses.
hadoopts.data.converter Data mappers are implemented in this package to convert data from multiple external types or repre-sentations to the internally used formats.
hadoopts.bucket A time series Bucket is a collection of times se-ries data of equal resolution and equal length. Based on such Buckets multiple set operations can be performed by Hive, Pig, or other MapReduce programs. For example time series pairs can be created, data is filtered based on specific proper-ties like existence of peaks, or average values are calculated. These operations can be applied to one Bucket or multiple Buckets. Also preprocessing of data, like filling in missing val-ues or removing trends can be done on each single row within a set of time series stored in a Bucket.
hadoopts.data.stats Thestatspackage provides quality measures for data sets. Such information is useful for the interpreta-tion of results or even for finding an appropriate algorithm. Thestatsdata is be managed as part of the processing history within the metadata management system.
hadoopts.export Several input and output formats are provided here. This allows a smooth data flow across project borders within the Hadoop ecosystem. Export mappers create data files that can easily be imported by other analysis software like Matlab, or even Origin. Beside CSV, also XML and JSON encoding is available and allows an integration into multiple existing systems like web services.
hadoopts.udf In order to integrate the Hadoop.TS libraries on the functional level, the implementation of user defined func-tions can be used in Hive, Pig, or evenDatameer[41], which is a commercial data analysis platform on top of Hadoop.
7. DESIGN OF CORE COMPONENTS OF
Hadoop.TS
Beside an implementation of generic data containers, data type mappers, and some I/O formats the two major components of the Hadoop.TS library areTSBucketandTSProcessor. Based on those classes a generic procedure for large-scale time series pro-cessing is implemented.
[image:6.595.324.534.385.546.2]One way to use the library is the creation of a standalone appli-cation based on the example code. The complete TSBucket will be processed by just one single instance of the TSProcessor class (or any derived classes). This works well for tests while for ef-ficient large-scale processing the TSProcessor is used within the mapper or even the reducer class of a Map-Reduce program. The TSProcessor class is also used to implement user defined func-tions for the Hive and Pig framework.
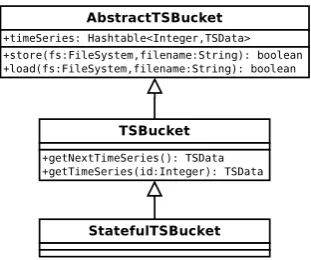
Fig. 3. Class diagram for the core TSBucket implementation. An abstract class implements all necessary functionality to handle time series data by a standalone application or within the a MapReduce
job. The BucketCreator is used to create an TSBucket, which is stored in a binary data file. The SequenceFileInputFormat, which is part of the Hadoop distribution, passes the data record by record (a record is time series in this context) to the mapper of a MapReduce
program. This procedure is optimized for highly parallel processing.
7.1 TSBucket
A TSBucket represents a set of preselected time series as inde-pendent data objects. Selection criteria are usually given by the analytical task. For example, randomly chosen but representative data from selected persons or sensors may be chosen.
The data has to be analyzed in different ways. To derive ensem-ble properties each element has to be processed individually first, and then averaged values are calculated based on the intermedi-ate results. On the other hand, pairs of elements of an ensem-ble have to be processed in the context of correlation analysis, so that functional networks can be reconstructed. Therefore, the TSBucket offers a compact format of preprocessed time series data.
The TSBucket contains a set of time series with the same length and the same sampling rate, each of them identified with an unique id, in order to connect results with other known prop-erties of related objects. The TSBucket data is stored within a SequenceFile or inAvroformat, which allows better interoper-ability between multiple development environments.
One single TSBucket can be seen as source for an individual analysis context or just as a part of a larger analysis context, which consists of multiple TSBuckets. An example for this is a large network with multiple clusters, where each cluster is used for an independent characterization of time series properties of its components. In this case the time series of nodes, which are part of a cluster are collected within a TSBucket. Multiple pro-jections of one network can lead to different clusters and in this way to different TSBuckets, but all are within one common re-search or analysis context.
[image:6.595.91.247.393.523.2]The simplest implementation of a TSBucket does not track the processing state while each record is processed individually. De-pending on the applied procedures, a TSBucket can also store its internal state over time, e. g. in order to calculate average val-ues at the end or in order to allow incremental updates, which is necessary if the analysis is done on a data stream. Based on this class, one can enhance the bulk processing capabilities. Process-ing incomProcess-ing data, which is part of a data stream, can be done from time to time, as soon as a reasonable amount of data is in the buffer. New data can be used in multiple internal process-ing channels, for example if multiple time scales or windows are processed in parallel.
Fig. 4. Class diagram for the TSProcessor and the TSTool implementation. The AbstractTSProcessor implements a connection to an external metadata store. The FilterTSProcessor is
a kind of a map-side join implementation for a standalone application and all analysis functionality is implemented within the
TSOperation classes.
7.2 TSProcessor
procedures is refreshed and stored within the processing cache. A FilterTSProcessor is a special variant of a TSProcessor which operates on a subset of the content in a TSBucket based on a list of record identifiers. This is achieved by a simple map side join operation and allows a reduction of the processed data vol-ume without an additional preprocessing step. All operations to be used on single time series objects or on time series pairs are implemented as subclasses of TSOperation.
8. SAMPLE APPLICATION
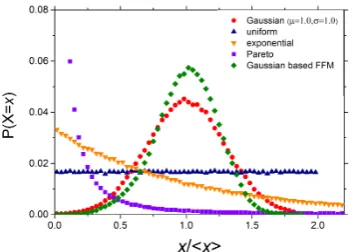
To illustrate the functionality of the Hadoop.TS library, a set of sample programs are provided. Multiple random number gen-erators for the creation of uncorrelated and correlated time se-ries (for examples, see Fig. 5) are included in the Hadoop.TS library. Simple functional tests for new algorithms or a system-atic analysis of specific properties of time series and can be done with mono-variate analysis (single row processing). Large data sets, stored in buckets, are used for performance benchmarking in Hadoop clusters. Exemplary results of such calculations are shown in Fig. 6 with distributionsPq(r)of inter-event timesr
[image:7.595.82.262.376.502.2]and DFA fluctuation functionsF(s)for two surrogate data rows: (i) long-term correlated data and (ii) uncorrelated data. More de-tails on benchmarking and applications to data collected from complex system will be presented in future publications.
Fig. 5. Probability density functions for sample data sets from included random number generators.
0 1 2 3 4 5
-2 0 2 4 6 8 10
l
o
g
(
F
(
s
)
)
log( s ) a)
0 1 2 3 4
-2 0 2
b)
l
o
g
(
R
q
*
P
(
r
/
R
q
)
)
r /< R
q
>
Fig. 6. For two surrogate data sets (uncorrelated: red circles, correlated withγ= 0.2according to Eq. (1): olive diamonds) results of both methods of long-term correlation analysis are shown: (a) DFA of order two and (b) RIS. The lines indicate the theoretical behaviors according to Eqs. (3)-(5) – red line:α= 0.5in
(a) and simple exponential in (b), olive line:α= 0.9in (a) and stretched exponential in (b).
9. CONCLUSION AND OUTLOOK
Statistical time series analysis, applied to large data sets, will improve existing approaches to complexity research. The dy-namics of complex systems, their evolution, as well as the co-evolution of different subsystems will be analyzed and modeled on large distributed computing clusters. In order to compare sim-ulation results with real-world data collections, one has to man-age such data sets within large storman-age clusters as well as dis-tributed workflows. As an enhancement to existing analysis soft-ware, especially as a contribution to the Hadoop ecosystem, the Hadoop.TS library provides an implementation of six relevant time series analysis algorithms, which have successfully been applied in several research projects, e. g. in traffic data analysis [28], and social media analysis [12, 26, 42].
During the next phase of Hadoop.TS development an optimiza-tion of the existing code base will be done. Especially memory consumption, conversion of intermediate data, as well as intro-duction of multi-threading concepts will be evaluated and im-plemented. Reference implementations of user defined functions (UDF) and custom data loader components (SerDe) for Hive and Pig will be implemented. The integration with GPU-based pro-cessing environments like CUDA will also be evaluated.
10. ACKNOWLEDGEMENT
The authors would like to thank Berit Schreck, Arne B¨oker, and Kathrin Dabelow for contributions and discussions regarding the time series analysis techniques. The initial Wikipedia data set was provided by the Wikimedia Foundation and preprocessed by Lev Muchnik. The latest version of Hadoop.TS [43] was de-veloped with the data set collected by Domas Mituzas, main-tained from 2010 through 2011 by Federico Leva. The authors would like to thank them for the preparation of the data. They also would like to thank Glynn Durham, Kai Voigt, and Alexan-der Alten-Lorenz for many very helpful Hadoop-related discus-sions. The authors are thankful to the European Union (FP7 ICT project SOCIONICAL, grant 231288) and the German Research Society (DFG, grant KA 1676/4) for financial support.
11. REFERENCES
[1] R. H. Shumway. D. S. Stoffer, “Time series analysis and its applications: with R examples,” 3rd ed., Springer, 2013. [2] “Encyclopedia of complexity and systems science,” ed.
R. Meyers, Springer, 2009.
[3] M. Small, “Applied nonlinear time series analysis: applica-tions in physics, medicine and economics,” World Scien-tific, 2005.
[4] H. Kantz, T. Schreiber, “Nonlinear time series analysis,” Cambridge University Press, 2003.
[5] Public data sets on AWS, http://aws.amazon.com/datasets. [6] Kaggle, http://www.kaggle.com.
[7] Apache Hadoop, http://hadoop.apache.org/.
[8] K. Shvachkoet al., “The Hadoop distributed file system,” in: Proc. IEEE 26th Symposium on Mass Storage Systems and Technologies (MSST), (Washington DC, USA), pp. 1– 10, IEEE Computer Society, 2010.
[9] Hive, http://hive.apache.org/. [10] PIG, http://pig.apache.org/.
[11] SOCIONICAL, http://www.socionical.eu/.
[12] M. K¨ampfet al., “Burst event and return interval statistics in Wikipedia access and edit data,” Physica A, vol. 391, pp. 9101–9111, 2012.
[image:7.595.57.290.588.672.2][14] A. Bunde et al., “Correlated and uncorrelated regions in heart-rate fluctuations during sleep,” Phys. Rev. Lett., vol. 85, pp. 3736–3739, 2000.
[15] J. W. Kantelhardtet al., “Detecting long-range correlations with detrended fluctuation analysis,” Physica A, vol. 295, pp. 441–454, 2001.
[16] A. Bashanet al., “Comparison of detrending methods for fluctuation analysis,” Physica A, vol. 387, pp. 5080–5090, 2008.
[17] J. W. Kantelhardtet al., “Multifractal detrended fluctuation analysis of nonstationary time series,” Physica A, vol. 316, pp. 87–114, 2002.
[18] J. Ludescher et al., “On the spurious multifractality in long-term correlated records: The effect of additive short-term memory, periodicities and noise,” Physica A, vol. 390, pp. 2480–2490, 2011.
[19] A. Y. Schumann, J. W. Kantelhardt, “Multifractal moving average analysis and test of multifractal model with tuned correlations,” Physica A, vol. 390, pp. 2637–2654, 2011. [20] A. Bundeet al., “The effect of long-term correlations on
the statistics of rare events,” Physica A, vol. 330, pp. 1–7, 2003.
[21] A. Bundeet al., “Long-term memory: A natural mecha-nism for the clustering of extreme events and anomalous residual times in climate records,” Phys. Rev. Lett., vol. 94, p. 048701, 2005.
[22] E. G. Altmann, H. Kantz, “Recurrence time analysis, long-term correlations, and extreme events,” Phys. Rev. E, vol. 71, p. 056106, 2005.
[23] J. F. Eichneret al., “Statistics of return intervals in long-term correlated records,” Phys. Rev. E, vol. 75, p. 011128, 2007.
[24] J. W. Kantelhardt, “Fractal and multifractal time series,” in [2].
[25] R. Q. Quirogaet al., “Event synchronization: A simple and fast method to measure synchronicity and time delay pat-terns,” Phys. Rev. E, vol. 66, p. 041904, 2002.
[26] M. K¨ampfet al., “From time series to co-evolving net-works: Dynamics of the complex system Wikipedia,”
Proc. Europ. Conf. Complex Systems (ECCS), Brussels 2012.
[27] A. Bashanet al., “Network physiology reveals relations be-tween network topology and physiological function,” Na-ture Commun., vol. 3, p. 702, 2012.
[28] J. W. Kantelhardtet al., “Transitions in traffic scaling and cross-correlation behavior,” submitted to Physica A, 2013. [29] Apache Mahout, http://mahout.apache.org.
[30] Apache Giraph, http://incubator.apache.org/giraph/. [31] L. G. Valiant, “A bridging model for parallel computation,”
Commun. ACM, vol. 33, pp. 103–111, 1990.
[32] G. Malewiczet al., “Pregel: a system for large-scale graph processing” in: Proc. 28th ACM symp. Principles of dis-tributed computing (PODC) (New York), p. 6, 2009.
[33] Apache Commons Math,
http://commons.apache.org/math/.
[34] P. Pebay, “Formulas for robust, one-pass parallel compu-tation of covariances and arbitrary-order statistical mo-ments,” SANDIA report, Sept. 2008.
[35] D. Miner and A. Shook, “MapReduce Design Patterns,” O’Reily, 2012.
[36] Piggybank, https://cwiki.apache.org/pig/piggybank.html. [37] SQLWindowing, http://github.com/hbutani/sqlwindowing. [38] Y. Wuet al., “Evidence for a bimodal distribution in human
communication,” Proc. Natl. Acad. Sci., vol. 107, p. 18803, 2010.
[39] P. Ch. Ivanovet al., “Common scaling patterns in intertrade times of US stocks,” Phys. Rev. E, vol. 69, p. 056107, 2009. [40] B. Chiuet al., “Probabilistic discovery of time series
mo-tifs,” SIGKDD (Washington DC, USA), 2003.
[41] M. K¨ampf, “Datameer: Smart processing for big data,” Javamagazin, pp. 40–48, July 2012.
[42] M. K¨ampf, “Time-Series based reconstruction and anal-ysis of complex networks,” PhD dissertation, Institute of Physics, Martin-Luther University Halle-Wittenberg, Ger-many, 2013.