http://dx.doi.org/10.4236/eng.2014.68046
Variable Gear Ratio Control Using Vehicle
Body Slip Angle
Takahiko Yoshino, Hiromichi Nozaki
Department of Mechanical Engineering, University of Kogakuin, Tokyo, Japan Email: [email protected]
Received 29April 2014; revised 30May 2014; accepted 11June 2014
Copyright © 2014 by authors and Scientific Research Publishing Inc.
This work is licensed under the Creative Commons Attribution International License (CC BY). http://creativecommons.org/licenses/by/4.0/
Abstract
Vehicles with variable steering characteristics have long been studied and compared with those having typical fixed gear ratio steering, and the variable gear ratio properties are reported to have improved maneuverability and stability in high-speed lane changes and on slippery low-friction road surfaces. However, it is not clear how gear ratios should be set for individual vehicle charac-teristics. Therefore, the present study has investigated a variable steering gear system using body slip angle feedback for the purpose of improved maneuverability and stability in the critical cor-nering range and upwards, in excess of the critical limit, and into the countersteer range. The re-sults of a driving simulator experiment show that the steering effect improves and maneuverabil-ity and stabilmaneuverabil-ity increase in the critical cornering range and upwards, in excess of the critical limit, and into the countersteer range by applying linear-variable control to the steering ratio from a body slip angle of 5˚. This result is seen both in double lane changes, such as in hazard avoidance, and in J-turns with long drifting. Moreover, it shows an improvement in drift controllability through prompt countersteering. Overall, the present system can enhance the driver’s hazard avoidance capability.
Keywords
Motion Control, Automobile, Vehicle Dynamics, Maneuverability, Variable Gear Ratio
1. Introduction
ratio is varied according to the vehicle speed and steering wheel angle, and Variable Gear Ratio Steering (VGRS), where the gear ratio is varied according to the vehicle speed, steering angular velocity, as well as split friction roads. Compared with the usual fixed gear ratio, steering with variable gear ratio properties is reported to have improved maneuverability and stability in high-speed lane changes and on slippery, low-friction road surfaces [5]. Furthermore, Nozaki reports that when the rear wheels fall into the drift range, a vehicle is easier to control (even when unstable) through the use of variable steering gear control where a steering gear ratio of 7.5 - 9.0 is achieved [6]. However, it is not necessarily clear how gear ratios should be set for individual vehicle characteristics. The present study has therefore investigated a variable steering gear system with body slip angle feedback for the purpose of improved maneuverability and stability in the critical cornering range and upwards, in excess of the critical limit, and into the countersteer range.
On the other hand, Nozaki reports that Differential Steering Assist (DSA) is effective as it can reduce the countersteer delay in drift cornering [7]-[9]. We hypothesized that the combination of differential steering assists and the variable steering system proposed in the present study promises to be significantly effective; therefore, we also investigated this cooperative control method. The present study considers vehicles where free variable control of the front-wheel steering characteristics is implemented, such as steer-by-wire vehicles that are likely to become standard in the future. We investigated variable gear ratio control that improves the driver’s hazard avoidance capability by utilizing the degrees of freedom of steer-by-wire systems. We performed an investiga-tive experiment using a driving simulator that supports drift cornering, the results of which, reported here, show that adding a control mechanism promises to be remarkably effective.
2. Experimental Apparatus
2.1. Driving Simulator to Simulate Drift Cornering
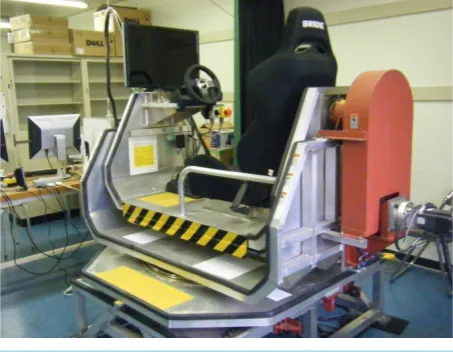
The driving simulator used in the present study realistically reproduces not only grip cornering but also drift cornering. It can simulate extensive yawing behavior and lateral acceleration through triaxial control (yaw, roll, and lateral translation), and dynamic behaviors such as spin or drift in the critical cornering area/ranges can be reproduced. The driving simulator consists of three parts—a PC for control, a motion device, and a control panel —and performs triaxial control based on the yaw rate and the lateral acceleration generated by CarSim. The driving simulator configuration is shown in Figure 1, and the motion device specifications are shown in Table 1. Black curtains are drawn around the test subjects to enhance the sensation of actually driving, and the subjects operate the vehicle based on moving images of driving situations projected on the display.
2.2. Vehicle Model
[image:2.595.200.427.536.712.2]CarSim, a full-vehicle simulator developed by the Mechanical Simulation Corporation (MSC, USA), is used as the vehicle model for the driving simulator. Table 2 lists the number of main vehicle components and the num-ber of degrees of freedom. The specifications for the test vehicle used in this experiment are shown in Table 3.
Table 1.Parameters and performance of driving simulator.
Item Performance
Actuator AC servo motor
Control method Three-axis control method for roll, yaw, and lateral movements (feedback control by potentiometer)
Main specifications
Shake & rotation frequency: 0 - 3 Hz Roll motion
Max. angle: ±20 deg
Max. angular velocity: ±50 deg/sec Yaw motion
Max. angle: ±90 deg
Max. angular velocity: ±40 deg/sec Lateral movement
Max. displacement: ±200 mm Max. velocity: ±240 mm/sec Lateral acceleration: ±0.7 G
Size of device Width: 1525 mm, length: 2037 mm, height: 1800 mm
Weight of device 400 kg
[image:3.595.94.506.113.720.2]Power supply Single-phase AC 200 V and single phase AC 100 V
Table 2. Components and degrees of freedom of the vehicle model [10].
Bodies
Sprung mass body 1
Unsprung mass bodies (wheel carriers) 4
Rotating wheels 4
Engine crankshaft 1
Total 10
Degrees of freedom
Sprung body translation 3
Sprung body rotation (yaw, pitch, roll) 3
Suspension stroke 4
Wheel spin 4
Powertrain (engine crank shaft) 1
Tire delayed slip (lateral, longitudinal) 8
Brake fluid pressure 4
Total 27
Table 3. Parameters for calculation.
Width of vehicle (mm) 1988
Wheelbase (mm) 2690
Distance from center of front axle to center of gravity (mm) 1014
Height from ground to center of gravity (mm) 542
Vehicle mass (kg) 1527
Roll moment of inertia (kg·m2) 606.1
Pitch moment of inertia (kg·m2) 2741.9
A vehicle model with an FR layout (front-engine, rear-wheel drive) was configured for the engine layout and drive system.
Typical tire characteristics, as shown inFigure 2, were used for the tire cornering force characteristics. The maximum cornering force is at a slip angle of 10˚, and the acceleration and deceleration characteristics were configured as shown in Figure 3. When the slip angle and slip ratio are applied simultaneously, they are calcu-lated using the friction circle concept. The final behavior in the present study demonstrates a rear-wheel skid. The grip limit in the present paper is therefore given for the point where the rear wheels generate the maximum cornering force.
3. Vehicle Control System
3.1. Variable Steering Gear System Using Body Slip Angle Feedback
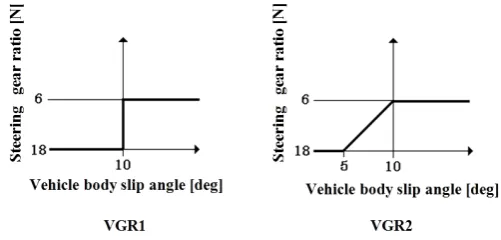
Within the grip range, an adequate steering gear ratio for normal vehicles of 15.0 - 18.0 is effective. Due to the significant amount of steering to reach the countersteer angle required in the drift range, a time delay may occur. We therefore posed the hypothesis that reducing the steering gear ratio will be effective. For the variable steer-ing gear system used in the present study, we used a model that applies variable control to the steersteer-ing gear ratio using the body slip angle (Figure 4). VGR1 distinguishes between drifting and gripping based on the body slip angle. When the body slip angle exceeds 10˚ (the body slip angle at maximum cornering force), the steering gear ratio is brought down from 18 to 6 in steps. In other words, when the vehicle is drifting, the steering gear ratio is changed, and the countersteer delay is reduced. VGR2 changes the steering gear ratio in a linear fashion when the body slip angle is 5˚ or over. The cornering force decreases, and the steering effect lags in the critical cor-nering range. Lowering the steering gear ratio improves the steering effect. The steering gear ratio is maintained at 6 for a body slip angle of 10˚ or over. Through this, the maneuverability and stability can be expected to im-prove in the critical cornering range and upwards in excess of the limit and into the countersteer range.
[image:4.595.202.427.427.546.2]3.2. Differential Steering Assist
Symbols:Figure 2. Tire cornering force characteristics.
[image:4.595.201.424.578.706.2]δf: Front-wheel actual steering angle
δH: Steering angle H
δ
: Steering angular velocity N: Steering gear ratioP: Differential steering assist constant
f H N P H
δ
=δ
+ ⋅δ
(1)As shown in Equation (1), a method is used for the differential steering assist (DSA) where the sum of the product of the steering angle input and the gear ratio and the product of the differentiated steering angle value and the DSA constant P are entered as the front-wheel actual steering angle [11] [12]. By applying differential steering assist control when the body slip angle exceeds 10˚, the countersteer delay can be reduced. By varying this P value, the differential steering assist effect can be reinforced or weakened. In fact, a differential steering assist control block (Figure 5) has been provided for the Simulink steering section in the driving simulator dis-cussed in Section 2.
4. Verification Experiment Using a Driving Simulator
4.1. Experimental Method
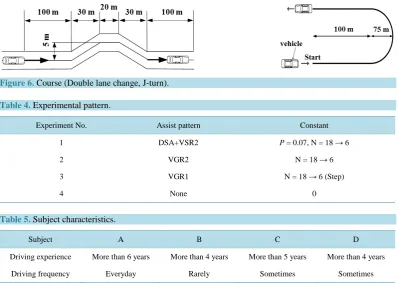
[image:5.595.186.437.465.585.2]For the present study, we conducted an experiment with a double lane change course, such as in hazard avoid-ance, and a J-turn course. The experimental course is illustrated in Figure 6. For the double lane change course, the vehicle entered the course from a straight line at a maximum passing speed of 135 km/h and steered so that it does not leave the lane. For the J-turn course, the vehicle speed was 90 km/h, a high enough speed that is ac-companied by drifting. The vehicle speed was set to maintain the specified speed. The subjects were instructed to concentrate on the steering and to follow the target course. The experiment was conducted according to four variations: VGR1, VGR2, DSA + VGR2 (DSA constant P = 0.07), and No Control (conventional FR vehicles without control), as described inTable 4. A subject was considered to have performed the experiment success-fully if they completed the course and to have failed if they deviated substantially from the course or spun the vehicle out. The experiment was run five times for each variation in random sequences. The subjects are listed in Table 5. The experiment was conducted with a total of four subjects: one subject was relatively familiar with driving a car (Subject A), one subject had a driving license but hardly ever drove a car (Subject B), and two
Figure 4. Comparison of the gear ratio changes of VGR2 and VGR1.
Steering Wheel
Memory
Constant
Product Sum
rad→deg
Front wheel steer Gain
Derivative du/dt deg→rad
1/N 2*Pi/360
δH
δf
360/(2*Pi)
Figure 6.Course (Double lane change, J-turn).
Table 4.Experimental pattern.
Experiment No. Assist pattern Constant
1 DSA+VSR2 P = 0.07, N = 18 → 6
2 VGR2 N = 18 → 6
3 VGR1 N = 18 → 6 (Step)
4 None 0
Table 5. Subject characteristics.
Subject A B C D
Driving experience More than 6 years More than 4 years More than 5 years More than 4 years
Driving frequency Everyday Rarely Sometimes Sometimes
subjects occasionally drove (Subject C) and (Subject D). The subjects were asked to complete a 30-minute training session before the experiment to familiarize themselves with operating the driving simulator.
4.2. Results of the Double Lane Change Course Experiment and Observations Based on the
Running Data
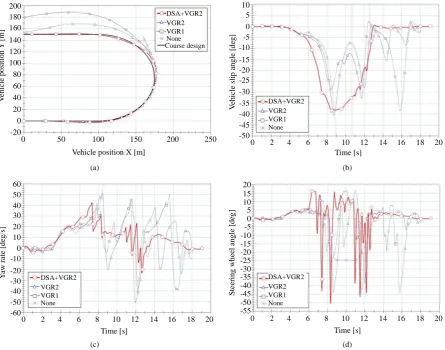
Figure 7 show the experimental results for Subject A (the experimental results for the other subjects showed similar trends). The travel trajectory in the experiment shown in Figure 7(a) makes clear that for DSA + VGR2, the travel trajectory almost completely stayed within the course, and there was little deviation near the course exit. For VGR2, the vehicle passed through a point a little outside of the course but ultimately returned to the course. For VGR1 and No Control, the vehicle was unable to follow the course at the end of the single lane change around 150 m and exited the course.
Based on the body slip angle results shown in Figure 7(b), we found that the body slip angle is most reduced for DSA + VGR2. The slip angle was stable with the maximum being 14˚ and converged swiftly. For VGR2, the slip angle increased with a maximum of 25˚, but by applying variable control on the steering gear ratio from a body slip angle of 5˚, the steering effect improved around the critical cornering range and started to converge. For VGR1 and No Control, the body slip angle exceeded 10˚ from around 3.5 seconds, entered the drift range, and spun out. For VGR1, the vehicle was brought under control by changing the steering gear ratio to 6 when the body slip angle reached 10˚, but the radically changed steering feel affected the driver’s subsequent opera-tion, and the vehicle ultimately spun out. In the No Control variaopera-tion, the vehicle was not once brought under control and spun out.
The yaw rate is illustrated inFigure 7(c). It was within 40 to −60 deg/s for DSA + VGR2 and VGR2, and the body behavior was stable. For VGR1 and No Control, there was substantial aberration from around 3.5 seconds when the vehicle entered a drift state, and it is clear from the yaw rate that the vehicle spun out.
Figure 8 illustrates the success rate of the experiment. The results indicate that for all subjects, the highest success rate was for DSA + VGR2. When comparing the next most successful VGR2 with DSA + VGR2, the effect of the presence or absence of DSA becomes apparent. The success rate for VGR1 was lower than for VGR2, and the difference in steering effect around the critical cornering range with a slip angle of 5˚ - 10˚ can be said to affect the success rate. The success rate for the No Control variation was 0% for all subjects, and they were hardly able to drive.
0 50 100 150 200 250 300
Vehicle position X [m]
V ehi cl e po si ti o n Y [ m ] 0 -3 -2 -1 1 2 3 4 5 6 7 8 DSA+VGR2 VGR2 VGR1 None Course design 0 Time [s] V eh ic le s li p an g le [ d eg ] -40 DSA+VGR2 VGR2 VGR1 None
1 2 3 4 5 6 7 8 9
-30 -20 -10 0 10 20 30 40 35 25 15 5 -5 -15 -25 -35
(a) (b)
0
Time [s]
1 2 3 4 5 6 7 8 9
Y aw r at e [ d eg /s ] -20 DSA+VGR2 VGR2 VGR1 None 0 20 40 60 -10 -30 -40 -50 -60 10 30 50 -70 -80 70 80 0 Time [s]
1 2 3 4 5 6 7 8 9
S te er in g w h ee l an g le [ d eg /s ] -20 DSA+VGR2 VGR2 VGR1 None 0 20 40 60 -10 -30 -40 10 30 50 70 80
[image:7.595.85.537.168.517.2](c) (d)
Figure 7.Experiment results. (a) Running trajectory; (b) Vehicle body slip angle; (c) Yaw rate; (d) Steering wheel angle.
R at es o f s u cces s [ % ] DSA+VGR2 VGR2 VGR1 None 40 60 0 20 80 100
Subject A Subject B Subject C Subject D
[image:7.595.162.465.549.706.2]4.3. Results of the J-Turn Course Experiment and Observations Based on the Running
Data
Figure 9 show the experimental results for Subject A (the experimental results for the other subjects showed similar trends). As is clear from the travel trajectory in the experiment, as illustrated inFigure 9(a), the course was most closely followed with DSA + VGR2. For VGR2, the vehicle drifted outwards by about 20 m near the J-turn course exit but ultimately returned to the course. For VGR1, the vehicle drifted outwards by about 40 m near the J-turn course exit and was unable to follow the course. For the No Control variation, the course could not be completed, and the vehicle exited the course.
The body slip angle shown inFigure 9(b) illustrates the behavioral differences for all assist variations from around 5 seconds, when the vehicle entered its cornering state. For DSA + VGR2, the slip angle fluctuations stabilized even after entering the drift range, and convergence was swift. Next, the maximum value for VGR2 hardly varied from that for DSA + VGR2, but maintaining the drift state became difficult. However, since the steering effect had improved by applying variable control to the steering gear ratio, a move towards convergence could be made. In the case of VGR1, the steering feel had undergone a radical change through the switch in the steering gear ratio, and although the vehicle did not spin out, it was unstable, and convergence was delayed. For the No Control variation, the value increased rapidly from around 8 seconds, and the vehicle was not once brought back under control and spun out.
The yaw rate is shown in Figure 9(c). The graph shows that for DSA + VGR2, there was little change in the yaw rate, and the body remained stable. There was more variation in the yaw rate for VGR2, but it started to converge from 8 seconds. The amount of variation for VGR1 remained large until the end. The No Control variation showed substantial deviation as the vehicle spun out from around 8 seconds.
0 50 100 150 200 250
Vehicle position X [m]
V ehi cl e po si ti o n Y [ m ] -20 DSA+VGR2 VGR2 VGR1 None Course design 0 20 40 60 80 100 120 140 160 180 200 0 Time [s] V eh ic le s li p an g le [ d eg ] -40 DSA+VGR2 VGR2 VGR1 None
2 4 6 8 -30 -20 -10 0 10 5 -5 -15 -25 -35
10 12 14 16 18 20 -50
-45
(a) (b)
Y aw r at e [ d eg /s ] -20 DSA+VGR2 VGR2 VGR1 None 0 20 40 60 0 Time [s]
2 4 6 8 10 12 14 16 18 20 -10 -30 -40 -50 -60 10 30 50 0 Time [s] S teer in g w h eel a n g le [ d eg ] -40 DSA+VGR2 VGR2 VGR1 None
2 4 6 8 -30 -20 -10 0 10 5 -5 -15 -25 -35
10 12 14 16 18 20 -50
-45
-55 15 20
[image:8.595.91.537.355.705.2](c) (d)
R
at
e
o
f s
u
cc
es
s [
%
]
DSA+VGR2
VGR2
VGR1
None 40
60
0 20 80 100
Subject A Subject B Subject C Subject D
Figure 10. Success analysis (J-turn course).
[image:9.595.161.463.81.268.2]The steering wheel angle is shown in Figure 9(d). It shows that in the three cases where control is applied, the body was controlled through countersteer. For the DSA + VGR2 variation, the DSA effect allowed for small corrections to the body once it entered the drift range, and the steering wheel could be returned to steering in a straight line the quickest. For VGR2 and VGR1, differences emerged in driver operation due to the variable steering gear system. For VGR2, the steering wheel angle was greatest at around 9 seconds, and the amount of operation gradually decreased. For VGR1, the steering wheel angle was greatest at around 16 seconds without much variation in the amount of operation for the entire course. Since the No Control variation had no assist function, the steering wheel response was slow, and the body could not be controlled through countersteer.
Figure 10 shows the success rates for the experiment. The success rates were found to be highest with DSA + VGR2 for all subjects. Favorable results were achieved through the multiplier effect of DSA control in the ranges where the cornering limit was exceeded, which added to the improvement in steering effect by VGR2 near the grip range. The next best results were achieved by VGR2, VGR1, and No Control, in that order.
5. Conclusion
The present study has investigated a variable steering gear system with body slip angle feedback for the purpose of improving maneuverability and stability in the critical cornering range and upwards, in excess of the critical limit, and into the countersteer range. The results show that the steering effect improves and maneuverability and stability increase for cornering in the critical cornering range and upwards, in excess of the critical limit, and into the countersteer range by applying linear-variable control to the steering ratio from a body slip angle of 5˚. This result is seen both in double lane changes, such as in hazard avoidance, and in J-turns with long drifting. It moreover showed an improvement in drift controllability through prompt countersteering. A multiplier effect was found by combining the present system with differential steering assist, thus enabling easier control of vehi-cle behavior in the drift range. The present system can improve the driver’s hazard avoidance capability.
References
[1] Motoyama, S. (2003) The Possibilities of Steer-by-wire on Vehicle Dynamics (Topics: Automotive Electronics in 21st Century). Journal of Society of Automotive Engineers of Japan, 57, 39-43.
[2] Yamane, K. (2004) Active Steering System (Essay). Journal of Society of Automotive Engineers of Japan, 58, 96-97.
[3] Amano, Y., Doi, S. and Kawaguchi, H. (1999) Improvement in Evasive Maneuver by Active Control of Steering Angle and Torque Characteristics. Transactions of the Society of Automotive Engineers of Japan, 30, 87-92.
[4] Shimizu, Y., Kawai, T., Yazuriha, J. and Takimoto, S. (1999) Effects and Design of Steering System with Variable Gear-Ratio According to Vehicle Speed and Steering Wheel Angle. Proceedings of Annual Conference of Society of Automotive Engineers of Japan, Yokohama, May 1999, 9-12.
[6] Nozaki, H. (2005) About the Influence of the Steering Wheel Gear Ratio. Journal of the Faculty of Science and Engi-neering, Kinki University, 41, 37-41.
[7] Nozaki, H. (2005) Effect of Differential Steering Assist on Drift Running Performance. SAE Paper, 2005-01-3472, 1-8. http://dx.doi.org/10.4271/2005-01-3472
[8] Nozaki, H. (2009) Consideration of Steering Method Control based on Driving Situations. SAE Paper, 2009-01-2866, 1-8. http://dx.doi.org/10.4271/2009-01-2866
[9] Nozaki, H., Shimizu, M. and Sakuno, M. (2010) Consideration of Critical Cornering Control Characteristics via Driv-ing Simulator That Imparts Full-Range Drift CornerDriv-ing Sensations. SAE International Journal of Commercial Vehicles, 2, 256-263. http://dx.doi.org/10.4271/2009-01-2922
[10] Watanabe, Y. and Sayers, M.W. (2002) A Extending Vehicle Dynamics Software for Analysis, Design, Control, and Real-Time Testing. Proceedings of AVEC’02, 4545, 407-412.
[11] Nozaki, H. (2009) Consideration of Steering Method Control Based on Driving Situations. Transactions of the Japan Society of Mechanical Engineers, C, 75, 781-788.
currently publishing more than 200 open access, online, peer-reviewed journals covering a wide range of academic disciplines. SCIRP serves the worldwide academic communities and contributes to the progress and application of science with its publication.
![Table 2. Components and degrees of freedom of the vehicle model [10].](https://thumb-us.123doks.com/thumbv2/123dok_us/8074396.780524/3.595.94.506.113.720/table-components-degrees-freedom-vehicle-model.webp)