http://dx.doi.org/10.4236/jep.2015.611113
How to cite this paper: Modaihsh, A.S., Al-Barakah, F.N., Nadeem, M.E.A. and Mahjoub, M.O. (2015) Spatial and Temporal Variations of the Particulate Matter in Riyadh City, Saudi Arabia. Journal of Environmental Protection, 6, 1293-1307. http://dx.doi.org/10.4236/jep.2015.611113
Spatial and Temporal Variations of the
Particulate Matter in Riyadh City,
Saudi Arabia
Abdullah S. Modaihsh, Fahd N. Al-Barakah, Mahmoud E. A. Nadeem, Mohamed O. Mahjoub* Department of Soil Science, College of Food and Agricultural Sciences, King Saud University, Riyadh,
Kingdom of Saudi Arabia
Received 22 October 2015; accepted 24 November 2015; published 27 November 2015
Copyright © 2015 by authors and Scientific Research Publishing Inc.
This work is licensed under the Creative Commons Attribution International License (CC BY).
http://creativecommons.org/licenses/by/4.0/
Abstract
Mass concentrations of PM10 and PM2.5 for January 2012 up to October 2013 were measured at two sites; a suburban area, Riyadh airport (AP) and an urban area, King Fahd road district (KF) (dense-ly trafficked site). Dai(dense-ly concentrations of both PM10 and PM2.5 measured at these two sites were highly variable. The temporal variation observed either for PM10 or PM2.5 was associated mainly with the dust events. The annual pattern of PM10 and PM2.5 at the AP station shows a significant in-crease in spring and summer (dusty seasons) where monthly mean concentrations of up to 696 μg·m−3 PM10 were recorded in March. PM10 concentrations during winter months are significantly lower, with 65 μg·m−3 measured in November and 78 μg·m−3 measured in December. January exhi-bits PM10 concentrations little above 100 μg·m−3. Both PM10 and PM2.5 showed substantial variations at these two monitoring stations during the study period. In the urban station (King Fahd), average annual PM10 varied by up to roughly a factor of two. This variation implies that local emission sources in this site often contribute much (i.e. greater than half) of the PM10 mass on annual aver-age. The variation of monthly (temporal) mean PM10 at KF station showed more or less similar re-sults to the AP station. Higher concentrations were observed during spring and summer (12%, 17% and 13% in Feb., March and April respectively and 17, 15% during June and July). Starting from September and October, PM10 concentrations started to drop to 7% and 8% respectively. The rela-tionships between the mean values of suspended particle concentrations and meteorological va-riables (relative humidity ambient temperature and wind speed) were analyzed. The results dem-onstrate that the influence of weather factors upon dust particulates is largely inconclusive. How-ever, At KF station a moderate positive correlation was observed between wind speed and PM.
Keywords
PM10, PM2.5, Meteorological Data, Saudi Arabia, Riyadh
which was usually observed in the atmosphere of Riyadh at high concentrations was undertaken [11]. However, the studies mentioned above were based on limited number of samples. A relatively detailed study on PM sam-ples collected from June 2006 to May 2007 showed that the PM concentrations were higher for PM10 compared
to PM2.5, indicating that the major PM source was local dust [12]. A recent study showed that PM concentration
was approximately 3 times higher than the country’s ambient air quality standards respectively. In addition, this study demonstrated that summer vs. winter comparison showed that PM concentrations were approximately 84% higher in summer [13].
The primary goal of this study was to carry out a comprehensive characterization of PM1, and PM2.5 and
pro-vide the scientific background for further control of air pollution at Riyadh and to develop effective strategies to reduce the ambient deposition and concentrations of those pollutants to the city.
2 Methods
Traditional method of PM10 dust measurement is based on a weight to volume measurement, where by the dust
is collected on a filer and subsequently weighed. This method requires a rigid adherence to time consuming procedures. With the finer dust size fraction introduction (PM2.5, PM1) the problem is negligible mass compared
to the large numbers of these particles. For these reason a newly developed Aerosol Spectrometer will be intro-duced for measurement of various PM particulates.
In this study, the concentrations of coarse (PM10), and fine (PM2.5), particulate matter were measured using a
Grimm model EDM 365 aerosol spectrometer (Grimm Aerosol Technique GmbH, Airing, Germany). The de-vice, an optical particle counter (OPC), is an instrument for real-time measurement of particulate matter. The particle size analyzer/dust monitor determines the dust-concentration (counts/liter) through the optical-light- scattering method directly; however, the mass concentration is determined by extrapolation. The calculated mass concentration may be corrected to the specific aerosol measured with the gravimetric-correction factor (C-Factor). The advantages of this instrument over other real-time measurement instruments, such as TEOM or DMA de-vices, are its convenience, its low maintenance requirements, and its ability to run for long periods without spe-cific supervision. The ability to measure particulate matter concentrations in time intervals ranging from 1 s to 60 min is considered to be another advantage offered by the instrument. The validity of the measurements per-formed by the instrument has been evaluated by several studies [14]. The dust monitor was installed on the roof of the Meteorology and Environmental building near Riyadh airport. The dust monitor runs 24 hours a day con-tinuously.
3 Results and Discussion
3.1. Seasonal and Monthly Variability in PM Concentrations
3.1.1. Airport Station
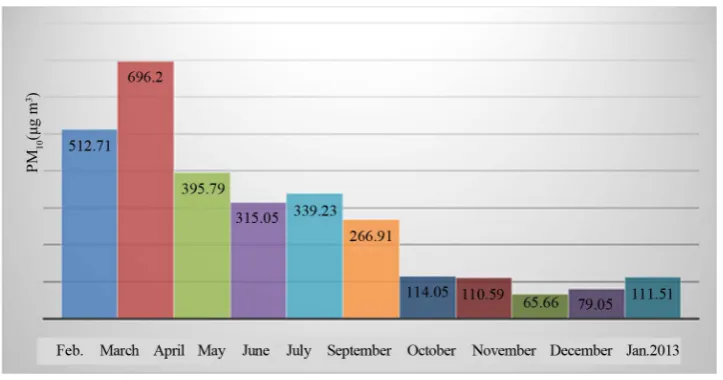
The monthly variation of PM10 concentrations as obtained from the daily mean recordings across the whole
Figure 1. Average monthly PM10 mass concentration during Feb. 2012-January 2013 (A.P).
events [15]. The highest PM10 concentration (2234 µg·m−3) is recorded during March 18th, closely associated
with a severe dust event. One can, therefore, conclude that the intense dust storms taking place on specific days during spring and early summer are predominantly responsible for the large month-to month variations at all PM concentrations. The annual pattern of PM10 shows a significant increase in spring and summer where monthly
mean concentrations of up to 696 μg·m−3
were recorded in March. PM10 concentrations during winter months
are significantly lower, with 65 μg·m−3 measured in November and 79 μg·m−3
measured in December. January exhibits PM10 concentrations of little above 100 μg·m−3, which persists until February when PM10 levels
in-crease as a result of dust events.
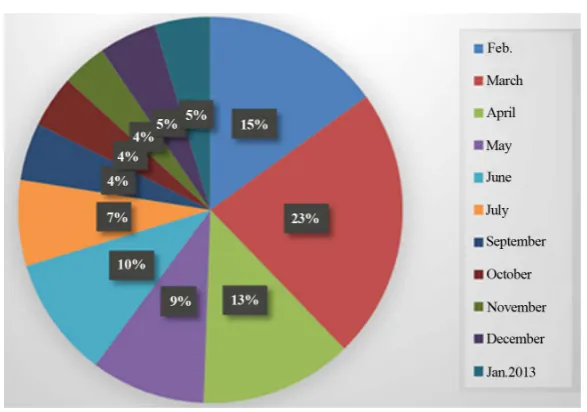
The PM10 data when grouped by month (Figure 2), indicated a consistent and systematic pattern decreasing in
the order: spring (February-April, 53%) followed by summer (May-July, 30%) and fall and winter (September- January, 18%). The spring Peak of PM10 is coinciding with dust events that commonly occur during spring in
Riyadh. In contrast, the lowest PM concentration in winter can be attributed to the absence of dust events during winter. The variation of monthly mean PM2.5 (Figure 3, Figure 4) is quite similar to PM10; (March maximum).
The similarity in the annual variation between PM10 and PM2.5 suggests some similarities in source regions for
these aerosol sizes.
Some studies conducted in other urban environments, in Turkey [16] and in Athens, Greece [17] found, con-trary to our results, that in winter both PM concentrations were higher, which was attributed to larger use of fos-sil fuels in winter. A monthly mean PM10 concentrations in Athens ranging from 60.3 μg·m−3 (January) to 88.9
μg·m−3 (December), with an annual mean value of 75.5μg·m−3
was reported [17]. In Barcelona, Spain, the am-bient PM10 and PM2.5 were in the range of 39 to 42 μg·m−3 and 25 to 29 μg·m−3, respectively over the period
2003-2006 with 97 daily values exceeding 50 μg·m−3 [18] while the mean annual PM10 concentration ranges
from 20 to 37 μg·m−3 in Rio de Janeiro, Brazil [19]. Comparing the present results with those of the above-
mentioned studies, it is concluded that the city of Riyadh is exposed to much higher PM concentration levels. This is not only the case for summer, when the area is affected by natural phenomena, but also for winter. This highlights the fact that PM concentrations over Riyadh can be regarded as a genuine environmental problem that poses a real risk to quality of life and threatens human health.
3.1.2. King Fahd Station (2012)
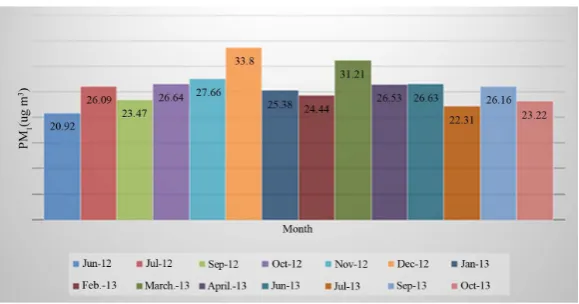
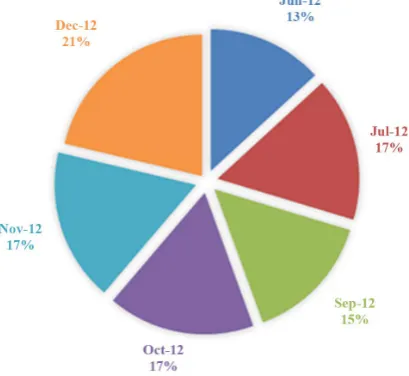
The monthly mean values of PM10, PM2.5, and PM1 in 2012-2013 are shown in Figure 5-7, and the month wise
percentage share of PM10 in 2012 is shown in a pie chart (Figure 8). The concentrations of PM10 are highest in
summer (June-July 23% and 24% respectively). The concentration decreases in September and October (14%) and reaches its minimum in November (10%). The monthly variability of PM2.5 (Figure 9) followed the same
trend except the relatively higher percentage which was registered in December (20%). On the other hand it is noticeable that the monthly variability of PM1 (Figure 10) reflected higher percentage in winter months,
Figure 2. Monthly variation of PM10 represented as pie chart (A.P).
Figure 3. Average monthly PM2.5 mass concentration during Feb. 2012-January
2013 (A.P).
[image:4.595.168.459.321.470.2] [image:4.595.167.461.502.708.2]Figure 5. Average monthly (King Fahd) PM10 mass concentration during June
[image:5.595.167.461.291.507.2]2012-October 2013 (A.P).
Figure 6. Average monthly (King Fahd) PM2.5 mass concentration during June
2012-October 2013.
Figure 7. Average monthly (King Fahd) PM1 mass concentration during June
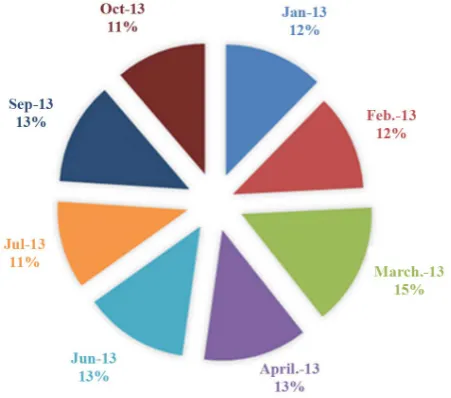
[image:5.595.169.459.543.695.2]Figure 8. Monthly variation of PM10 represented as pie chart (King Fahd 2012).
Figure 9. Monthly variation of PM2.5 represented as pie chart (King Fahd 2012).
[image:6.595.212.417.517.705.2]between PM10 on one hand and PM 2.5 and PM1.0 on the other hand, may suggests differences in source regions
for these aerosol sizes. The main anthropogenic source of PM2.5-1 in Riyadh urban environment can be confined
to vehicular traffic, fossil-fuel combustion, been observed within urban environments in other cities [20]-[22]. In addition, the boundary layer mixing height is lower in winter and traps the pollutants near the ground as a result of temperature inversions. This may explain the relatively higher concentration of small-sized particles (PM1.0)
in winter. In contrast, during summer months thermal heating at the surface and the increase of the mixing layer height favors buoyancy and the dilution of anthropogenic aerosols (PM1.0). Apart from desert dust, a natural
contribution to the total PM (mainly to PM2.5 and PM10) is also expected to originate from eolian and traffic-
driven re-suspension of dust, since the scarce rainfall favors the accumulation of road dust in summer.
3.1.3. King Fahd Station (2013)
The variation of monthly mean PM10 in 2013 showed more or less similar results to 2012 during month June,
July, September and October. Higher concentrations were observed during spring and summer (12%, 17% and 13% in Feb., March and April respectively and 17, 15% during June and July,). Starting from September and October PM10 concentrations started to drop to 7% and 8% respectively (Figure 11). Data of November and
December is expected to drop further as was demonstrated in 2012 at both KF and AP stations. As described above, a characteristic seasonal variation can be observed during 2013 with relatively elevated PM concentra-tions observed in the warmer seasons peaking in March, June and July (Figure 11). This is consistent with the earlier results at the airport station. Higher summertime PM concentrations can be attributed to elevated wind speed that enhances wind induced re-suspended PM concentrations. Wind speeds are higher in the summer. A somewhat similar pattern—if reduced in magnitude was observed during 2012
In contrast, the variation of monthly mean PM2.5 and PM1 concentrations vary less seasonally compared to
PM10 mass concentrations (Figure 12, Figure 13) This has been observed previously during 2012. This could be
due to the fact that a major source for PM2.5 and PM1 which is motor-vehicle emissions is not directly affected
by seasons. In contrast, secondary atmospheric formation of fine particles through photochemical processes is higher during the summer (relatively higher concentrations are observed from May–October). Stronger source strength in the summer however is counterbalanced by the lower mixing height in winter months thus reducing seasonal variability.
In general, the results of PM10, PM2.5, and, PM1 concentrations, obtained during the current work were little
higher than those found in other studies. Results obtained by studies of PM2.5 concentrations conducted in China
[23] reported a mean PM2.5 concentration of 67.6 µg/m3. Also [24] reported 89 µg/m3 during the spring. These
[image:7.595.196.433.493.705.2]values are little less than the values reported in this study. On the other hand, some other studies reported more or less similar results. For an example, PM10 concentrations higher than 3000 and produced by dust events were
Figure 12. Monthly variation of PM2.5 represented as pie chart (King Fahd 2013).
Figure 13. Monthly variation of PM1.0 represented as pie chart (King Fahd 2013).
observed in a study conducted in Iraq, Kuwait and Saudi Arabia [25]. In contrast, Meng and Lu [26] observed mean PM2.5 concentrations of up to 216.7 µg/m3, which was higher than the results presented in this study
(al-most double). The explanation for this substantial difference is that the PM2.5 is measured during winter months
where fossil fuel combustions which considered as the primary source of fine particulate are highest.
3.2. Frequency Distribution of PM10 and PM2.5 Concentrations
3.2.1. Airport
The frequency of occurrence for PM10 and PM2.5 concentrations for the studied period in A.P station showed that
4.5% of the PM10 values were more than 1000 μg·m−3 occurring all in spring. Approximately 9.5%, 9% and 16%
occurred at 500 - 1000, 340 - 500 and 200 - 340 μg·m−3 interval, respectively. A peak in the distribution of PM 10
concentrations occurred at 100 - 200 μg·m−3, (32%). The percentage of occurrence of values 50 - 100 μg·m−3 and less than 50 μg·m−3 were 19% and 9% respectively. PM
10 values <50 μg·m−3 is observed in winter months
(Table 1, Table 2).
Regarding the frequency distributions of PM2.5 in all seasons the largest frequency is observed for values
be-tween 35 and 100 μg·m−3, (52%), while in spring the largest frequency shifts towards higher values (100 - 600
μg·m−3, 18%. Similarly to PM10, spring presents a broader distribution for PM
[image:8.595.201.427.296.495.2]Table 1. Frequency of occurrence of PM10 concentrations (King Fahad).
Season PM10 concentration % Frequency
June-September 2012
>1000 2
500 - 1000 23
340 - 500 19
180 - 340 55
<180 0
October-January
>1000 1
500 - 1000 5
340 - 500 15
200 - 340 40
100 - 200 31
50 - 100 7
Feb-March
>1000 5
500 - 1000 17
340 - 500 18.5
200 - 340 47.5
100 - 200 12
50 - 100 0
June-October
>1000 3
500 - 1000 12
340 - 500 11
200 - 340 30
100 - 200 43
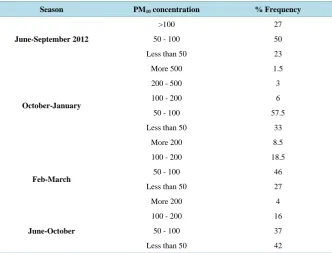
Table 2. Frequency of occurrence of PM2.5 concentrations (King Fahad).
Season PM10 concentration % Frequency
June-September 2012
>100 27
50 - 100 50
Less than 50 23
October-January
More 500 1.5
200 - 500 3
100 - 200 6
50 - 100 57.5
Less than 50 33
More 200 8.5
Feb-March
100 - 200 18.5
50 - 100 46
Less than 50 27
More 200 4
June-October
100 - 200 16
50 - 100 37
[image:9.595.150.483.468.721.2]values of the summer months. Peak concentrations occurred for values between 100 - 200 μg·m (43%), 15% of the values were above 500 μg·m−3
. Regarding the frequency distributions of PM2.5 in all seasons except June-
October, the largest frequency is observed for values between 50 and 100 μg·m−3, while in June-October the larg-est frequency shifts towards lower values (<50 μg·m−3), which is opposite to that observed for PM
10. However,
si-milarly to PM10, summer presents a broader distribution for PM2.5, with values > a 100 μg·m−3 range. Apart from
these similarities in the PM10 and PM2.5 frequency distributions, some differences in winter and summer reveal a
possible different source of aerosols in these seasons (natural or anthropogenic). For example, the intense dust storms during summer do not have such a pronounced signal in PM2.5 concentrations as in PM10 ones, while the
larger contribution of anthropogenic aerosols in winter rather increases the PM2.5 levels. Also note that the mean
PM2.5 in winter (32 μg·m−3) is similar to that of spring and larger than that of autumn, despite the fact that winter
PM10 is the lowest. However, it should be noted that dust events may also affect significantly the PM2.5 levels, as
observed during a severe dusty day in June (PM2.5 daily value of 182 μg·m−3) (Table 1, Table 2).
During this study period, we observed that PM10 and PM2.5 concentrations mainly depend on dust storms
oc-casions and increased significantly during dust storms; however, there is no universally accepted definition of dust storms in terms of hourly dust concentrations. Previous researchers have classified dust storms by their in-tensities on the basis of hourly mean PM10 concentrations together with wind speed and visibility. The
classifi-cation system proposed by Hoffmann et al., [27] is based on the hourly mean PM10 concentration in combination
with visibility and wind speed as follows: “dusty air” (haze) means hourly mean PM10 concentrations higher
than 50 μg·m−3; “light dust storm”, >200 μg·m−3; “dust storm”, >500 μg·m−3; “strong dust storm”, >2000 μg·m−3;
and “serious strong dust storm”, >5000 μg·m−3
.Wang et al. [28] used hourly mean PM10 concentrations of <200
μg·m−3 for “suspended dust,” 200 - 5500 μg·m−3 for “blowing dust,” 5500 - 15,000 μg–3
for “sand and dust storm”, and >15,000 μg−3 for “severe sand and dust storm”.
In Taiwan an Asian dust storm event is defined each day that hourly mean PM10 concentrations observed at
the Yangmingshan station exceed the air quality standard (125 μg·m−3
) for a period of at least 3 h [29]. Dust storms are defined in Korea when the measured PM10concentration exceeds 190 μg·m−3 for at least 2 h [30].
The KMA has developed an Asian Dust Warning System with alarm, advisory, and warning levels depending on the dust concentration. Alarms, advisories, and warnings are issued when the hourly mean dust concentrations (PM10) are expected to exceed 300 μg·m−3, 400 μg·m−3, or 800 μg·m−3, respectively, for over 2 h [30]. Park et al.
(2010) [31] identified dust events as the peak PM10 concentration exceeding one standard deviation of the an-nual mean concentration. We arbitrary choose this criterion. Our criterion for dust storm events was an hourly mean PM10 concentration exceeding one standard deviation of the mean concentration at the airport station
dur-ing February 2012 to January 2013 months (mean = 282.11.34 µg/m3 and standard deviation = 372). Based on this criterion, we identified 16, 21, 10, 6, 5, 6 and 1 dust events at February, March, April, May, June, July and December 2013. Based on the same criterion, we identified 8, 17, 7, 7, 3, and 6 dust events at June, July, Sep-tember, October, November and December 2012 and 14, 11, 20, 16, 7, 9, and 4 at January, February, March, June, July September and October 2013 respectively.
3.3. Influence of Meteorological Parameters on Particulate Matter
in governing the fate of air pollutants. During the monitoring period in the AP station, the hottest day of 2012 was July 17, with a high temperature of 47˚C. The longest warm spell was from July 14 to August 5, constitut-ing 23 consecutive days with warmer than average high temperatures. The month of May had the largest fraction of warmer than average days with 84% days with higher than average high temperatures.
The highest sustained wind speed was 15 m/s, occurring on February 2; the highest daily mean wind speed was 10 m/s (June 3); and the highest wind gust speed was 23 m/s (February 25). The windiest month was May, with an average wind speed of 4 m/s. The least windy month was October, with an average wind speed of 2 m/s. The average daily temperature in KF was found to be very similar to that of the AP. The relative humidity had also rather a low spatial variability (Correlation coefficients for temperature and relative humidity for these two sites was r = 0.899 and 0.974 respectively
The relationships between the mean values of suspended particle concentrations and meteorological variables (relative humidity and ambient temperature for these two locations and wind speed, temperature and relative humidity for KF station , were analyzed using Pearson’s correlation analysis, the analyses results are represented in Table 3 for the AP and Table 4 for KF.
The results indicated that, the PM10 and PM2.5 were strongly correlated with each other and inversely
corre-lated with temperature and relative humidity with correlation coefficient of −0.11 and −0.15 respectively at the AP station. The resulting t-value is not statistically significant at the 0.05 level. This may be due to the fact that means of the whole day of PM on one hand and the average temperature humidity on the other hand might can-cel the variation between night and day. In this regard, Shao [32], stated that the influence of weather factors upon repairable dust particulates is largely inconclusive. Never the less, several studies have confirmed the in-fluence of meteorological conditions on PM concentrations [33] [34]. Atmospheric pressure, wind velocity temperature and humidity were found to be significant factors in influencing PM.
On the other hand, at KF station a moderate positive correlation was observed between wind speed and PM (r = 0.48, 0.45 and 0.38 for PM10, PM2.5, and PM1 respectively) due to their suspension effect of wind. The best
cor-relation was observed with wind speeds and PM10 (r = 0.48). It seems that the wind has the potential to transport
particulates between areas around the studied site. Contrary to our results Oren [35], found that wind speed yielded negative correlation with PM10 but positive and statistically significant at 0.01 confidence level with
PM2.5-10. Wind speed plays a leading role in cleansing atmosphere of fine particulates compare to course. Wind
[image:11.595.145.489.465.556.2]speed affects the turbulence near the ground. The greater the wind speed, the greater the dispersion of particulates, the greater the dilution effects and transport of the particulate hence the lower the mass concentration [36].
Table 3. Correlation coefficient of particulate data and meteorological factors AP station.
PM10 PM2.5 TEMP RH Dew point
PM10 1.000
PM2.5 0.986** 1.00
TEMP −0.108 −0.105 1.00
RH −0.147 −0.090 −0.708 1.00
Dew point −0.398 −0.338 0.082 0.6454 1.00
[image:11.595.145.485.597.722.2]** Highly significant.
Table 4. Correlation coefficient of particulate data and meteorological factors KF station.
PM10 PM2.5 PM1 TEMP RH Wind speed Dew point
PM10 1.000
PM2.5 0.967 1.00
PM1 0.792 0.871 1.00
TEMP 0.074 −0.009 −0.0922 1.00
RH −0.127 −0.090 0.203 −0.772 1.00
Wind speed 0.479 0.453 0.380 0.182 −0.107 1.00
Figure 14. Concentrations of PM10 and PM2.5 at these two monitoring stations.
4. Conclusions
This study provides a valuable and complementary baseline data on PM. It is the first of its kind in which such data are collected in Riyadh city. However, Readers should be cautioned that the data presented in this report represent only one year of data (twelve months), and that patterns may vary and may not be conclusive at this stage. Since many studies have demonstrated a close relationship between particulate matter (PM) pollution and deterioration in human health, as such, there is a need for constantly monitoring the air quality and PM concen-trations throughout Riyadh city to find out if different areas meet national ambient air quality standards. These standards require to be reviewed every 5 years to make sure the standards protect human health and the envi-ronment. The standards must protect groups of people who are most at risk from the pollution.
1) The results show that the PM concentrations are considerably higher than the corresponding European Un-ion air quality annual standard.
2) PM2.5 data appear to be a constant fraction of the PM10 at all the sites, indicating common influences of
meteorology and sources.
3) Statistical analysis of air quality data shows that PM10 and PM2.5 are showing poor correlation with
tem-perature and relative humidity. Wind speed is moderately correlated with PM.
4) There are clear associations between PM10 and PM2.5 data sets throughout the study period.
Acknowledgements
This study was funded by the National Plan for Science, Technology and Innovation (MAARIFAH), King Ab-dulaziz City for Science and Technology, Kingdom of Saudi Arabia, Project #8 ENV319-02 under the title “Characteristics and Composition of the Falling Dust and Particulate Matter and Its Health Hazards in Riyadh City, Saudi Arabia”.
References
[1] EPA, D. (2009) Integrated Science Assessment for Particulate Matter. US Environmental Protection Agency, Wash-ington DC.
[2] Organization, W.H. (2004) International Statistical Classification of Diseases and Related Health Problems. World Health Organization, Geneva.
[3] Barry, R.G. and Chorley, R.J. (1992) Atmosphere, Weather, and Climate. 6th Edition, CUP Archive.
[4] Sudheer, A. and Rengarajan, R. (2012) Atmospheric Mineral Dust and Trace Metals over Urban Environment in West-ern India during Winter. Aerosol and Air Quality Research, 12, 923-933. http://dx.doi.org/10.4209/aaqr.2011.12.0237 [5] Al-Jeelani, H. (2009) Evaluation of Air Quality in the Holy Makkah during Hajj Season 1425 H. Journal of Applied
Sciences Research, 115-121.
[6] Othman, N., Jafri, M.Z.M. and San, L.H. (2010) Estimating Particulate Matter Concentration over Arid Region Using Satellite Remote Sensing: A Case Study in Makkah, Saudi Arabia. Modern Applied Science, 4, 131.
http://dx.doi.org/10.5539/mas.v4n11p131
[7] Habeebullah, M. (2013) An Investigation of the Effects of Meteorology on Air Pollution in Makkah. Assiut University bulletins Environmental Researches, 16, 64-85.
[8] Munir, S., Habeebullah, T.M., Seroji, A.R., Morsy, E.A., Mohammed, A.M., Saud, W.A., Abdou, A.E. and Awad, A.H. (2013) Modeling Particulate Matter Concentrations in Makkah, Applying a Statistical Modeling Approach. Aerosol and Air Quality Research, 13, 901-910. http://dx.doi.org/10.4209/aaqr.2012.11.0314
[9] El-Shobokshy, M.S. (1984) A Preliminary Analysis of the Inhalable Particulate Lead in the Ambient Atmosphere of the City of Riyadh, Saudi Arabia. Atmospheric Environment, 18, 2125-2130.
http://dx.doi.org/10.1016/0004-6981(84)90198-7
[10] El-Shobokshy, M. (1985) Atmospheric Lead Pollution in Area of Children’s School in the City of Riyadh. Proceedings of 78th APCA Annual Meeting, Detroit, 16-21 June 1985, Cobo Hall·Detroit APCA’85.
[11] El-Shobokshy, M., Al-Tamrah, S. and Hussein, F. (1990) Inhalable Particulates and Meteorological Characteristics of the City of Riyadh, Saudi Arabia. Atmospheric Environment, Part B: Urban Atmosphere, 24, 261-265.
http://dx.doi.org/10.1016/0957-1272(90)90031-O
[12] Rushdi, A.I., Al-Mutlaq, K.F., Al-Otaibi, M., El-Mubarak, A.H. and Simoneit, B.R. (2013) Air Quality and Elemental Enrichment Factors of Aerosol Particulate Matter in Riyadh City, Saudi Arabia. Arabian Journal of Geosciences, 6, 585-599. http://dx.doi.org/10.1007/s12517-011-0357-9
[13] Alharbi, B., Shareef, M.M. and Husain, T. (2015) Study of Chemical Characteristics of Particulate Matter Concentra-tions in Riyadh, Saudi Arabia. Atmospheric Pollution Research, 6, 88-98. http://dx.doi.org/10.5094/APR.2015.011 [14] Burkart, J., Steiner, G., Reischl, G., Moshammer, H., Neuberger, M. and Hitzenberger, R. (2010) Characterizing the
Performance of Two Optical Particle Counters (Grimm OPC1.108 and OPC1.109) under Urban Aerosol Conditions.
Journal of Aerosol Science, 41, 953-962. http://dx.doi.org/10.1016/j.jaerosci.2010.07.007
[15] Notaro, M., Alkolibi, F., Fadda, E. and Bakhrjy, F. (2013) Trajectory Analysis of Saudi Arabian Dust Storms. Journal of Geophysical Research: Atmospheres, 118, 6028-6043. http://dx.doi.org/10.1002/jgrd.50346
[16] Akyüz, M. and Çabuk, H. (2009) Meteorological Variations of PM2.5/PM10 Concentrations and Particle-Associated
[22] Pathak, B., Kalita, G., Bhuyan, K., Bhuyan, P. and Moorthy, K.K. (2010) Aerosol Temporal Characteristics and Its Impact on Shortwave Radiative Forcing at a Location in the Northeast of India. Journal of Geophysical Research: At-mospheres (1984-2012), 115.
[23] Ye, B., Ji, X., Yang, H., Yao, X., Chan, C.K., Cadle, S.H., Chan, T. and Mulawa, P.A. (2003) Concentration and Chemical Composition of PM2.5 in Shanghai for a 1-Year Period. Atmospheric Environment, 37, 499-510.
http://dx.doi.org/10.1016/S1352-2310(02)00918-4
[24] He, K., Yang, F., Ma, Y., Zhang, Q., Yao, X., Chan, C.K., Cadle, S., Chan, T. and Mulawa, P. (2001) The Characteris-tics of PM2.5 in Beijing, China. Atmospheric Environment, 35, 4959-4970.
http://dx.doi.org/10.1016/S1352-2310(01)00301-6
[25] Draxler, R.R., Gillette, D.A., Kirkpatrick, J.S. and Heller, J. (2001) Estimating PM10 Air Concentrations from Dust
Storms in Iraq, Kuwait and Saudi Arabia. Atmospheric Environment, 35, 4315-4330. http://dx.doi.org/10.1016/S1352-2310(01)00159-5
[26] Meng, Z. and Lu, B. (2007) Dust Events as a Risk Factor for Daily Hospitalization for Respiratory and Cardiovascular Diseases in Minqin, China. Atmospheric Environment, 41, 7048-7058.
http://dx.doi.org/10.1016/j.atmosenv.2007.05.006
[27] Hoffmann, C., Funk, R., Sommer, M. and Li, Y. (2008) Temporal Variations in PM10 and Particle Size Distribution
during Asian Dust Storms in Inner Mongolia. Atmospheric Environment, 42, 8422-8431. http://dx.doi.org/10.1016/j.atmosenv.2008.08.014
[28] Wang, Y., Zhuang, G., Tang, A., Zhang, W., Sun, Y., Wang, Z. and An, Z. (2007) The Evolution of Chemical Com-ponents of Aerosols at Five Monitoring Sites of China during Dust Storms. Atmospheric Environment, 41, 1091-1106. http://dx.doi.org/10.1016/j.atmosenv.2006.09.015
[29] Yang, C.-Y., Chen, Y.-S., Chiu, H.-F. and Goggins, W.B. (2005) Effects of Asian Dust Storm Events on Daily Stroke Admissions in Taipei, Taiwan. Environmental Research, 99, 79-84. http://dx.doi.org/10.1016/j.envres.2004.12.009 [30] Yong-Seung, C., Hak-Sung, K., Kie-Hyon, P., Jugder, D. and Tao, G. (2005) Observations of Dust-Storms in China,
Mongolia and Associated Dust Falls in Korea in Spring 2003. Water, Air, & Soil Pollution: Focus, 5, 15-35. http://dx.doi.org/10.1007/s11267-005-0724-1
[31] Park, S.-U., Park, M.-S., and Chun, Y. (2010) Asian Dust Events Observed by a 20-m Monitoring Tower in Mongolia during 2009. Atmospheric Environment, 44, 4964-4972. http://dx.doi.org/10.1016/j.atmosenv.2010.08.014
[32] Shao, Y. (2008) Physics and Modelling of Wind Erosion. Springer Science & Business Media, New York.
[33] Giri, D., Krishna Murthy, V. and Adhikary, P. (2007) The Influence of Meteorological Conditions on PM10
Concentra-tions in Kathmandu Valley.
[34] Yang, K.-L. (2002) Spatial and Seasonal Variation of PM10 Mass Concentrations in Taiwan. Atmospheric Environment,
36, 3403-3411. http://dx.doi.org/10.1016/S1352-2310(02)00312-6
[35] Oren, C.N. (2001) Clean Air and Interstate Transport: Seeing the Big Picture. The New York University Environmental Law Journal, 10, 196.
[36] Mkoma, S.L. and Mjemah, I.C. (2011) Influence of Meteorology on Ambient Air Quality in Morogoro, Tanzania. In-ternational Journal of Environmental Sciences, 1, 1107-1115.
http://dx.doi.org/10.1016/j.atmosenv.2008.08.016
[38] Bae, G.-N., Lee, S.-B. and Park, S.-M. (2007) Vehicle-Related Fine Particulate Air Pollution in Seoul, Korea. Asian Journal of Atmospheric Environment, 1, 1-8. http://dx.doi.org/10.5572/ajae.2007.1.1.001
[39] Kim, K.-H., Pandey, S.K., Nguyen, H.T., Chung, S.-Y., Cho, S.-J., Kim, M.-Y., Oh, J.-M. and Sunwoo, Y. (2010) Long-Term Behavior of Particulate Matters at Urban Roadside and Background Locations in Seoul, Korea. Transpor-tation Research Part D: Transport and Environment, 15, 168-174. http://dx.doi.org/10.1016/j.trd.2009.12.001
[40] Artınano, B., Salvador, P., Alonso, D., Querol, X. and Alastuey, A. (2004) Influence of Traffic on the PM10 and PM2.5