Crowd Management using Viola Jones Algorithm and
Heuristic Data Mining
Ajit Naik
Divyesh Darde
Shraddha Chitalia
Vidya Zope
Computer Dept.,V.E.S. Institute of Technology, Chembur, Mumbai-74
ABSTRACT
Image processing techniques like face detection play a significant role in counting the number of people present at any given location which is under surveillance of a camera or any face detection system. This data collected can be processed and analyzed to deduce important findings. Data Mining plays a major role in analysis of this data and production of important statistics. Based on these statistics important decisions are made. This paper proposes one such system that uses Viola Jones face detection algorithm to keep a count of number of visitors at railway station throughout the day and heuristic data mining technique to analyze this stored data and suggest the required action.
General Terms
Data Mining, Face detectionKeywords
Viola Jones Algorithm, Crowd Management, Local Trains, Train Management
1.
INTRODUCTION
Today, in most of the metropolitan cities the count of the people using public transport is rising drastically. Especially in big cities like Mumbai, Delhi, Chennai, Kolkata, and Hyderabad the number of people travelling by local trains has increased and trains are over-crowded. This brings in a lot of inconvenience to the public. [1] Also, people have to travel standing for long distances as well as it creates problems for school and college children travelling by trains. The existing frequency of trains is inadequate for the number of people who depend on it. Hence the frequency of trains or even their capacity needs to be augmented. But the frequency of trains, their capacity and the number of people, all differ with time. So, the problem is to recognize which time slots of the day need the change the most.
The solution to this is to identify the stations and the specific timings during the day when these stations are overcrowded. This can be achieved by using face detection devices. These devices make use of image processing face detection algorithms. This provides a count of the number of people visiting the stations plus the number of people travelling in the trains at any given time of the day. Having this data collected and stored in the database, data mining techniques can help us deduce the statistics. Analysis of these statistics can be used to avoid the above stated problem by
1. Increasing the frequency of trains during peak hours.
2. Having at least one train especially for women and children during the peak hours.
3. Having starter trains from the stations during the time of the day when these stations are overcrowded.
4. Running trains with 12-15 compartments during rush hours.
5. Also, bus service can be made available during these hours between those areas where the trains seem to be extremely crowded.
This would help reduce the rush in the trains and on platforms and thus would enhance the quality of government service provided to the public. It would bring in convenience for women and children too.
To demonstrate our proposed system, we are considering the Mumbai Suburban Railway Spread over 465 km, the suburban railway operates 2342 train services and carries more than 7.24 million commuters daily. It has some of the most severe overcrowding in the world.
1.1
Proposed System
The proposed solution requires creation of a system which works in three phases:
1.1.1
Face detection:
Detection of faces would allow keeping a count of the number of people who visit the station. This will be done using Image processing. The Image Processing algorithm which can be used is Viola Jones face detection algorithm.
1.1.2
Data Storage:
The data would be collected at an interval of five minutes. This raw data would be stored in a local database. At the end of half hour duration, the data specific to each station would be averaged and stored in the central database. This data can now me mined and used to generate statistics which can be further used for analysis.
1.1.3
Analysis and Deduction:
First of all a threshold value is calculated. The processed average count referred to as Actual crowd is mined from the central database and compared to this threshold value. This comparison either results in a surplus or a deficit.
1.1.4
Action:
Figure 1: Block Diagram of the Proposed System
2.
FACE DETECTION
[2]The number of people waiting for a train on a platform at a railway station can be calculated by first detecting their faces, and then counting the number of faces detected. Apart from detecting faces from the front side, the requirements for our
face detection algorithm will be: [3] 1) Detection of faces from sideways.
2) Detection of faces even when they are not visible properly, or are in darker areas of the station.
3) Faces should be detected irrespective of the complexion of the face. [4]
2.1 Viola Jones face detection algorithm:
One such popular algorithm which can be used is the Viola Jones face detection algorithm. This algorithm has three maincontributions for face detection:
1. It makes use of integral images. Integral images allow the faces to be detected quickly. [5] Integral images are constructed by making use of Haar wavelets.
2. It makes use of AdaBoost, which boosts certain intensities in an image for better feature selection.
3. The third feature of this algorithm is that it provides Attentional Cascade for fast rejection of non-face windows. This provides better user interface. [6]
2.2 Program implementation of Viola Jones
face detection algorithm:
This algorithm can be implemented in Matlab for detection of faces. For this, the Computer vision system toolbox is required.
This toolbox contains a vision.CascadeObjectDetector system object, which detects objects based on this algorithm. The steps for implementing this algorithm are as follows.
1. Make an object using the vision.CascadeObjectDetector in order to detect faces using it.
2. Read the input image
Now the image will be displayed, and a bounding box will also be returned by the step function.
[image:3.595.55.283.120.300.2]Output:
Figure 2: Sample Output of the above algorithm
BB =
52 38 73 73 379 84 71 71 198 57 72 72
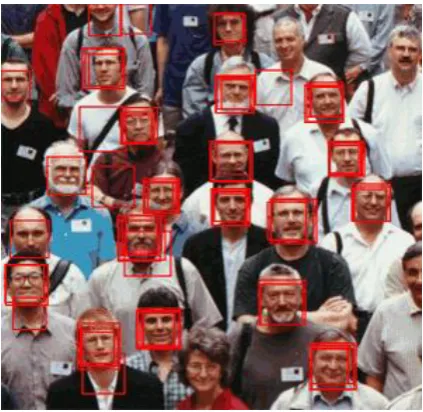
Now by counting the number of rows in BB, we will get the number of people in a picture. This value would then go into the ‘No. of. People’ field in our database. As applied to the image above, this algorithm can also be applied to a large crowd of people, getting output as shown in the image. Thus we will get the number of people from this algorithm.
Figure 3. Sample Output for large crowd of people Further, this algorithm can be embedded on the server side of the CCTVs, and the output which is received will be transferred to the local database table.
3.
DATA MINING
Dara mining is basically extracting data from the past information and making decisions based on the knowledge gained. [7] Here, we are going to extract data about the crowd density at different times and thus will take decision whether to introduce new trains or not at that particular time. In a survey conducted by Mumbai Rail Vikas Corporation (MRVC), it was found that Thane, C.S.T, Kurla, Kalyan and Dadar are the most crowded stations. [8] So in our project, we will consider these 5 stations. Reduction in crowd at these stations will ensure lesser crowd at other stations as well.
There are 6 CCTV cameras on each platform. Images from each camera would be used to count total number of people on the platform at specific time intervals.
3.1 Structure of Database:
We will be making use of distributed databases concept. There will be a local database at select stations, and a central database at a single center. [9] There will be two types of database:
3.1.1
Local database:
This database will be present at select railway stations. At these select railway stations, the images captured by the CCTV cameras would be stored in this database. Then after processing the image for detection of number of people, the calculated result would be stored as shown below:
Table 1. Record in the local database
A direction of ‘Up’ means the train is going towards main city of Mumbai. While a direction of ‘Down’ means that the train is going towards the suburbs. [10]
An image would be clicked every 5 minutes. In central railway, there are two platforms for trains going in a single direction. One is for fast train and other for slow. So, the number of people going in one direction would be equal to the number of people detected by the CCTV cameras on these 2 platforms.
[image:3.595.55.267.478.684.2]Aggregation (Roll-up) Actual No. of people in one direction: Sum of No. of people
going in that direction / 12.
For the example in table 1,
Actual No. of people towards C.S.T =
(507+672+548+437+521+476+566+500+321+554+333+576) /12= 500.91 501
3.1.2
Central database:
[image:4.595.307.551.73.350.2]The central database will store the records sent by the local database. The record will be as shown:
Table 2. A Record in the central database
Date Station Name
Time range
Train Direction
No. of people
12-10-2013 Kurla 7.00-7.30 Up 501
As illustrated above, data will be collected in terms of 30 minute intervals throughout the day. Now, it might happen that the crowd would be more on special occasions like festivals, special occasions, etc. So to reduce the effects of such hikes in the number of people, we will derive results by performing calculations on data of whole month.
We can also find the crowd behavior as per the day of the week. E.g. if by analyzing the data for one month, it is found that the crowd is less on Saturday as compared to other days of week , we can reduce the frequency of trains running on Saturday.
3.2
Algorithm
1. Apply aggregate functions on the database with respect to the station name, train direction and time range.
2. After aggregation, the total number of people over the entire month is obtained. This many number of people are divided by 30 (Number of days in a month). This will give the average crowd at a particular station for a train in specific direction in a specific time interval. It is denoted as AC (Actual Crowd).
3. The AC is then compared with a ‘threshold’ value.
If (AC > threshold)
Then (Surplus = AC – threshold) Else
Deficit=threshold – AC
Surplus=No. of people greater than the train capacity
Deficit=No. of people in trains which are sparsely occupied.
4. Similarly, the Surplus or Deficit are calculated for all the time intervals. These surplus or deficit is then compared with the threshold surplus and deficit values.
If (Surplus > Threshold (surplus))
Then (frequency should be increased) If (Deficit > Threshold (deficit))
Then (frequency can be decreased)
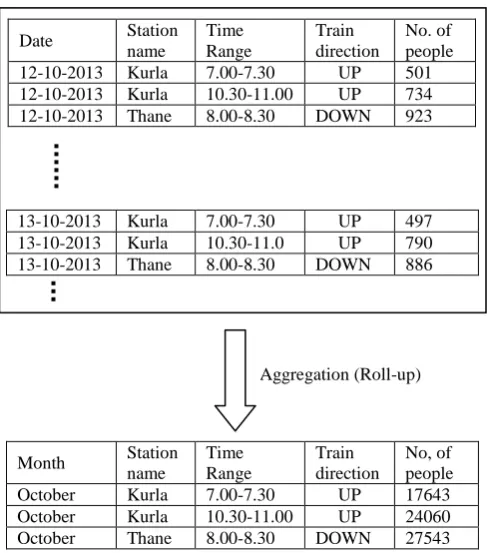
Date Station name Time Range Train direction No. of people 12-10-2013 Kurla 7.00-7.30 UP 501 12-10-2013 Kurla 10.30-11.00 UP 734 12-10-2013 Thane 8.00-8.30 DOWN 923
13-10-2013 Kurla 7.00-7.30 UP 497 13-10-2013 Kurla 10.30-11.0 UP 790 13-10-2013 Thane 8.00-8.30 DOWN 886
Month Station name Time Range Train direction No, of people
October Kurla 7.00-7.30 UP 17643
October Kurla 10.30-11.00 UP 24060 October Thane 8.00-8.30 DOWN 27543
Figure 4. Performing Roll-up for monthly view
Actual crowd at Kurla (Time-Range: 10.30-11.00, Train direction: UP) = 24060/30 = 802
Now, if 802 > Threshold
Surplus = 802- Threshold
Now, if Surplus > Threshold (surplus)
Then frequency of trains during the time interval 10.30-11.00 must be increased.
4.
CONCLUSION& FUTURE SCOPE
4.1 Conclusions
The suburban trains are indeed the lifeline of metropolis in India, especially Mumbai. Hence, unsurprisingly, these trains are over-crowded especially during certain peak hours. Through this paper, a method to identify these peak hours has been proposed. The number of people present at the station at certain time can be calculated by using face detection techniques. Based on the data collected, using the data mining algorithm mentioned in this paper, and based on certain threshold limits of crowd, the requirement of additional trains during certain time intervals can be determined.
Thus by identifying the time slots which require increase in carrying capacity, those time slots can be concentrated upon for improvement. Possible solutions are increasing the frequency of trains in that time slot, or increasing the number of train boogies, or even extending the destinations of certain trains as per requirement.
4.2 Future Scope
visit the station for some other purpose, like for boarding a long distance train, or sending-off their relatives, etc. So, although installing cameras in the railway station platform is cost-effective, but at the same time it doesn’t measure the number of people perfectly.
One future solution possible to this problem is installing cameras in the train boogie. This would perfectly count the number of people in a particular train, and thus provide accurate results. But the setback of this method is that a large number of cameras will have to be installed; at least 3 cameras per boogie of a train. That will be about 40 cameras for a single train. Installing so many cameras in every train, is not at all cost effective. Instead, installing 6 cameras to cover the entire platform seems more sensible.
5.
REFERENCES
[1] Zhan, Beibei, et al. "Crowd analysis: a survey." Machine Vision and Applications 19.5-6 (2008): 345-357.
[2] Lovell, Brian C., Shaokang Chen, and Ting Shan. "Real-Time Face Detection and Classification for ICCTV." (2009): 1659-1666.
[3] Davies A C, Yin J H, Velastin S A, et al. “Crowd Monitoring Using Image Processing”. IEE Electronics and Communication Engineering Journal, Vol.7, no.1, pp.37-47, 1995.
[4] Jones, Michael, and Paul Viola. "Fast multi-view face detection." Mitsubishi Electric Research Lab TR-20003-96 3 (2003): 14
[5] Viola, Paul, Michael J. Jones, and Daniel Snow. "Detecting pedestrians using patterns of motion and appearance." International Journal of Computer Vision63.2 (2005): 153-161.
[6] Viola, Paul, and Michael Jones. "Rapid object detection using a boosted cascade of simple features." Computer Vision and Pattern Recognition, 2001. CVPR 2001. Proceedings of the 2001 IEEE Computer Society Conference on. Vol. 1. IEEE, 2001.
[7] Ham Kamber data mining book: Han, Jiawei, MichelineKamber, and Jian Pei. Data mining: concepts and techniques. Morgan kaufmann, 2006.
[8] Article from “The Times of India” dated May 19, 2013 on the crowd at different railway stations in Mumbai
Suburban network:
http://articles.timesofindia.indiatimes.com/2013-05- 19/mumbai/39369149_1_passengers-mumbai-rail-vikas-corporation-harbour-line: This is the official website for E-paper of ‘The Times of India’ is a leading newspaper in India.
[9] Park, Byung-Hoon, and Hillol Kargupta. "Distributed data mining: Algorithms, systems, and applications." (2002).