Comparison of Various Feature Extraction Techniques in
CBIR using Statistical Parameters
H.B.Kekre,
Ph.D Senior Professor, Computer Engineering Department, MPSTME, SVKM’s NMIMS (Deemed-to-be University), Mumbai, IndiaAditi Mehta
M.Tech Student, Computer Engineering Department, MPSTME, SVKM’s NMIMS
(Deemed-to-be University), Mumbai, India
Paulami shah
Assistant Professor, Computer Engineering Department, MPSTME, SVKM’s NMIMS (Deemed-to-be University), Mumbai, India
ABSTRACT
In fields such as medical, art galleries, museums, archaeology, medical imaging, trademark databases, criminal investigations, images especially the digital images grow in quantities of thousands and sometimes even lakhs every year. Content based image retrieval is required from such large databases. This paper compares Statistical Parameters based CBIR techniques based on the performance evaluation parameters namely, precision, recall, LIRS and LSRR. Minkowski Distance is used for the purpose of similarity measure.
Keywords
Content Based Image Retrieval(CBIR); Standard Deviation(SD); Precision; Recall; Length of Initial Relevant String of images(LIRS); Length of String required to Recover Relevant Images (LSRR), Minkowaski Distance (MD), Feature Vector(FV).
1.
INTRODUCTION
The very large numbers of images are being generated from a variety of sources (digital camera, digital video, scanner, the internet etc.) which have posed technical challenges to computer systems to store/transmit and index/manage image data effectively to make such collections easily accessible. Image compression deals with the challenge of storage and transmission, where significant advancements have been made [1,4,5]. The challenge to image indexing is studied in the context of image database [2,6,7], which has become one of the promising and important research area for researchers from a wide range of disciplines like computer vision, image processing , image database and recognition systems.
The thirst of better and faster image retrieval techniques is increasing day by day. The ambiguity in text based retrieval emphasizes the need of a better and faster retrieval system. That is why CBIR becomes more important. Some of important applications for CBIR technology could be identified as art galleries, museums, archaeology [3], architecture design [8,13], geographic information systems[5], weather forecast [5], medical imaging [5], trademark databases, criminal investigations, image search on the Internet.
The Paper is organised as follows: Chapter 2 gives the introduction about CBIR, its birth and the basic concept.
Chapter 3 explains the CBIR methods. Chapter 4 explains the implementation; i.e. the database used and the performance evaluation parameters. Finally Chapter 5 gives the conclusion.
2.
CONTENT BASED IMAGE
RETRIEVAL
In literature the term content based image retrieval (CBIR) has been used for the first time by Kato et.al. [4], to describe his experiments into automatic retrieval of images from a database by colour and shape feature. The typical CBIR system performs two major tasks. The first one is extraction of feature vector which consists of various feature components. It is generated to represent the content of each image in the database with accuracy and uniqueness. The second task is similarity measurement (SM), where a distance between the feature vector of the query image and the feature vector of each image in the database is measured, compared and this is used to retrieve the top “closest” images.
For feature extraction in CBIR there are mainly two approaches [5] feature extraction in spatial domain and feature extraction in transform domain. The feature extraction in spatial domain includes the CBIR techniques based on histograms [5], BTC [1,2]. The transform domain methods are widely used to extract image features. Many current CBIR systems use Euclidean distance [1-3] on the extracted feature set as a similarity measure. The Minkowaski Distance between image X and query image Y can be given as equation 1, where Xi and Yi are the feature vectors of image X and Query image Y respectively with size ‘N’.
(1) Where: r=1,2,3,….N; j=no. of elements in the FV.
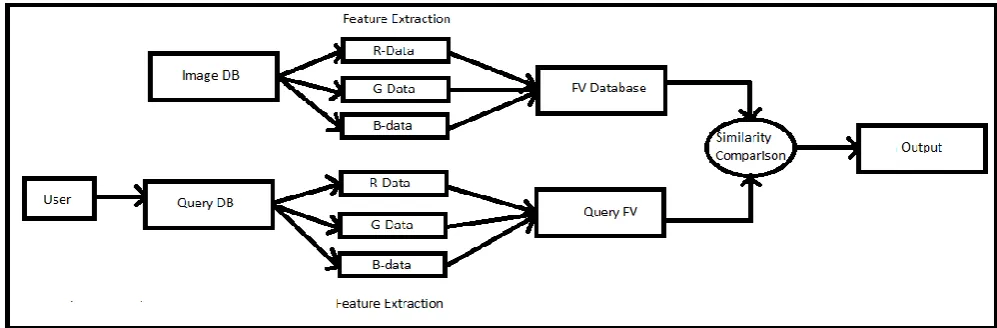
Figure 1: CBIR System
In a typical content-based image retrieval system as shown in figure above, the visual contents of the images in the database are extracted and described by feature vectors. The feature vectors of the images in the database form a feature database. To retrieve images, users provide the retrieval system with example images. The system then changes these examples into its internal representation of feature vectors. The similarities /distances between the feature vectors of the query example and those of the images in the database are then calculated and retrieval is performed. This provides an efficient way to search for the image database. Recent retrieval systems have also began with taking the feedback from users for making further improvements in the retrieval results.
3.
COMPARISON OF TECHNIQUES
Various CBIR systems were implemented and all of these systems discuss different techniques of feature vector generation. All of these techniques are discussed briefly in this section.
The techniques use the concept of moments. The general formula for Rth centralized moment is:
(2)
Where NXN is the size of the image, r=1,2,3,4,…∞, xij are the pixel values.
(3)
Where
is the mean of the image.
3.1
Mean of Image
This is when r=1. In this method, Feature Vector is generated by calculating mean of all pixels in the image matrix for all three planes i.e. R,G,B respectively.
3.2
Standard Deviation of Image (SD) [11]
This is when r=2. In this method, Feature Vector is generated by calculating standard deviation of all pixels in the image matrix for all three planes i.e. R,G,B respectively.
(4)
3.3
Skewness of Image
This is when r=3. In this method, Feature Vector is generated by calculating skewness of all pixels in image matrix for all three planes i.e. R,G,B respectively.
(5)
3.4
Kurtosis of Image
This is when r=4. In this method, Feature Vector is generated by calculating Kurtosis of all pixels in image matrix for all three planes i.e. R,G,B respectively.
(6)
3.5
Mean and Standard Deviation of Image
In this method, Feature Vector is generated by calculating mean and standard deviation of all pixels in the image matrix for all three planes i.e. R,G,B respectively.
3.6
Mean and Skewness of Image
In this method, Feature Vector is generated by calculating mean and skewness of all pixels in the image matrix for all three planes i.e. R,G,B respectively.
3.7
Mean and Kurtosis of Image
In this method, Feature Vector is generated by calculating mean and kurtosis of all pixels in the image matrix for all three planes i.e. R,G,B respectively. .
3.8
Standard Deviation and Skewness of
Image
In this method, Feature Vector is generated by calculating standard deviation and skewness of all pixels in the image matrix for all three planes i.e. R,G,B respectively.
3.9
Standard Deviation and Kurtosis of
Image
3.10
Skewness and Kurtosis of Image
In this method, Feature Vector is generated by calculating skewness and kurtosis of all pixels in the image matrix for all three planes i.e. R,G,B respectively.
3.11
Mean,
Standard
Deviation
and
Skewness of Image
In this method, Feature Vector is generated by calculating mean ,standard deviation and skewness of all pixels in the image matrix for all three planes i.e. R,G,B respectively.
3.12
Mean,
Standard
Deviation
and
Kurtosis of Image
In this method, Feature Vector is generated by calculating mean, standard deviation and kurtosis of all pixels in the image matrix for all three planes i.e. R,G,B respectively.
3.13 Mean, Skewness and Kurtosis of Image
In this method, Feature Vector is generated by calculating mean, skewness and kurtosis of all pixels in the image matrix for all three planes i.e. R,G,B respectively.
3.14
Standard Deviation, Skewness and
Kurtosis of Image
In this method, Feature Vector is generated by calculating standard deviation, skewness and kurtosis of all pixels in the image matrix for all three planes i.e. R,G,B respectively.
3.15
Mean, Standard Deviation, Skewness
and Kurtosis of Image
In this method, Feature Vector is generated by calculating mean, standard deviation, skewness and kurtosis of all pixels in the image matrix for all three planes i.e. R,G,B respectively.
The similarity measures used for all the methods above (3.1-3.15) are ED, AD, M3 and M4.
4.
IMPLEMENTATION
4.1
Database
The CBIR techniques (3.1-3.15) are tested on a single image database, i.e. Generic Image Database which contains 1000 images spread across 10 categories of human being, Flowers, Tribal, Elephant, Scenery, animals, natural scenery and other manmade things. There are 100 images for each category.
4.2
Performance Evaluation Parameters
To assess the retrieval effectiveness, precision, recall, and LIRS are used as statistical comparison parameters for the
proposed CBIR techniques. The standard definitions for these measures are given by following equations.[9-13]
Precision =
(7)
Recall =
(8)
LIRS =
(9)
LSRR =
(10)
Figure 2 compares the precision/recall values of the techniques (3.1-3.15). It is seen that best value of precision/recall is given by (Mean,SD,Skew Kurto using AD) followed by (Mean,SD) & (Mean,SD,Skew). Also, the term Crossover Point is the spot where precision equals to recall; i.e the total number of images retrieved is equal to the total number of relevant images retrieved. Thus, higher the value of this point, better is the method and a value of zero indicates extremely poor performance since no images that are retrieved are relevant. From the graph, the most prominent observation one can make is that the best results are given by the methods where mean is considered. In the single methods; Mean gives the best result; in the any two, three or four methods combined i.e. section 3.5-3.15; Mean in combination with SD,Skew and Kurto gives the best result. And the rest of the combinations which do not have mean; perform failrly lesser.
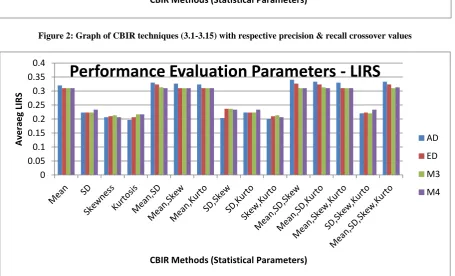
Figure 3 compares the LIRS values of the techniques (3.1-3.15). It is seen that best value of LIRS is given by (Mean,SD,Skew,Kurto using AD) , (Mean,Skew,Kurto) (Mean,SD,Kurto) followed by (Mean,SD). Similarly here, as mentioned above, The methods which have mean as a stand alone or in combination with any one, some or all of the other three give a higher value of LIRS against those which do not have mean in the combination.
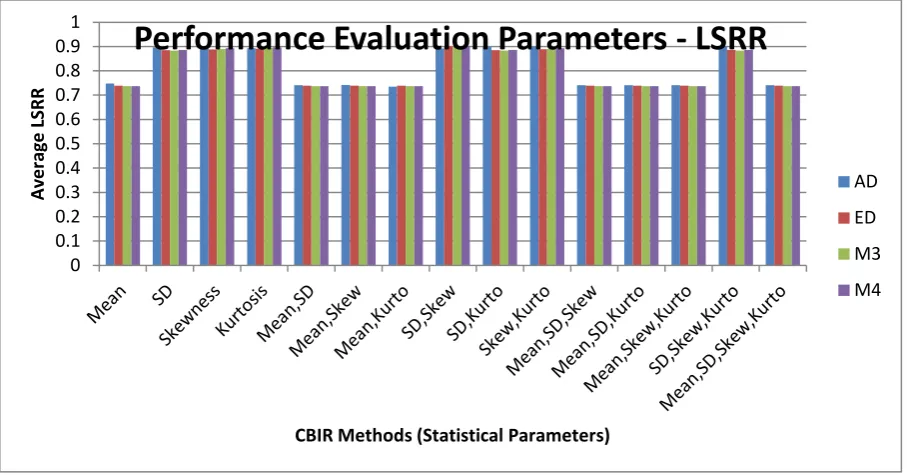
Figure 4 compares the LSRR values of the techniques (3.1-3.15). It is seen that best value of LSRR is given by (Mean,Kurto using AD) followed by (Mean,SD,Skew), (Mean,SD,Kurto) & (Mean,SD,Skew,Kurto). Similarly here, as mentioned above, The methods which have mean as a stand alone or in combination with any one, some or all of the other three give a lesser value of LSRR against those which do not have mean in the combination; since lesser the value of LSRR better is the performance of the method.
Figure 2: Graph of CBIR techniques (3.1-3.15) with respective precision & recall crossover values
Figure 3: Graph of CBIR techniques (3.1-3.15) with respective LIRSvalues
0 0.05 0.1 0.15 0.2 0.25 0.3 0.35 0.4
A
ve
rag
e
C
ro
ssover
Po
in
t
o
f Pr
e
ci
si
o
n
/R
e
cal
l
CBIR Methods (Statistical Parameters)
Performance Evaluation Parameters - Average Crossover
Point Of Precision/Recall
AD
ED
M3
M4
0 0.05 0.1 0.15 0.2 0.25 0.3 0.35 0.4
A
ve
rae
g LIRS
CBIR Methods (Statistical Parameters)
Performance Evaluation Parameters - LIRS
AD
ED
M3
Figure 4: Graph of CBIR techniques (3.1-3.15) with respective LSRR Value
5.
CONCLUSION
Study says that higher the value of LIRS and lower the value of LSRR, better is the performance of the CBIR method. And, from the graphs above (figure 2, figure 3 and figure 4), a remarkable co-relation can be found between Precision/Recall and LIRS/LSRR i.e. Methods with a high crossover value of Precision/Recall also have a high value of LIRS and a corresponding low value of LSRR (from above graphs, (Mean, SD, Skew, Kurto using AD)) and those with low crossover values of Precision/Recall have respective low value of LIRS and corresponding high value of LSRR (from above graphs,(SD,Skew using AD)).Thus, from all of the graphs above it can be stated that the best performance is given by the Mean method since the better results are given by the methods which have mean (3.1,3.5,3.6,3.7,3.11,3.12,3.13 and 3.15) than the remaining methods(those which do not have mean).
6.
REFERENCES
[ 1] H.B.Kekre, Sudeep D. Thepade, “Boosting Block Truncation CodingusingKekre’s LUV Color Space for Image Retrieval”, WASET International Journal of Electrical, Computer and System Engineering (IJECSE), Volume 2, Number 3, pp. 172-180, Summer 2008. [ 2] H.B.Kekre, Sudeep D. Thepade, “Image Retrieval using
Augmented Block Truncation Coding Techniques”, ACM International Conference on Advances in Computing, Communication and Control (ICAC3-2009), pp. 384-390, 23-24 Jan 2009, Fr. ConceicaoRodrigousCollegeofEngg., Mumbai. Is uploaded on online ACM portal.
[ 3] H.B.Kekre, Sudeep D. Thepade, “Scaling Invariant Fusion of Image Pieces in Panorama Making and Novel Image Blending Technique”,International Journal on Imaging (IJI), www.ceser.res.in/iji.html,Volume 1, No. A08, pp. 31-46, Autumn 2008.
[ 4] Hirata K. and Kato T. “Query by visual example – content-based image retrieval”, In Proc. of Third
International Conference on H Extending Database Technology, EDBT’92, 1992, pp 56-71
[ 5] H.B.Kekre, Sudeep D. Thepade, “Rendering Futuristic Image RetrievalSystem”, National Conference on Enhancements in Computer,Communication and Information Technology, EC2IT-2009, 20-21 Mar2009, K.J.Somaiya College of Engineering, Vidyavihar, Mumbai-77
[ 6] Minh N. Do, Martin Vetterli, “Wavelet-Based Texture Retrieval Using Generalized Gaussian Density and Kullback-Leibler Distance”, IEEE Transactions On Image Processing, Volume 11, Number 2, pp.146-158, February 2002.
[ 7] B.G.Prasad, K.K. Biswas, and S. K. Gupta, “Region – based image retrieval using integrated color, shape, and location index”, International Journal on Computer Vision and Image Understanding Special Issue: Colour for Image Indexing and Retrieval, Volume 94, Issues 1-3, April- June 2004, pp.193-233.
[ 8] Dr.H.B.Kekre, Dr.Dhirendra Mishra, “ DCT Sectorization for Feature Vector Generation in CBIR”,International Journal of Computer Applications (IJCA) Vol.9(1) November 2010, ISSN 0975–8887
available online at
http://www.ijcaonline.org/volume9/number1/pxc387182 0.pdf
[ 9] Dr.H.B.Kekre, Dr.Dhirendra Mishra, “DCT-DST Plane sectorization of Row-wise Transformed color Images in CBIR”,International Journal of Engineering Science and Technology (IJEST) Vol.2(12) 2010, ISSN 7234-7244available online at http://nmims.edu/wp- content/uploads/2012/p3/MPSTME/Direndra,DCT-DSTPlanesectorization.pdf
[ 10]Dr.H.B.Kekre, Dhirendra Mishra, “ Density distribution in WalshTransform sectors as feature vectors for image retrieval”, published in international journal of compute applications (IJCA) Vol.4(6) 2010, 30-36 ISSN 0975-8887 available online at 0
0.1 0.2 0.3 0.4 0.5 0.6 0.7 0.8 0.9 1
A
ve
rag
e
LSRR
CBIR Methods (Statistical Parameters)
Performance Evaluation Parameters - LSRR
AD
ED
M3
http://www.ijcaonline.org/archives/volume4/number6/82 9-1072
[ 11]Dr.H.B.Kekre, SudeepDThepade, AkshayMaloo, “Query by Image Content Using Colour Averaging Techniques”, International Journal of Engineering Science and Technology (IJEST), Volume 2, Issue 6, 2010.pp.1612-1622 (ISSN: 0975-5462) Available online at http://www.ijest.info
[ 12]Dr.H.B.Kekre, SudeepDThepade, AkshayMaloo, “Image Retrieval using Fractional Coefficients of Transformed
Image using DCT and Walsh Transform”, International Journal of Engineering Science and Technology (IJEST), Volume 2, Issue 4, 2010.pp.362-371 (ISSN: 0975-5462) Available online at http://www.ijest.info