BIROn - Birkbeck Institutional Research Online
Alessandri, P. and Bottero, M. (2017) Bank lending in uncertain times.
Working Paper. Birkbeck, University of London, London, UK.
Downloaded from:
Usage Guidelines:
Please refer to usage guidelines at or alternatively
ISSN 1745-8587
BCAM 1703
Bank lending in uncertain times
Piergiorgio Alessandri
Banca d’Italia
Margherita Bottero
Banca d’Italia
February 2017
Birkb
eck
C
e
ntre fo
r
Ap
plie
d
Mac
roecono
Bank lending in uncertain times
Piergiorgio Alessandri
Margherita Bottero
yDecember 5, 2016
Abstract
We study the impact of economic uncertainty on the supply of bank credit using a monthly dataset that includes all loan applications submitted by a sample of 650,000 Italian …rms between 2003 and 2012. We …nd that an increase in aggregate uncertainty has three e¤ects. First, it reduces banks’ likelihood to accept new credit applications. Second, it lengthens the time …rms have to wait for their loans to be released. Third, it makes banks less responsive to ‡uctuations in short-term interest rates, weakening the bank lending channel of monetary policy. The in‡uence of uncertainty is relatively stronger for poorly capitalized lenders and geographically distant borrowers.
Keywords: uncertainty, credit supply, bank lending channel, loan applications. JEL classi…cation: E51, G21.
Banca d’Italia, [email protected].
yBanca d’Italia, [email protected].
1
Introduction
Economic crises generate uncertainty but they also feed on it. As the prolonged recessions that followed the …nancial crises of 2008-2012 demonstrate, economic volatility brings about a widespread reluctance to borrow, lend and invest that can signi…cantly slow down the recovery.1 The relation between uncertainty, credit and investment is complex because uncertainty can act through both the demand and the supply side of credit markets. If their choices are irreversible, …rms may choose to invest and borrow less when uncertainty is high (Bernanke, 1983; Bloom, 2009; Bloom et al., 2012). Yet creditors face the same problem: corporate loans – their own investments –are risky and irreversible too, and they clearly become less attractive when …rms’ prospects grow more uncertain (Arellano et al., 2012; Christiano et al., 2014; Gilchrist et al., 2014). This raises a natural question: is the slow-down in bank lending observed in ‘uncertain times’a pure by-product of the …rms’own choices, or does it also reveal a …nancial acceleration e¤ect, as increasingly hesitant lenders force …rms to borrow less than they would like to? If this is the case, which …rms end up bearing the costs of such a shift in banks’lending strategies?
In this article we answer these questions by exploiting the microeconomic data available from the Credit Register of the Bank of Italy. We construct a loan-level dataset that tracks at a monthly frequency the outcome of all new loan applications submitted by a sample of 650,000 non…nancial …rms between 2003 and 2012 and combine it with bank and …rm balance sheet data. We then examine the impact of various measures of aggregate uncertainty on (i) the probability that …rms’applications get approved and (ii) the time …rms have to wait to receive their loans conditional on being successful. Approval probabilities are a measure of the extensive margin of credit supply that has been widely exploited in the banking literature to disentangle supply from demand dynamics, while delays in banks’ credit granting decisions are studied here for the …rst time. We also study the relation between uncertainty and the bank lending channel of monetary policy (Bernanke and Gertler, 1995; Kashyap and Stein, 2000). The motivation is straightforward. Non…nancial …rms are known to respond less to changes in fundamentals when uncertainty is high (Guiso and Parigi, 1999; Bloom et al., 2007). Banks might in principle be subject to a similar wait-and-see type of behavior, and if this is the case their response to shifts in monetary policy might be muted when uncertainty is high.
The identi…cation of a genuine in‡uence of uncertainty on the supply of bank credit faces a number of complications. Credit demand may change heterogeneously across …rms in response to uncertainty shocks, dependinginter alia on the …rms’…nancial constraints (Alfaro et al., 2016).
1The research on the topic is reviewed below. For the policy side of the debate, see FOMC (2008), Blanchard
The quality of the potential borrowers may worsen in bad times, giving banks an independent reason to be less accommodating (Bernanke and Gertler, 1989). Furthermore, uncertainty may propagate di¤erently depending on the banks’business models, including the strength of their existing relationships (Chodorow-Reich, 2014; Boltonet al., 2016). We get around these problems by combining two simple ideas. The …rst one is to exploit the granularity of the dataset, and the fact that …rms typically apply for funds to a number of di¤erent banks at once, to introduce in the regressions time-varying …xed e¤ects that vary at the …rm level, thus controlling for changes in observed and unobserved …rm characteristics as well as general business cycle conditions (Gan, 2007; Khwaja and Mian, 2008; Jimenéz et al. 2012, 2014). The second one is to focus on bank capital as the key source of heterogeneity in the intermediaries’behavior, while controlling extensively for other bank characteristics. With frictional capital markets, leverage constraints increase the value of banks’equity rendering them e¤ectively more risk averse (Frootet al. 1993, Froot and Stein, 1998). Banks’ net worth is indeed likely to be a key driver of their response to changes in the level of aggregate risk in the economy (Brunnermeier et al., 2012, Adrian and Shin, 2014). It follows that, if uncertainty matters at all, it must matter more for thinly capitalized lenders. Once combined, these modelling choices ultimately lead us to analyze the impact of uncertainty on the applications submitted by a given …rm at a given point in time to banks that di¤er in their capital bu¤ers, and hence in their willingness and capacity to bear additional aggregate risk.
We have three main …ndings. First, a rise in aggregate uncertainty reduces the approval rate for …rms’loan applications: a one standard deviation increase in the Economic Policy Uncertainty index of Baker et al. (2015), for instance, causes a drop in …rms’approval probability from 21 to about 19 per cent. Second, even successful …rms must wait longer for their loans to be released when uncertainty is high. Interestingly, interest rates do not have this e¤ect: the length of a bank’s decision-making process appears to be a¤ected by its con…dence about the future but not by monetary policy in and by itself. Third, uncertainty weakens the bank lending channel of monetary policy. These mechanisms are quantitatively signi…cant: the direct e¤ects of uncertainty are comparable to those of monetary policy itself, and the interaction between the two is such that the bank lending channel essentially disappears in very volatile environments. They also display interesting cross-sectional patterns. Besides operating more through less capitalized banks, uncertainty has a stronger impact on …rms that are geographically distant from the bank to which they place their applications. From a …rm’s perspective, physical proximity turns out to be a better hedge against uncertainty shocks than a good credit rating.
study the causal link between uncertainty and credit supply. Our dataset allows us to track both approved and rejected loan applications, rather than focusing on changes in credit ‡ows observed ex-post, and to study within-…rm outcomes, checking how applications placed simultaneously by the same …rm are treated by banks with di¤erent capital ratios (and hence a di¤erent appetite for bearing aggregate risk). This makes it possible to move from a somewhat speculative interpreta-tion of the patterns in the data to a more stringent discourse on causality. In this process we also highlight a dimension of banks’lending policies that as far as we know has not been examined in the banking literature thus far, namely the banks’speed in processing loan applications. This timing dimension sheds more light on the overall implications of uncertainty, and also on the pe-culiarity that sets uncertainty aside from other factors that also a¤ect bank decisions, including monetary policy. A third complementary contribution we o¤er to the literature is a thorough investigation of the interaction between uncertainty and the traditional bank lending channel of monetary policy. Economic uncertainty might in principle matter because of its in‡uence on the transmission of monetary shocks, as well as its direct negative e¤ect on credit supply, and this possibility has been largely overlooked thus far.
The remainder of the paper is structured as follows. In Section 2 we review the relevant literature. Section 3 introduces our dataset and presents a set of stylized facts on the behavior of credit applications and approvals in Italy between 2003 and 2012. We then move to the econometric analysis. We begin by studying the dynamics of the loan approval rate, which provides a direct link between our work and existing studies of the transmission of monetary policy based on loan-level data (e.g. Jiménez et al., 2012, 2014). Section 4 presents our key results as well as a set of robustness tests. In Section 5 we switch from the probability of approval to the second dimension of interest, namely the timing of the banks’decisions. Section 6 discusses further identi…cation and robustness issues and Section 7 concludes. The annex to the paper provides additional estimation results and background material.
2
Related literature
Uncertainty rises sharply in or ahead of economic slowdowns (Bloom, 2014). Risk-aversion naturally pushes consumers to save more in riskier environments, causing a decline in economic activity (Bansal and Yaron, 2004; Fernandez-Villaverde et al. 2011). This basic precautionary motive can be reinforced by two types of mechanisms.2 The …rst one relates to technology: with non-convex capital adjustments costs, a rise in volatility pushes …rms to postpone investment
2We limit our discussions to frameworks where risk a¤ects the economic cycle, but causality could in principle
and hiring decisions because it increases the likelihood that these will have to be reversed in the future (Bernanke (1983), Bloom (2009), Bloomet al. (2012)). The second one relates to …nancial markets: a rise in uncertainty increases …rms’ default probabilities and bene…ts equity holders at the expense of debt holders, and this in turn causes an increase in credit spreads, which must rise to compensate creditors for bearing more risk (Arellanoet al., 2012; Christiano et al., 2014; Gilchristet al., 2014).
These theories place di¤erent frictions at the centre of the transmission mechanism and lead to opposite conclusions as to which side of the credit market is a¤ected the most by uncertainty. In the ‘real view’uncertainty translates into a shock to the demand for credit. In the ‘…nancial view’, on the other hand, uncertainty shifts the supply curve by making lenders ceteris paribus
less willing to provide whatever funds …rms may require. Importantly, the frictions that underpin the …nancial view can also a¤ect the demand side of the credit market. Alfaro, Bloom and Lin (2016) and Chen (2016) show that …nancially-constrained …rms are more sensitive to uncertainty.3 The impact of credit constraints on …rm behavior appears to be quantitatively relevant both in the USA (Alfaro et al., 2016; Chen, 2016) and in other advanced economies (Choi et al., 2016). These results suggest that the identi…cation problem posed by the tension between real and …nancial view is a particularly hard one to solve. Identifying a genuine credit supply e¤ect on the basis of aggregate, sectoral or even bank-level data is essentially impossible: at those levels of aggregation one cannot credibly rule out the possibility that the contraction in credit that follows a rise in uncertainty is caused by the choices of the borrowers rather than those of the lenders.
Microeconometric studies of uncertainty have mostly focused on non…nancial …rms and on idiosyncratic rather than aggregate uncertainty measures. Leahy and Whited (1996) and Bloom
et al. (2007) document a strong relationship between stock price volatility and investment for manufacturing …rms listed respectively in the USA and in the UK. Guiso and Parigi (1999) measure subjective uncertainty using the distribution of the …rms’own expectations on future demand, and …nd this to have a negative impact on investment. The evidence on the relation between uncertainty and bank lending is more recent and, crucially, it relies to date on aggregate or bank-level data only. Using consolidated data from the Call Reports, Baumet al. (2013) …nd that the evidence in support of the bank lending channel of monetary policy in the US becomes weaker after controlling for the volatility of the yields on one-year or …ve-year Treasury Bills, a
3If external …nancing is costly, these …rms have a precautionary motive to reduce their debt and hoard cash in
measure of …nancial risk. Valencia (2013) and Bordoet al. (2016) investigate the relation between the growth of bank lending and various measures of aggregate uncertainty for the USA (including disagreement among forecasters, stock price volatility and the Economic Policy Uncertainty index by Baker et al., 2015), showing that uncertainty appears to discourage lending particularly for relatively less capitalized or illiquid banks, which provides indirect evidence of a causal impact of uncertainty on banks’lending policies. Rauniget al. (2014) reach a similar conclusion using an event study approach which focuses on lending dynamics around four uncertainty episodes, including the start of the Iraq war in 1990 or September 11th 2001. Alessandri and Panetta (2015) document that an increase in economic policy uncertainty predicts a tightening in the lending standards reported by European banks, as measured by the ECB’s Bank Lending Survey. Gissler
et al. (2016) introduce a speci…c measure of regulatory uncertainty exploiting the delays that occurred during the legislative process aimed at de…ning the new requirements for “quali…ed mortgages” in the US, and show that this correlates negatively with mortgage lending by US banks. Valencia (2016) documents a positive cross-sectional relation between the variance of banks’returns or capital bu¤ers and their future capital ratios, consistent with the emergence of a self-insurance motive.
We share with some of these works the premise that bank capital is important to identify uncertainty e¤ects. Since borrowing constraints e¤ectively increase their risk aversion, weakly capitalized banks are likely to be not only less willing to lend, as known, but also more responsive to changes in the level of non-diversi…able risk in the economy. In other words, they should respond more to aggregate uncertainty shocks.4 Our …rst contribution to the literature is to leverage on high-quality microeconomic data to test this possibility in a more stringent way than has hitherto been done. By studying within-…rm outcomes, we can check how banks that di¤er in their capital bu¤ers (and hence in their capacity to bear aggregate risk) treat credit applications submitted by the same …rm at the same point in time, thus excluding a number of alternative mechanisms that might in principle generate analogous patterns in bank balance sheets or aggregate credit ‡ows. In pursuing this avenue, we draw on the extensive empirical banking literature that has exploited loan applications and rejections to isolate credit supply from demand, using either o¢ cial credit register data (Jimenéz et al., 2012; Albertazzi et al., 2016; Bonaccorsi di Patti and Sette, 2016; Ippolito et al., 2016) or private banks’dataset (Puri
et al., 2011; Einav et al., 2012; Dell’Ariccia et al., 2012). In particular, we adapt the …xed e¤ect saturation approach of Jimenézet al. (2012, 2014) to study the heterogeneous impact of
4The relation between borrowing constraints, leverage and risk aversion is examined in Froot et al. (1993),
uncertainty across banks and …rms. Our second contribution is to shed light on a dimension of bank lending – i.e. the time banks take to issue loans to their new borrowers – that has thus far been overlooked in the literature. Finally, we provide a …rst systematic analysis of how uncertainty and monetary policy interact in shaping banks’lending strategies.
3
The data
Our dataset combines various types of information. At the macro level, we use indicators of aggregate uncertainty, monetary policy and economic activity. At the micro level, we combine monthly loan-level observations on …rms’credit applications with data on bank and …rm balance sheets. We provide a brief description of the uncertainty indicators in Section 3.1 and discuss in detail the loan-level data in Section 3.2. More information on the remaining series and data construction details are provided in the Data annex. Throughout the analysis we follow Jimenez
et al. (2014) in using the EONIA rate to capture the monetary policy stance. Using the one-month Euribor rate does not alter the results (see section 6). Importantly, no unconventional interventions took place in the euro area over our sample period, which runs from August 2003 to December 2012.
3.1
Uncertainty indicators
Our preferred indicator of aggregate uncertainty is the European Economic Policy Uncertainty
index (hereafter EPU) constructed by Bakeret al. (2015). The index is calculated counting the occurrences of uncertainty- and policy-related keywords in a set of daily European newspapers, and it aims to capture the uncertainty that surrounds monetary, …scal and regulatory policy interventions in Europe. Policy and regulatory uncertainty are likely to be an important driver of bank lending strategies (Gissler et al. 2016). More generally, the EPU index has gained signi…cant attention since its launch in 2012 and it has been used in a wide range of applied micro and macroeconomic empirical works on uncertainty.5
5A list of studies based on EPU indices maintained by the authors is available at
Since there is no commonly accepted way of measuring aggregate uncertainty, and most proxies are likely to be subject to measurement error, we consider for robustness a number of in-dicators that di¤er from EPU in terms of both conceptual grounding and empirical construction. The …rst one is the monthly average of the Euro STOXX 50 Volatility Index (VSTOXX), which measures the option-implied volatility on the Euro STOXX 50 equity price index over a 30 days horizon. Like VIX in the US, VSTOXX is a “fear”index that provides a market-based gauge of the volatility perceived by investors in the European stock market. The index is widely used as a proxy of aggregate risk perceptions in the euro area and it features regularly in o¢ cial pub-lications by the European Central Bank (see e.g. ECB Financial Stability Review, May 2014). A second alternative is disagreement, de…ned as the cross-sectional standard deviations of the forecasts issued by the professional forecasters surveyed by Consensus EconomicsR. We employ two disagreement indicators that are constructed using respectively forecasts on consumer price in‡ation and on the government budget balance in the euro zone.6 As these choices make clear, our analysis focuses on the implications of aggregate rather than idiosyncratic uncertainty: the indicators are meant to pick up sources of uncertainty that relate to the overall state of economy and that might in principle a¤ect all banks and …rms at once, though not necessarily in the same way or to the same degree. The proxies we use might re‡ect both the level of actual risk in the economy and the agents’subjective or Knightian uncertainty about it. The di¤erence between risk and uncertainty is conceptually interesting, but we do not see it as central to our work.
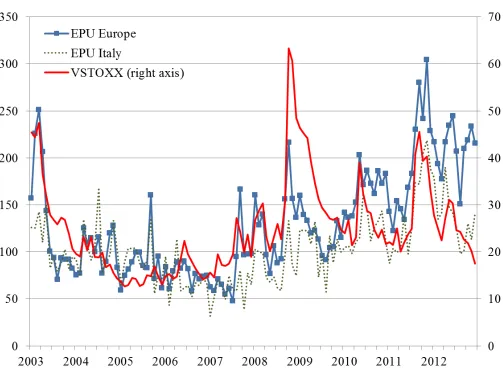
Figure 1 displays the behavior of the two EPU indices over our sample period. For comparison we also report VSTOXX. All indicators identify the …rst half of the sample as a relatively calm period: the end of the 2003 recession is followed by …ve years of mild and stable uncertainty. The Lehman crisis marks a clear regime shift. After 2008 uncertainty peaks again during the sovereign debt crisis in 2010 and 2011. The European EPU index is generally more persistent than VSTOXX and it reaches its historical maximum in 2011. The Italian version of the index follows a broadly similar pattern but it appears to be somewhat noisier, possibly on account of the smaller set of newspapers included in the calculation.
3.2
Loan applications and time to approval: stylized facts
We collect from the Italian Credit Register monthly information on all new loan applications advanced by a sample of 650.000 non-…nancial …rms to Italian banks over the period between
6In‡ation forecasts are useful because they summarize a large number of aggregate demand- and supply-side
August 2003 and December 2012. The sample includes …rms from the manufacturing, industry, services and construction sector and it is broadly representative of the entire universe of capital companies. We only observe the applications placed to banks with which the borrower has no outstanding credit relation. As standard in the literature, we assign to each loan application a binary outcome (“approved”or “rejected”) by inspecting whether, in the three months following its placement, the Credit Register records an increase in the credit granted to the enquiring …rm by the bank that received the application. Of the almost 3 million of applications we observe, 2.3 were rejected, delivering an average approval rate of about 21%.
An overview of the behavior of applications and rejections over time is provided in Figures 2 and 3. Figure 2 shows the total number of applications along with the average number of applications per …rm between 2003 and 2012. The latter is calculated by averaging over “active” …rms, namely …rms that submit at least one application in the month under examination, and gives an idea of the breadth and intensity of their loan search process.7 The grey bars mark the two recessions that hit Italy over the sample period, as dated by the OECD. The main fact that stands out from the chart is the steady decline in applications from 2008 onwards, both at the aggregate and individual …rm level. This is a clear sign that demand is an important driver of the patterns in the data. More speci…cally, the regression analysis must confront the possibility of a signi…cant drop in demand after the Lehman crisis. A second interesting fact is that the number of applications does not systematically fall during recessions: both in 2009 and in 2011 there are distinct phases when the applications actually increase, albeit only temporarily. This raises interesting questions on the nature and motivations of the applicants: it might be for instance that recessions bring about ‘lemon markets’where (otherwise inactive) bad borrowers crowd out good borrowers; or that, irrespective of their quality, …rms shop around more in bad times to minimize the risk of ending up without loans. Our identi…cation strategy, which relies on within-…rm heterogeneity in the applications’outcomes, is designed to get around these problems. Since however these possibilities are interesting and worth investigating in their own right we discuss them in greater detail in Section 6.8
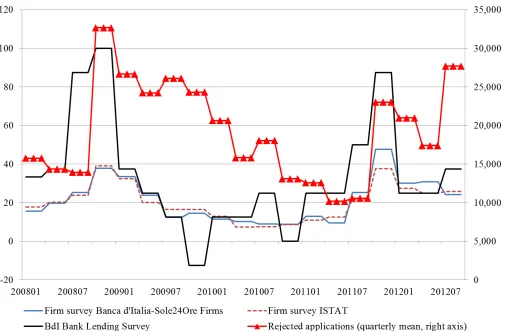
Figure 3 shows how the rejections line up against three survey-based measures of credit conditions. We consider the responses of Italian banks participating to the euro area Bank
7The median number of applications per …rm is one (in other words, less than half of the …rms submit multiple
applications in any given month) and the distribution is highly skewed, with a standard deviation of 0.30 and a maximum of 6.98 over the full period. The occurrence of multiple simultaneous applications by the same …rm is critical for identi…cation: we discuss it further in section 4.
8A third evident fact in chart 2 is a strong seasonality in the data. In the econometric analysis we deal with
Lending Survey (BLS) and two …rm surveys conducted respectively by the Italian National Statistical O¢ ce (ISTAT) and the Bank of Italy in cooperation with IlSole24Ore. We focus on the 2008–2012 window only, for which all surveys are available. The series shows the net percentage of respondents –banks or …rms, depending on the survey–that reported a perceived tightening in credit conditions in any given quarter. The monthly rejection series is averaged at the quarterly frequency to ease the comparison. Rejections track survey responses fairly well, both in general and in topical moments such as 2008/9 and 2011, when credit conditions are particularly tight. This illustrates why the Credit Register data is useful in isolating a credit supply channel. The decision (not) to grant new loans is an important component of a bank’s overall strategy, and a timely signal of changes in its lending policy, but it is necessarily neglected when focusing only on observed variations in the outstanding stock of loans.
To study the timing of banks’decision we resort to a second binary variable, P ostponedf bt.
This is created by (i) restricting the sample to the applications that were eventually approved, and (ii) inspecting whether the corresponding loans were issued in the month following the request (in which case the dummy is equal to zero) or with a delay of two or three months (dummy equal to one). Since one month is the shortest horizon over which new loans can appear in the data, the dummy sets aside all applications that were “postponed” rather than being approved straightaway. The rationale behind this variables is simple: a rise in uncertainty could induce banks to take more time before giving out a loan (besides rejecting more applicants), either because they wait for new or better signals on the state of the economy or because they try to collect more information on the quality of the applicant. This test is also useful from an identi…cation perspective. By restricting the analysis to successful applications only, we focus on good borrowers and good projects, which limits concerns on changes in the composition of applications over time. In other words, with this variable we e¤ectively rely on the banks themselves (and on some hindsight) to get around the possibility that the pool of projects may systematically worsen in bad times, which could lead to a spurious negative correlation between the approval rate and uncertainty.
The applications are accepted on average after 1.4 months, with a standard deviation of 0.6 months. The timing of the approvals displays an interesting behavior at the aggregate level. The share of postponed applications over total approvals is positively correlated with all our uncertainty indicators. Some of them, including EPU, also have signi…cant predictive power for this ratio. In the case of the EONIA rate, on the other hand, the correlation is weak and predictability runs in the opposite direction (see table A1 in the annex for details). This provides
uncertainty in the economy.
4
Uncertainty and loan approvals
4.1
Is there a credit supply channel?
The primary objective of our analysis is to establish whether ceteris paribus banks reject more loan applications when economic uncertainty is high. A second and closely related objective is to test whether they also become less responsive to monetary policy: ‡uctuations in interest rates may matter less in highly uncertain environments. To this dual end, we estimate a set of models where the dependent variable is a dummyApprovalf bt, which takes value 1 if the credit request
advanced by …rmf in montht to bankb is approved within three months and zero otherwise (as in Jiménez et al., 2014), the key regressor is the EPU uncertainty index by Baker et al. (2015), and the potential in‡uence of uncertainty on the transmission of monetary policy is captured by an interaction between EPU and the EONIA rate.
Our loan-level data allows us to estimate regressions that include …rm-speci…c …xed e¤ects that vary at the monthly frequency (Jimenéz et al. 2014). These present clear advantages in terms of identi…cation: the …rm-month e¤ects capture all changes in business cycle conditions and …rm characteristics that may in‡uence the demand for credit, thus allowing a reliable estimate of the impact of uncertainty on the supply side of the credit market. Con…ning the analysis to such a set up, however, would be limiting: the relation between uncertainty and the average approval rate (which is absorbed by the …rm-month …xed e¤ects) is interesting in its own right, and the cross-sectional results are harder to interpret without some prior knowledge about this average e¤ect. To fully exploit our data we thus proceed sequentially. We start from relatively rudimentary regressions that only include macroeconomic and bank-speci…c controls and then progressively move towards saturated speci…cations that include …rm-month …xed e¤ects. An important element of our identi…cation strategy is to exploit heterogeneity in banks’ capital bu¤ers as a proxy of their risk-bearing capacity and hence of their sensitivity to uncertainty. The progression towards increasingly rich speci…cations allows us to thoroughly test this mechanism and check whether the role of capital changes when tightening the controls for credit demand.9
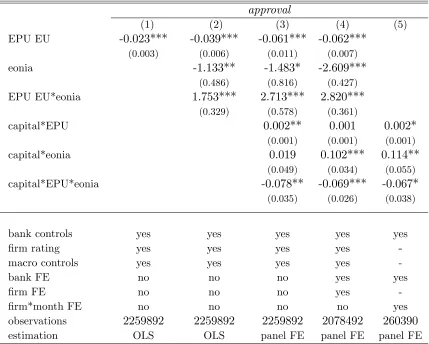
table 1 about here
9In Section 4.2 we study alternative speci…cations that include both…rm-month andbank-month …xed e¤ects
The estimates are displayed in Table 1. In the …rst column loan approvals are regressed exclusively on the EPU index, a set of macroeconomic and bank-speci…c control variables and the …rms’credit ratings. The macro controls include CPI in‡ation, industrial production growth and unemployment in Italy, all lagged one period. The bank controls are the Tier 1 capital ratio, the liquidity ratio, and two dummies that identify respectively mutual banks (small-scale lenders that mostly operate at a local level) and the …ve largest banks in the sample (more complex and diversi…ed institution with a national or international dimension). Controlling for credit ratings is important as a good rating may (and in fact turns out to) systematically improve an applicant’s chance of being approved. These regressors are included in all subsequent speci…cations. This initial regression returns a negative and highly signi…cant EPU coe¢ cient, providing prima facie evidence that the approval probability drops when uncertainty rises.10
In column 2 we introduce the EONIA rate, both in isolation and interacted with EPU, leaving the rest of the speci…cation unchanged. EPU retains its signi…cance. The negative and signi…cant coe¢ cient of EONIA is in line with the extant literature on the bank lending channel, that provides ample evidence that a tightening in monetary conditions leads to a decline in the supply of credit. The interaction between EPU and EONIA is positive and highly signi…cant:
ceteris paribus, high uncertainty weakens the in‡uence of monetary policy on loan approvals. This result demonstrates that, when faced with changes in economic conditions in uncertain times, banks adopt a wait-and-see behavior analogous to that of non…nancial …rms (Bloom, 2007, 2014). It also o¤ers one explanation why monetary policy might be relatively less e¤ective when the economy is in recession and volatility is high (Tenreyro and Twhaites, 2016). The estimates suggests that the impact of uncertainty on loan approvals is quantitatively in the same ballpark as that associated to monetary policy itself. To put the estimates in context, note that the EONIA rate is expressed in decimal points while EPU is normalized to 1 in 2000 and has a standard deviation of 0.53. Given this scaling, the coe¢ cients in column 2 imply that, starting from the current ‘zero lower bound’ on interest rates, a 100 basis points rise in EONIA would lower the approval probability by 1.1% and a one standard deviation increase in EPU would lower it by 2.1%.
The next step is to bring bank capital into the picture. The in‡uence of uncertainty should be stronger for banks that have low capital bu¤ers and hence less capacity for holding aggregate risk. We investigate this possibility by interacting the banks’ Tier 1 capital ratio with the EPU terms. Since capital is known to matter for the transmission of monetary policy too, we
10Errors are clustered at the bank*month level troughout the paper, following Jimenezet al. (2012). When we
also include its interaction with EONIA.11 The test is performed in three alternative set-ups: in column 3 we simply add the capital-based interactions to the speci…cation of column 2; in column 4 we augment the regression with bank and …rm …xed e¤ects; and in column 5 we saturate it with a full set of …rm-month …xed e¤ects. The upshot from this exercise is that capital has a powerful dampening e¤ect for uncertainty shocks. This mechanism involves both the direct and the indirect e¤ect of uncertaunty: higher capital makes banks both less responsive to variations in EPU and less prone to adopting a wait-and-see type of behavior. These patterns appear consistently across speci…cations 3 to 5. Column 5 is of course of particular interest. Owing to the presence of …rm-month …xed e¤ects, a confusion between demand and supply channels is in this case extremely unlikely. The level e¤ects of EPU and EONIA are absorbed by the …xed e¤ects and the sample size drops by an order of 10 because the estimation relies exclusively on …rms that apply to more than one bank in any given month. In practice this model checks how the propensity to approve applications coming from the same …rm in the same month changes across banks depending on their capital ratios. Conditional on a rise in uncertainty, the approval rate drops signi…cantly less for highly capitalized banks. The coe¢ cients in column 5 can be used to quantify the importance of capital. The median capital ratio in our sample is 8.7%. Relative to that benchmark, a one standard deviation rise in EPU causes the approval probability to drop 0.3 percentage points more for banks with a 6.1% capital ratio (the lowest decile of the distribution) and 0.7 percentage points less for banks with 15.5% capital ratio (the highest decile). Note that both the average e¤ects of EPU and EONIA (columns 1 to 4) and the dampening role of capital (columns 3 to 5) turn out to be very robust across models.
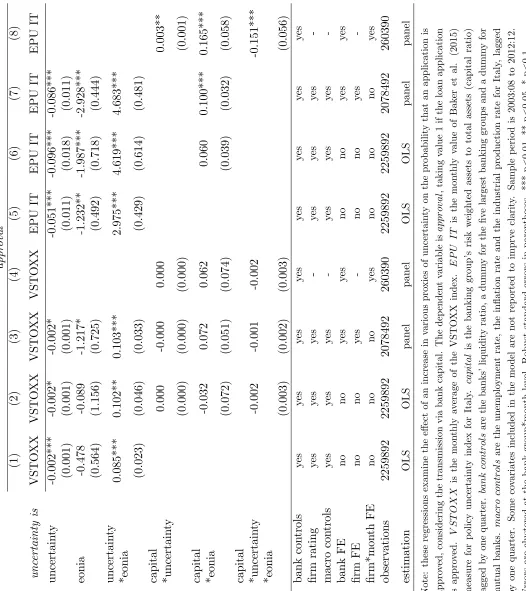
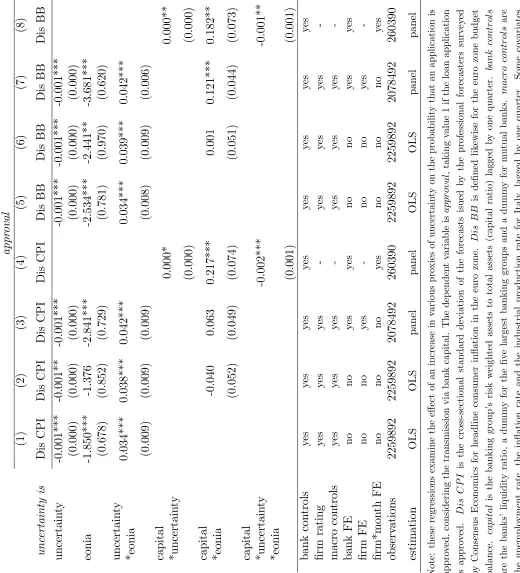
In table 2 we replicate the analysis using alternative indicators of economic uncertainty. In panel (a) the European EPU index is replaced …rst by VSTOXX (columns 1 to 4) and then by the Italian EPU (columns 5 to 8). In panel (b) we use forecasters’disagreement on CPI in‡ation (columns 1 to 4) and the public budget balance of the euro area (columns 5 to 8). For each of the indicators we estimate the same models used in Table 1, replicating the progression from a speci…cation with bank and macroeconomic controls to a fully saturated regression with …rm-month …xed e¤ects. The key results of our analysis are remarkably robust. In all combinations of proxies and speci…cations we estimate a negative coe¢ cient for uncertainty and a positive coe¢ cient for the interaction between uncertainty and EONIA. In the saturated regressions, the dampening e¤ect of bank capital appears for three indicators out of four, the exception being VSTOXX. This suggests that measurement problems are extremely unlikely to constitute
11As we noted above the capital ratio is included as a control variable in all regressions of table 1. Not
a …rst-order problem in our analysis (we discuss measurement problem more in section 6).
table 2 about here
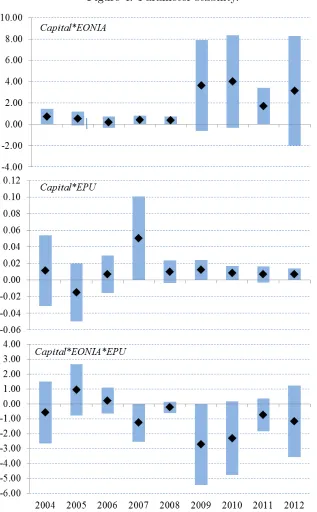
Another important concern is the stability of the estimates over time. Economic conditions changed signi…cantly between 2003 and 2012, as the Italian economy transitioned from a relatively calm phase, with constant or rising interest rates, to two crisis episodes –the global …nancial crisis of 2008-2009 and the subsequent sovereign debt crisis – that were accompanied by signi…cant monetary expansions. To check how the transmission of uncertainty changed in these periods we re-estimate the saturated speci…cation in column 5 of table 1 separately for each year of the sample. The estimated coe¢ cients are displayed in …gure 4. The …gure reports the point estimate and a 90% con…dence interval for each of the three interactions involving bank capital. The estimates are generally larger and less accurate in the second half of the sample, but the signs of the coe¢ cients are extremely robust. In particular, the interaction between capital and EPU always enters the regression with a positive coe¢ cient except in 2005, when it is approximately zero. The signi…cance levels of the estimates are also surprisingly high considering that each of these year-speci…c regressions only relies on 12 observations on EPU and on an overall sample size of approximately 250,000 observations due to the …xed e¤ect saturation.
In Section 6 we examine the robustness of the results in table 1 along various other dimensions and discuss a range of microeconomic phenomena that might in principle interfere with our identi…cation strategy, including changes in the quality and composition of the applications or in their distribution across banks. In the remainder of this section we investigate instead how the transmission of uncertainty changes depending on banks’liquidity, size and business model. Like capital, liquidity might in principle dampen banks’reaction to aggregate uncertainty. Liquidity is unlikely to directly a¤ect a bank’s attitude towards credit risk, but it might for instance increase its tolerance for maturity risk, making it more willing to commit its funds for longer time periods. Banks’ size and business models are also likely to play some role, as small local lenders and international players are unlikely to deal with uncertainty (or even perceive it) in the same way. To explore these possibilities, in table 3 we re-estimate the regressions interacting uncertainty with liquidity, size or business model indicators instead of the banks’capital ratios. The exercise is performed for both the regression based on bank and …rm …xed e¤ects (where EPU and EONIA appear independently) and the saturated speci…cation with …rm-month …xed e¤ects (where they only appear through their interaction with the relevant bank indicator).
We …nd that liquidity plays a role in dampening the transmission of both monetary policy and uncertainty. Interestingly, in the latter case liquidity works mainly by reducing banks’ inaction region: this implies that liquid banks respond less on average to monetary shocks, as demonstrated by the bank lending channel literature, but their response is also more stable, i.e. less dependent on the prevailing level of uncertainty. While large intermediaries do no appear to behave di¤erently from the average bank, mutual banks display a lower-than-average sensitivity to uncertainty (column 6). This may indicate that they are less informed, or that their business model leads them to pay less attention to the aggregate, economy-wide risks captured by the EPU index.12 In section 4.2 we explore heterogeneity across applicants in order to discriminate between these mechanisms.
4.2
The composition e¤ects of uncertainty
Our loan-level dataset makes it possible to push the saturation of the model one step further and introduce bank month …xed e¤ects alongside the f irm month e¤ects used in the previous section. A similar exercise is proposed in a di¤erent context by Jimenez et al. (2012, 2014). In this set up the interaction between uncertainty and bank capital is also absorbed by the …xed e¤ects and the analysis must focus on triple interaction terms where uncertainty is combined with both bank and …rm characteristics. This speci…cation follows a di¤erent logic than those pursued in Section 4.1. In this case the objective is not to re…ne the identi…cation of the supply-side e¤ects of uncertainty, but rather to draw a more detailed picture of its compositional implications: which bank-…rm relations are most a¤ected by uncertainty? And what are the features of the ‘marginal borrowers’that get rejected in uncertain times?
Table 4 reports the results of a range of “fully saturated” speci…cations that include both bank and …rmlevel monthly …xed e¤ects. For each speci…cation we report the estimated coe¢ -cients for the triple interactions between EONIA or EPU and some combination of bank and …rm characteristics. The speci…cations only di¤er because of these combinations. On the bank side, following the analysis in the previous section we consider the capital ratio (panel (a), columns 1 to 3), the liquidity ratio (panel a, columns 4 to 6) and two dummies that identify mutual banks (panel b, columns 1 to 3) and the …ve largest banks in our sample (panel b, columns 4-6). On the …rm side, we condition on the new potential borrowers being large (assets above the 90th percentile of the distribution), having a good credit rating (Altman’set. al. (1994) z-score below 3, where 1 is assigned to the best borrower and 9 to the worst ones) or being headquartered in the
12Mutual banks appear less sensitive even if we use the Italian EPU index instead of the European one, dispelling
same province as the bank they apply to. Since in these models the estimation relies exclusively on banks and …rms that engage in multiple relation at any given point in time, the size of the sample drops considerably relative to Table 1.13
table 4 about here
The dampening role of bank capital emerges again consistently in columns 1 and 3 of panel a. This provides an important validation of the results discussed in Section 4.1. Although they do not change the basic message, these estimates show that capital remains important for the transmission of uncertainty even if one controls for the observed and unobserved factors that a¤ect the average behavior of each bank at a given point in time. Notably, such factors include the banks’(time-varying and potentially idiosyncratic) views on both the path of future economic activity and the real state of their balance sheets, which are unlikely to be captured by balance sheet data.
Liquidity reduces the transmission of uncertainty to local borrowers (on which see below) but not to large …rms. Highly liquid banks are in fact less likely to accept these as new customers when uncertainty is high, possibly on account of a bad match between their own preferences for holding liquid securities and the clients’needs (large loans attached to complex investment projects). The comparison between mutual banks and large banks is also informative. These banks behave roughly in the same way when dealing with large or highly rated …rms. The only factor that really sets them apart is their attitude towards local …rms: mutual banks have much higher approval rates for …rms that are located in their own province (panel b, column 3), whereas geographical proximity is completely irrelevant for large banks (column 6). The emergence of a positive role for physical proximity is coherent with the literature on distance, monitoring and credit supply (see Degryse et al. 2007 for a survey). In our case, the …ndings shed some light on the reasons why small lenders are less responsive to uncertainty. Given that their approval rates drop for the average borrower more than the local ones, their behavior cannot be driven by lack of information on the state of the economy. The discrimination suggests instead that local borrowers are preferable from their perspective when uncertainty is high, either because gathering information about them is easier or less costly or because their projects have a high ‘alpha’but a low ‘beta’(i.e. they carry signi…cantidiosyncratic risk but are less correlated with theaggregate
risks captured by the EPU indicator). What is also interesting, and perhaps somewhat puzzling, is that distance matters more than …rms’credit ratings: in table 4 the ‘same province’dummy is
13Errors are here clustered at the bank, …rm and month level, following Jimenez et al. (2014). Note that the
positive in three cases out of four (when interacted with capital, liquidity, and the mutual bank status) while the rating dummy is never signi…cant. From a …rm’s perspective, geographical proximity is thus a far better hedge against uncertainty shocks than a sound credit record.
5
Uncertainty and the timing of loan approvals
Uncertainty could also a¤ect the timing of the approvals: obtaining a loan may take longer when uncertainty is high. To test this proposition we separate …rms’applications depending on how quickly they got approved and then check if the likelihood of a longer approval process rises systematically after an increase in uncertainty. More speci…cally, we restrict the analysis to the subsample of applications that were ultimately successful (i.e. those for whichApprovalf bt = 1),
and de…ne in this set a dummyP ostponedf bt that takes value zero for the applications that were
approved within a month following the submission and value one for those that were instead “postponed” and incurred a delay of one month or more.14 Besides being interesting in its own right, this variable is valuable from an identi…cation perspective. In some of the regressions examined in Section 4.1, failure to fully capture banks’expectations on the economy might mean that bad news (that are typically associated with a rise in EPU) may bias our estimate of the uncertainty coe¢ cient.15 This should be less of an issue with P ostponed
f bt because the natural
response to outright bad news is to reject more applications, not to postpone the decisions. More importantly, by restricting the analysis to successful applicants we focus on good projects only and hence limit any concerns one might have on how the composition of the applications changes over time. This variable e¤ectively allows us to rely on the banks themselves to rule out the possibility that the pool of projects in the estimation sample worsens in bad times, leading spuriously associate drops in the approval rate to uncertainty.16
table 6 here
A set of loan-level regressions of P ostponedf bt on EPU are reported in Table 5. Since we
have no priors on whether the timing of banks’decisions should respond to the level or to the
14In principle one could estimate a multivariate logit model including all approval dates (t+ 1, t+ 2, t+ 3)
as alternative outcomes. Since however our objective is to test the null hypothesis that uncertainty does not in‡uence the approval timing at all, a linear model based on a binary dummy is valid and simpler alternative to it.
15We emphasize however that this problem cannot arise in the models of Section 4.2, where the bank-month
…xed e¤ects also capture banks’(potentially heterogeneous) expectations on the macroeconomic outlook.
16The saturated regressions in Section 4 already control for changes in the composition of the pool of …rms
variation in uncertainty we provide results based on both speci…cations. We again build up the speci…cations going progressively from plain OLS regressions (columns 1 and 4) to regressions that include bank and …rm …xed e¤ects (columns 3 and 6), including in all cases the usual set of controls. The coe¢ cient is positive and signi…cant across speci…cations, implying that the likelihood of an application being postponed increases systematically when uncertainty is high or on the rise. Interestingly, P ostponedf bt is not correlated to levels and changes in the EONIA
rate (see table A2 in the annex). Given that EONIA contains information on the current and expected state of the economy, but not on the uncertainty that surrounds them, its lack of signi…cance con…rms that these regressions isolate a genuine uncertainty e¤ect. The delays are associated with the banks’di¢ culty in forming forecasts on the future path of the economy rather than with (downward) revisions in those forecasts.
Additional regressions reported in the annex to the paper con…rm that this relation is robust across uncertainty indicators (tables A3), and show that it varies across …rm (but not bank) characteristics (table A4). In particular, …rms that are located close to the bank to which they place the application face a probability of being postponed that is low on average but rises relatively more in response to an increase in uncertainty. Combined with the results of section 4.2, this suggests that, although proximity is a good hedge against uncertainty-driven rejections, local applicants are kept on hold for longer when uncertainty rises, possibly because banks exploit some degree of informational hold-up power on close-by …rm (Diamond, 1991). A similar pattern emerges indeed for …rms that are below the 90th percentile of the total asset distribution.
6
Discussion
In this section we examine brie‡y a range of additional robustness tests and then discuss alterna-tive mechanisms that might in principle give place to the patterns we observe in our data. The estimates of the level e¤ect of uncertainty on the average approval rate displayed in column 2 of table 1 keep their sign and signi…cance when including bank and …rm …xed e¤ects, irrespective of how uncertainty is measured (see table A5 and A6 in the annex). Since EONIA and our main uncertainty proxies are de…ned at the European level, and are consequently not driven by economic conditions in Italy, endogeneity with respect to the Italian business cycle is unlikely to be a serious problem. At any rate, using lags of these variables in the regression, either in combination with or instead of their contemporaneous values, leaves the estimates essentially unchanged (table A5, columns 1 and 2).
microeco-nomic level. To check the potential mismeasurement of monetary policy we replace EONIA with the one-month EURIBOR rate (table A7, column 3). Since EPU might conceivably pick up the e¤ect of plain bad news about the future of the economy, as well as genuine uncertainty, we also add to the regression two survey-based measures of expectations. In particular, we use the Economic Sentiment Indicator for Italy (a broad indicator that combines consumer and …rm information) and a measure of Italian …rms’expectations on production, employment and selling prices over the following 12 months constructed using the surveys run by the European Commission. The results are again in line with the baseline (table A7, column 4). The EPU coe¢ cients are actually larger than those estimated in our baseline regression, suggesting that the uncertainty indicator is not in‡ated by the occurrence of bad news.17
Measurement issues may also involve the loan application data. The reporting threshold in the Credit Register was lowered in 2009 from 75,000 to 30,000 euros, resulting in an increase in the number of loans traceable in the records. This change is of course irrelevant for the regressions that include…rm*month …xed e¤ects, or are estimated separately year by year (see Section 4.1), but it must be dealt with in all other cases. To bypass the break, in our analysis we consider only loans above 75,000 euros throughout the sample (as in Bonaccorsi di Patti and Sette, 2012). As a further robustness we estimate the model using only large …rms (those with assets above 90th percentile of the distribution), which are virtually una¤ected by the change, or relying on
the raw, unadjusted data. Our main conclusion hold in both cases (see table A7, columns 5 and 6). During the period we consider the banking sector underwent a number of mergers and acquisitions. In principle M&As should not a¤ect our dependent variable, as this only covers new requests for credit. However, when assessing the existing credit relations of the acquired bank(s), the acquirer might possibly place for convenience queries to the Credit Register which appear as new applications in the data. If M&A activity were to concentrate in periods of low uncertainty, this could create a negative correlation between uncertainty and the probability of approval. For this reason in our baseline analysis we exclude from the sample all queries advanced by newly formed groups in the year when the M&A takes place. Including these observations, however, does not a¤ect the results (table A7, column 7). Finally, the applications display strong seasonal patterns, with regular falls in August and December (see Figure 2). To account for this, we include in the model a full set of month dummies: the impact on the coe¢ cients of interest is again negligible (table A7, column 8).
Going beyond robustness, the credibility of our results can also be scrutinized from a broader
17In table A8 we present the result of the two robustness tests that we can carry out on the speci…cation with
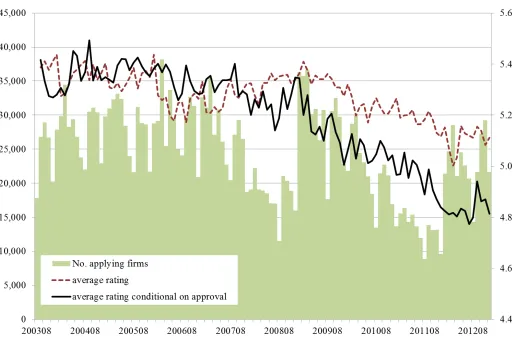
economic perspective. Our …ndings could in principle also be explained by changes in the com-position of the applicants over time: if the pool of applicants deteriorates during downturns, we might wrongly link to uncertainty an increase in the rejection rate that depends instead on the declining quality of the borrowers. Surprisingly, though, the borrowers do not get worse in recessions. In Figure 5 we plot the average credit rating of the applicants over time. Lower numbers are associated to better borrowers, with 1 representing the highest credit quality. The chart shows that the average rating improves after Lehman, suggesting a self-selection process on the …rms’side that should -if anything- run against our results. Another interesting fact is that this qualitative improvement is even more visible in the case of successful (i.e. approved) borrowers: the average ratings of applicants and successful applicants overlap in the …rst half of the sample but a clear gap opens up between them after 2008, indicating a stronger selection on the banks’ side too. This might of course represent yet another adjustment of the lenders to a riskier environment. In any case, these dynamics are fully controlled for at the …rm level by the …rm-month …xed e¤ects. Furthermore, our analysis of the timing of banks’decisions in Section 5 is not a¤ected by credit quality concerns even at the project level, as it focuses only on applications that are eventually approved by the banks.
7
Conclusions
Credit systematically dries up when the future is uncertain. The theory suggests that this phenomenon might re‡ect both demand dynamics –uncertain …rms are more likely to postpone their investment decisions – and supply-side e¤ects, as lenders are less willing to …nance new projects when their returns become more volatile. In this article we exploit con…dential loan-level data from the Italian Credit Register to test the existence and the scope of the second transmission mechanism. We study the outcome of loan applications submitted to Italian banks by a large sample of …rms between 2003 and 2012. To isolate the impact of uncertainty on the supply of credit we exploit the occurrence of multiple bank-…rm relations and compare the outcomes of applications placed in the same time period by the same …rm to banks that have di¤erent capital bu¤ers, and hence a di¤erent propensity to hold aggregate risk.
References
[1] Adrian, Tobias, and Hyun S. Shin, 2014. Procyclical leverage and Value-at-risk. Review of Financial Studies, 27(2): 373–403.
[2] Albertazzi, Ugo, Bottero, Margherita and Gabriele Sene, 2016. Sharing information on lend-ing decisions: an empirical assessment.Journal of Financial Intermediation, forthcoming.
[3] Alessandri, Piergiorgio and Fabio Panetta, 2015. Prudential policy at times of stagnation: a view from the trenches. Bank of Italy Occasional Paper No.300, December.
[4] Alfaro, Ivan, Bloom, Nicholas, and Xiaoji Linx, 2016. The Finance-Uncertainty Multiplier. Mimeo, Stanford University.
[5] Altman, E. I., G. Marco and F. Varetto, 1994. Corporate distress diagnosis: comparisons using linear discriminant analysis and neural networks (The Italian Experience).Journal of Banking and Finance, 505-529.
[6] Angelini, Paolo, Nobili, Andrea and Cristina Picillo, 2014, The interbank market after august 2007: what has changed, and why? Journal of Money, Credit and Banking, 43(5), 923–958.
[7] Arellano, Cristina, Yan Bai and Patrick J. Kehoe, 2012. Financial markets and ‡uctuations in uncertainty. Minneapolis Fed WP 466.
[8] Bachmann, Ruediger and Giuseppe Moscarini, 2012. Business cycles and endogenous uncer-tainty. Mimeo.
[9] Baker, Scott R., Bloom, Nicholas and Davis, Steven J., 2015. Measuring economic policy uncertainty. NBER Working Paper no. 21633, October.
[10] Bansal, Ravi, and Amir Yaron, 2004, Risks for the long run: A potential resolution of asset pricing puzzles. Journal of Finance, 59(4), 1481–1509.
[11] Baum, Christopher, Caglayan, Mustafa and Neslihan Ozkan, 2013. The role of uncertainty in the transmission of monetary policy e¤ects on bank lending. The Manchester School 81(2), 202–225.
[12] Bernanke, Ben, 1983, Irreversibility, uncertainty and cyclical investment, Quarterly Journal of Economics 98, 85–106.
[13] Bernanke, Ben and Mark Gertler, 1995. Inside the black box: the credit channel of monetary policy transmission.Journal of Economic Perspectives, 9(1), 27-48.
[14] Bernanke, Ben and Mark Gertler, 1989. Agency costs, net worth, and business ‡uctuations.
The American Economic Review, 79 (1), 14-31.
[16] Bloom, Nicholas, 2009. The Impact of uncertainty shocks. Econometrica,77, 623–685.
[17] Bloom, Nicholas, 2014, Fluctuations in uncertainty.Journal of Economic Perspectives,28(2), 153–176.
[18] Bloom, Nick, Stephen Bond, and John Van Reenen, 2007. Uncertainty and investment dynamics.Review of Economic Studies, 74(2), 391–415.
[19] Bloom, Nicholas, Floetotto, Max, Jaimovich, Nir, Saporta-Eksten, Itay, and Stephen J. Terry, 2012. Really uncertain business cycles, NBER Working Paper no.18245.
[20] Bolton, Patrick, Freixas, Xavier, Gambacorta, Leonardo and Paolo Emilio Mistrulli, 2016. Relationship and transaction lending in a crisis, Review of Financial Studies, forthcoming.
[21] Bonaccorsi, Emilia and Enrico Sette, 2016. Did the securitization market a¤ect bank lending during the …nancial crisis? Evidence from a credit register. Journal of Financial Intermedi-ation, 25, 54-76 .
[22] Bordo, Michael D., John V. Duca and Christo¤er Koch, 2016. Economic policy uncertainty and the credit channel: aggregate and bank level U.S. evidence over several decades. NBER Working Paper no. 22021, February.
[23] Brunnermeier, Markus K., Eisenbach, Thomas M. and Yuliy Sannikov, 2012. Macroeco-nomics with …nancial frictions: A Survey. NBER Working Paper no.18102
[24] Buti, Marco, and Padoan, Pier Carlo, 2013.How to make Europe’s incipient recovery durable: end policy uncertainty. VoxEU, 12 September 2013.
[25] Caccavaio, Marianna, Carpinelli, Luisa, Marinelli, Giuseppe and Enrico Sette, 2014. Shock transmission through international banks: the Italian case. Bank of Italy Occasional Paper No.232, September.
[26] Chen, Guojun, 2016. Corporate savings, …nancing and investment with aggregate uncer-tainty shocks. Manuscript.
[27] Ciccarelli, Matteo, Maddaloni, Angela and Josè Luis Peydro, 2015. Trusting the bankers: a new look at the credit channel of monetary policy. Review of Economic Dynamics, 18, 979–1002.
[28] Chodorow-Reich, Gabriel, 2014. The employment e¤ects of credit market disruptions: …rm-level evidence from the 2008–9 …nancial crisis. The Quarterly Journal of Economics, 129 (1), 1-59.
[29] Choi, Sangyup, Furceri, Davide, Huang, Yi and Prakash Loungani, 2016. Aggregate un-certainty and sectoral productivity growth: The Role of Credit Constraints. IMF Working Paper 16/174.
[31] Degryse, Hans, Cerqeuiro, Geraldo and Steven Ongena, 2007. Distance, bank organizational structure, and credit. TILEC Discussion Paper No. 2007-018.
[32] Dell’Ariccia, Giovanni, Igan, Deniz and Luc Laeven, 2012. Credit booms and lending stan-dards: evidence from the subprime mortgage market.Journal of Money, Credit and Banking. 44, 367-384.
[33] Diamond, Douglas W., 1991.Monitoring and reputation: The choice between bank loans and directly placed debt.Journal of Political Economy, 4, 689–721.
[34] Einav, Liran, Jenkins, Mark and Jonathan Levin, 2012, Contract pricing in consumer credit markets.Econometrica, 80 (4), 1387–1432.
[35] Fernández-Villaverde, Jesús, Guerrón-Quintana, Pablo, Rubio-Ramírez, Juan F., Uribe, Martin, 2011. Risk matters: The real e¤ects of volatility shocks,American Economic Review
101(6), 2530-2561.
[36] Froot, Kenneth. A., Scharfstein, David S., and Jeremy C. Stein, 1993. Risk management: Coordinating corporate investment and …nancing policies.Journal of Finance48, 1629–1658.
[37] Froot, Kenneth A. and Jeremy C. Stein, 1998. Risk management, capital budgeting and cap-ital structure policy for …nancial institutions: An integrated approach.Journal of Financial Economics 47, 55–82.
[38] Gan, J., 2007. The real e¤ects of asset market bubbles: loan- and …rm-level evidence of a lending channel. Review of Financial Studies, 20, 1941-1973.
[39] Gilchrist, Simon, Sim, Jae W., and Egon Zakrajsek, 2014, Uncertainty, …nancial frictions and investment dynamics, NBER Working Paper no. 20038, April.
[40] Gissler, Stefan, Jeremy Oldfather and Doriana Ru¢ no, 2016. Lending on hold: regulatory uncertainty and bank lending standards. Journal of Monetary Economics, forthcoming.
[41] Guiso, Luigi and Giuseppe Parigi, 1999, Investment and demand uncertainty.The Quarterly Journal of Economics, 114(1), 185-227.
[42] Ilut, Cosmin L., and Martin Schneider, 2014. Ambiguous business cycles, American Eco-nomic Review, 104(8), 2368-99.
[43] Ippolito, Filippo, Peydrò, Josè L., Polo, Andrea and Enrico Sette, 2016. Double bank runs and liquidity risk management,Journal of Financial Economics, forthcoming.
[44] Jiménez G., S. Ongena, J. L. Peydró and J. Saurina, 2012. Credit supply and monetary pol-icy: identifying the bank balance-sheet channel with loan applications.American Economic Review, 102: 2301-2326.
[46] Leahy, John, and Toni Whited, 1996, The e¤ect of uncertainty on investment: Some stylized facts.Journal of Money, Credit and Banking, 28(1), 64–83.
[47] Kashyap, Anil. K. and Stein, Jeremy C., 2000, What do a million observations on banks say about the transmission of monetary policy? American Economic Review, 90, 407–428.
[48] Khwaja, A. and Asim Mian, 2008. Tracing the impact of bank liquidity shocks: evidence from an emerging market.The American Economic Review, 30, 1413-1442.
[49] Puri, Manju, Rocholl, Jörg and Sascha Ste¤en, 2011. Global retail lending in the aftermath of the US …nancial crisis: Distinguishing between supply and demand e¤ects. Journal of Financial Economics, 100 (3) 556 -578.
[50] Rampini, Adriano. A., and S. Viswanathan, 2010. Collateral, risk management, and the distribution of debt capacity.Journal of Finance 65, 2293–2322.
[51] Rampini, A.A., Viswanathan, S. and Vuillemey, G., 2016. Risk Management in Financial Institutions, manuscript.
[52] Raunig, Burkhard, Scharlerz, Johann and Friedrich Sindermann, 2014, Do banks lend less in uncertain times? Oesterreichische Nationalbank Working Paper no.194.
[53] Tenreyro, Silvana and Gregory Thwaites, 2016. Pushing on a string: US monetary policy is less powerful in recessions. American Economic Journal: Macroeconomics, 8(4): 43–74.
[54] Valencia, Fabian, 2013. Aggregate uncertainty and the supply of credit, International Mon-etary Fund working paper no.241.
Figures
Figure 1. Uncertainty indicators over time
Figure 2. Loan applications
Figure 3. A comparison between rejections and survey responses
Figure 4. Parameter stability.
Figure 5. Number and credit quality of the applicants.
Tables
Table 1. The impact of uncertainty on loan approval
approval
(1) (2) (3) (4) (5)
EPU EU -0.023*** -0.039*** -0.061*** -0.062***
(0.003) (0.006) (0.011) (0.007)
eonia -1.133** -1.483* -2.609***
(0.486) (0.816) (0.427)
EPU EU*eonia 1.753*** 2.713*** 2.820***
(0.329) (0.578) (0.361)
capital*EPU 0.002** 0.001 0.002*
(0.001) (0.001) (0.001)
capital*eonia 0.019 0.102*** 0.114**
(0.049) (0.034) (0.055)
capital*EPU*eonia -0.078** -0.069*** -0.067*
(0.035) (0.026) (0.038)
bank controls yes yes yes yes yes
…rm rating yes yes yes yes
-macro controls yes yes yes yes
-bank FE no no no yes yes
…rm FE no no no yes
-…rm*month FE no no no no yes
observations 2259892 2259892 2259892 2078492 260390 estimation OLS OLS panel FE panel FE panel FE
Note: these regressions examine the e¤ect of an increase in uncertainty on the probability that an application is approved, considering the transmission via bank capital. The dependent variable is approval, taking value 1 if the loan application is approved. EP U EU is the monthly value of Baker et al. (2015) measure for policy uncertainty index for Europe. capital is the banking group’s risk weighted assets to total assets (capital ratio) lagged by one quarter. bank controls
Table 5. The impact of uncertainty on postponed applications.
postponed
(1) (2) (3) (4) (5) (6)
EPU 0.029*** 0.030*** 0.024**
(0.006) (0.006) (0.011)
EPU 0.037*** 0.028*** 0.027***
(0.007) (0.006) (0.008)
bank controls yes yes yes yes yes yes
…rm rating yes yes - yes yes
-macro controls yes yes - yes yes
-bank FE no no yes no no yes
…rm FE no yes - no yes
-…rm*year FE no no yes no no yes
observations 399024 240944 78424 393691 236469 77699 estimation OLS panel FE panel FE OLS panel FE panel FE
Annex
A. Data description
Monthly data on loan applications are corrected for mergers and acquisition by discarding the applications advanced to the acquiring bank by costumers of the acquired bank in the quarter before the completion of the M&A. To account for the change in reporting threshold (January 2009) we consider only the applications that were not a¤ected by it. Both correction are relaxed in the robustness tests in section 6 Other features of loan applications and uncertainty indicators are discussed in Section 3 of the paper.
To these data we merge bank balance sheet information drawn from the Bank of Italy su-pervisory records. We use consolidated quarterly series on banks’Tier 1 capital ratio, liquidity ratio (de…ned as the ratio of cash and securities to total assets), a dummy to single out banks belonging to the …ve largest groups and one for mutual banks. Information on …rms comes from the proprietary database managed by Cerved GroupR , from which we initially randomly selected the …rms in our data. The dataset gives us yearly information on total assets and the CervedR rating, a synthetic indicator of the …rm’s overall credit quality.18 We also separately collect information on the distance between the …rms’headquarters and the o¢ ces of the banks that receive their credit applications.
Our baseline monetary policy indicator is the monthly average of daily EONIA rates, as in Jiménezet al. (2014). Using EONIA has two important advantages. The …rst one is that EONIA might capture at least in part the impact of unconventional monetary interventions that we do not account for explicitly in the regressions (Ciccarelliet al., 2015). The second one is that, given its short (overnight) maturity, EONIA is relatively less a¤ected by liquidity and credit risk premia. This point is clearly critical for our purposes: using interest rates that are heavily driven by agents’risk perceptions would greatly complicate our attempts to disentangle uncertainty e¤ects from the ordinary bank lending channel of monetary policy. In the robustness analysis we use a one-month Euribor rate, though this is less attractive because it might have been partly driven by risk-related concerns, particularly after 2007 (Angeliniet al. 2011). Our main macroeconomic control variables are the monthly series on in‡ation, industrial production and the unemployment rate in Italy available from the European Central Bank’s Statistical Data Warehouse. In‡ation is the quarterly growth rate in the Harmonized Consumer Price Index (HCPI) that excludes food and energy (a proxy of “core”in‡ation). Since GDP is not available on a monthly basis, we measure economic activity with the quarterly growth in industrial production and unemployment. In addition to these, in the robustness analysis we use two measure of expectations on future economic activity constructed with survey data from the European Commission. The …rst one is the Economic Sentiment Indicator (ESI), a broad sentiment measure published directly by the European Commission which includes household and …rm expectations and perceptions on the current state of the economy. The second one is an “expected activity” indicator that we construct by averaging …rms’expectations on their own production levels, employment and selling prices over the following 12 months.
18Cerved computes a z-score (rating) based on the methodology developed in Altman (1994) to all …rms that
The variables in the data are organized in such a way to reproduce the information set avail-able to the evaluating bank in the month when the application is formulated. More precisely, data on the monetary policy rate and on uncertainty are contemporaneous; the other macroeco-nomic variables and information on banks refer to the quarter preceding the loan application; and the …rm-level variables refer to the end of the previous year.
[image:40.612.55.562.235.576.2]B. Figures
Figure A1. Number of applications per bank category.
C. Additional tables
Table A2. Postponed applications: robustness tests.
posponed
(1) (2) (3) (4) (5) (6)
EPU 0.026*** 0.026*** 0.024**
(0.007) (0.008) (0.011)
eonia -0.258 -0.600 0.072
(0.403) (0.458) (1.590)
EPU 0.036*** 0.027*** 0.026***
(0.007) (0.006) (0.008)
eonia -2.510 -1.966 -1.396
(3.232) (2.692) (2.879)
bank controls yes yes yes yes yes yes
…rm rating yes yes - yes yes
-macro controls yes yes - yes yes
-bank FE no no yes no no yes
…rm FE no yes - no yes
-…rm*year FE no no yes no no yes
observations 399024 240944 78424 393691 236469 77699 estimation OLS panel FE panel FE OLS panel FE panel FE
. T a b le A 1 . C o rr el a ti o n b et w ee n u n ce rt a in ty a n d p o st p o n ed a p p li ca ti o n s. E O N I A E P U V S T O X X V ol atil ity D is a g r ee C P I D isag r ee B B A. Con temp oraneous correlation with P ostpone S ta ti st ic -0 .1 5 3 0 .1 7 0 0 .2 1 5 0 .1 4 5 0 .0 9 8 0 .1 6 3 p -v a lu e 0 .1 1 0 .0 7 0 .0 2 0 .1 2 0 .3 0 0 .0 8 B. Granger causalit y test: X is not predicted b y P
ostpone Sta
[image:42.612.170.453.43.726.2]