Peptide Nucleic Acid Clamping and Direct Sequencing
in the Detection of Oncogenic Alterations in Lung
Cancer: Systematic Review and Meta-Analysis
Jae-Uk Song
1and Jonghoo Lee
21Division of Pulmonary and Critical Care Medicine, Department of Internal Medicine, Kangbuk Samsung Hospital, Sungkyunkwan University School of Medicine, Seoul;
2Department of Internal Medicine, Jeju National University Hospital, Jeju National University School of Medicine, Jeju, Korea.
Purpose: Molecular testing in non-small cell lung cancer (NSCLC) aids in identifying oncogenic alterations. The aim of this study was to compare the rates of detection of oncogenic alterations and responsiveness to epidermal growth factor receptor-tyrosine kinase inhibitors (EGFR-TKIs) according to EGFR mutation status as determined by peptide nucleic acid (PNA) clamping or di-rect sequencing (DS).
Materials and Methods: We performed a systematic literature search using MEDLINE, EMBASE, and the Cochrane Central Reg-ister. Data from included studies were pooled to yield summary sensitivity, specificity, positive and negative likelihood ratios, di-agnostic odds ratio, and receiver operating characteristic curves. A meta-regression analysis was conducted to identify potential sources of heterogeneity between selected studies.
Results: We identified 10 studies comprising 924 patients. Oncogenic alterations were detected in 340 of 924 cases (36.8%) with PNA clamping and in 250 of 924 (27.1%) with DS. The pooled sensitivities of PNA clamping and DS were 0.93 [95% confidence in-terval (CI): 0.90−0.95] and 0.69 (95% CI: 0.64−0.73), respectively. According to meta-regression analysis, none of the covariates were found to be significant sources of heterogeneity. With respect to treatment responses to EGFR-TKIs, there was no significant difference therein between EGFR mutations detected by PNA clamping and DS (53.4% vs. 50.8%; risk ratio, 0.99; 95% CI 0.83−1.19; p=0.874).
Conclusion: We demonstrated that PNA clamping has a higher sensitivity than DS for detecting oncogenic alterations in NSCLC. Our findings suggest that PNA clamping is a more useful method for clinical practice.
Key Words: Genetic testing, peptide nucleic acids, epidermal growth factor, lung neoplasms
INTRODUCTION
Lung cancer is the leading cause of cancer-related death world-wide.1 Non-small cell lung cancer (NSCLC) is the most
com-mon type of lung cancer, accounting for approximately 85% of all cases.1 Since the discovery of oncogenic alterations in
NSCLC, targeted therapeutic agents have been developed, re-sulting in improved survival in patients with treatable onco-genic alterations, including epidermal growth factor receptor (EGFR) mutation and anaplastic lymphoma kinase transloca-tion.2 Development of sensitive and specific methods to detect
treatable oncogenic alterations is therefore a meaningful en-deavor,2 and a variety of methods for detecting oncogenic
al-terations in NSCLC have been developed.3
Direct sequencing (DS) is the traditional and standard meth-od for detecting EGFR mutations, and remains the most useful validated method for testing.3 However, DS requires a
com-plex procedure, including DNA extraction, PCR-based ampli-fication, DNA sequencing, and sequence interpretation.3 In
Received: October 25, 2017 Revised: November 30, 2017
Accepted: December 11, 2017
Corresponding author: Dr. Jonghoo Lee, Department of Internal Medicine, Jeju National University Hospital, Jeju National University School of Medicine, 15 Aran 13-gil, Jeju 63241, Korea.
Tel: 82-64-717-1601, Fax: 82-64-717-1131, E-mail: [email protected]
•The authors have no financial conflicts of interest.
© Copyright: Yonsei University College of Medicine 2018
This is an Open Access article distributed under the terms of the Creative Com-mons Attribution Non-Commercial License (http://creativecomCom-mons.org/licenses/ by-nc/4.0) which permits unrestricted non-commercial use, distribution, and repro-duction in any medium, provided the original work is properly cited.
pISSN: 0513-5796 · eISSN: 1976-2437
addition, the sensitivity of DS is low, as it can only detect mu-tant DNA that makes up at least 25% of the total DNA content.4
Thus, several other assays have been created to increase sen-sitivity. The peptide nucleic acid (PNA) clamping method was recently approved by the Korean Food and Drug Administra-tion.5 PNAs are artificially synthesized polymers that can
strong-ly bind to complementary DNA sequences.6 PNA probes
sup-press PCR amplification of wild-type sequences, allowing for greater amplification of mutant sequences.6 Indeed, PNA
clamp-ing can be used to detect mutant alleles, even when present at levels 100-fold lower than wild-type alleles, and is less techni-cally complex than DS.7 However, the PNA clamping method
has a weakness in that it can only detect mutations for which primers have been individually designed.6 Thus, PNA
clamp-ing is not useful for detectclamp-ing novel mutations.6
Whether intratumoral heterogeneity in EGFR mutations is one of the mechanisms for resistance to EGFR-tyrosine kinase inhibitors (TKIs) remains controversial.8-11 Since responses to
EGFR-TKIs could be correlated with EGFR mutant content, molecular tests with high sensitivity for detecting EGFR muta-tions might help with discerning which patients would be un-likely to respond to EGFR-TKIs.
DS has low sensitivity and has not been directly compared with PNA clamping methods in a systematic manner with re-spect to predicting oncogenic alterations. Furthermore, it is not clear if the PNA clamping method is non-inferior to DS with respect to predicting patient responses to EGFR-TKIs based on mutation detection. Thus, the primary aim of this study was to investigate whether PNA clamping has a higher rate of de-tection of oncogenic alterations, compared to DS, in patients with NSCLC. We also assessed clinical responses to EGFR-TKIs according to EGFR mutation status identified using both of these detection methods.
MATERIAL AND METHODS
Data sources and search strategy
This meta-analysis was performed in accordance with the rec-ommendations on the conduct and reporting of systematic re-views and meta-analyses outlined by the Preferred Reporting Items for Systematic reviews and Meta-Analyses (PRISMA) statement.12 To identify relevant articles eligible for this
meta-analysis, we conducted a comprehensive search of three elec-tronic databases (MEDLINE, EMBASE, and the Cochrane Central Register) up to September 01, 2017 using the following search terms: PNA clamping, DS, next-generation sequenc-ing, pyrosequencsequenc-ing, lung cancer, lung adenocarcinoma, and NSCLC. As this study was a systematic review of published ar-ticles, neither informed consent nor ethics approval was re-quired. The references listed in relevant review articles were also searched manually.
Inclusion and exclusion criteria
In order to be included in our analysis, studies had to meet the following inclusion criteria: 1) directly compared PNA clamp-ing and DS; 2) included patients with a diagnosis of NSCLC; and 3) provided sufficient data to calculate absolute numbers of true-positive, false-positive, false-negative, and true-negative results. Studies published as full-length articles or letters in peer-reviewed English language journals were eligible for in-clusion. Review articles, case reports, commentaries, and stud-ies reporting outcomes but without raw data were excluded.
Data extraction and quality assessment
J-U.S. and J.L. independently conducted an extraction of poten-tially relevant articles, and reviewed each study in accordance with predefined eligibility criteria, after which data were ex-tracted. Any disagreements that arose during the process of study selection or data extraction were resolved by consensus. A predefined form was used to extract data from each study. The information extracted from selected studies consisted of patient demographics, study design, and objectives.
As recommended by the Cochrane Collaboration, we used the Quality Assessment of Diagnostic Accuracy Studies (QUA-DAS)-2 tool to evaluate the risk of bias in diagnostic test accu-racy.13 The QUADAS-2 tool consists of the four following key
domains: patient selection, index test, reference standard, and flow/timing of patient selection. Supplementary Fig. 1 (only on-line) summarizes the seven items selected to evaluate risk of bias and applicability. The possible answers to each item were “yes,” “no,” or “unclear,” corresponding to a low, high, and un-clear risk of bias, respectively. If a study was judged as “low” on all domains relating to bias or applicability, then it was as-signed an overall judgment of “low risk of bias” or “low con-cern regarding applicability.” If a study was judged “high” or “unclear” in one or more domains, then it was judged as either “at risk of bias” or having “concerns regarding applicability.” Discrepancies were resolved by discussion between the two authors (J-U.S. and J.L.).
Data synthesis and statistical analysis
The data are presented as mean values for continuous vari-ables and as frequencies (%) for categorical varivari-ables. For diag-nostic meta-analysis, we extracted the numbers of patients with true-positive, false-positive, false-negative, and true negative test results either directly or through a recalculation based on the reported measures of accuracy in combination with the prevalence and sample size of the included study. We calcu-lated pooled sensitivity and specificity, positive likelihood ratio (PLR), negative likelihood ratio (NLR), diagnostic odds ratio (DOR), and area under the receiver-operating characteristic curve (AUC) as point estimates with 95% confidence intervals (CIs).14 We additionally constructed summary
calculated pooled risk ratios (RR) and 95% CI. Between-study statistical heterogeneity was assessed using I2 and the
Co-chrane Q test.15 Heterogeneity was assessed using I2 statistics
on a scale of 0−100%. A fixed-effects model was used unless I2
was >50%, indicating a substantial level of between-study het-erogeneity, in which case a random-effects model was used.15
If substantial heterogeneity was found, analysis via meta-re-gression was performed to explore potential sources of bias.16
Publication bias was evaluated by Deeks’ funnel plot asym-metry test.17 A p-value<0.05 was considered statistically
signif-icant. Statistical analyses were performed with Meta-Disc software (version 1.4, Madrid, Spain), Stata statistical software (version 14.2, StataCorp LP, College Station, TX, USA), and Review Manager (version 5.3, Nordic Cochrane Centre, the Cochrane Collaboration, Copenhagen, Denmark).
RESULTS
Study search and characteristics and quality of included studies
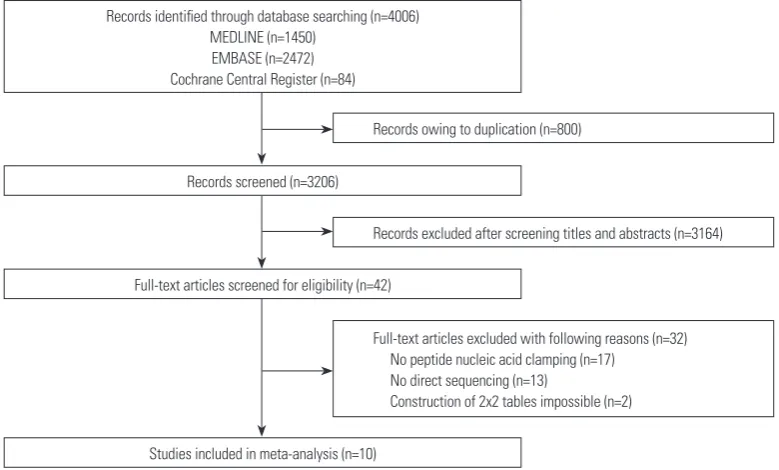
[image:3.595.110.500.486.721.2]The literature search process is shown in Fig. 1. A total of 4006 published articles were initially identified (1450 articles from MEDLINE, 2472 articles from EMBASE, and 84 articles from the Cochrane library). After removing duplicate articles, we screened 3206 potentially eligible articles. After reviewing ti-tles and abstracts, 3164 search records were removed, and the remaining 42 articles were further evaluated by reading the full text. Thirty-two articles were excluded for the reasons shown in Fig. 1. Finally, 10 studies were included in our final analy-sis.5, 7,18-25
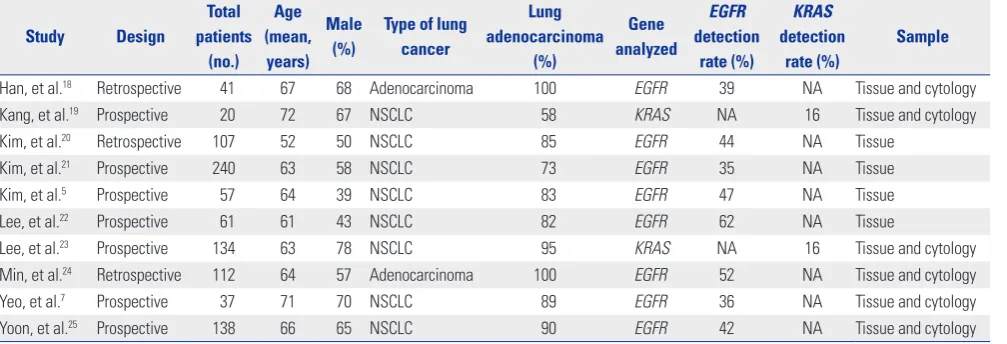
Table 1 summarizes the features of the included studies. Ten
studies involving 924 subjects met the defined inclusion crite-ria, and the numbers of patients in each trial ranged from 20 to 240. All studies were published between 2011 and 2016. Eight studies included results from NSCLC patients,5,7,19-23,25
and two studies included results solely from lung adenocarci-noma patients.18,24 The rates of lung adenocarcinoma in the
studies ranged from 58% to 100%.5,7,18-25 Eight studies were
evaluated for EGFR mutations, and the detection rates of EGFR mutation ranged from 35% to 62%.5,7,18,20-22,24,25 Two studies
re-ported on KRAS mutations, and the detection rate of KRAS mutation in those two studies was 16%.19,23
The QUADAS-2 assessment results are summarized in Sup-plementary Figs. 1 and 2 (only online). Overall, the quality of the included studies was deemed satisfactory. However, the QUADAS-2 tool identified unclear blinding during interpreta-tion of results and a lack of reporting interpretable results as potential sources of bias. In addition, reasons for withdrawal were not clearly explained in some studies, which could have also resulted in bias.
Diagnostic accuracy of PNA clamping and DS for detecting oncogenic alterations
Oncogenic alterations were detected in 340 of 924 cases (36.8%) with PNA clamping and in 250 of 924 cases (27.1%) with DS. With respect to PNA clamping, the pooled sensitivity and speci-ficity for oncogenic alteration detection were 0.93 (95% CI, 0.90 to 0.95; I2=64.6%, p=0.003) and 1.00 (95% CI, 0.99 to 1.00;
I2=0%, p=1.000), respectively (Fig. 2A and B). The pooled PLR
and NLR were 73.03 (95% CI, 30.50 to 174.85; I2=0%, p=0.885)
and 0.08 (95% CI, 0.04 to 0.16; I2=68.9%, p=0.001), respectively.
The DOR for PNA clamping was 1138.36 (95% CI, 396.94 to 3264.581; I2=0%, p=0.509). For DS, the pooled sensitivity and
Records owing to duplication (n=800)
Records excluded after screening titles and abstracts (n=3164)
Full-text articles excluded with following reasons (n=32) No peptide nucleic acid clamping (n=17)
No direct sequencing (n=13)
Construction of 2x2 tables impossible (n=2) Records identified through database searching (n=4006)
MEDLINE (n=1450) EMBASE (n=2472) Cochrane Central Register (n=84)
Records screened (n=3206)
Full-text articles screened for eligibility (n=42)
Studies included in meta-analysis (n=10)
specificity for detecting oncogenic alterations were 0.69 (95% CI, 0.64 to 0.73; I2=75.7%, p<0.001) and 1.00 (95% CI, 0.99 to
1.00; I2=0%, p=1.000), respectively (Fig. 2C and D). The pooled
PLR and NLR were 52.59 (95% CI, 21.84 to 126.65; I2=0%,
p=0.856) and 0.34 (95% CI, 0.24 to 0.47; I2=76.5%, p<0.001),
re-spectively. The DOR for DS was 184.66 (95% CI, 71.22 to 478.81; I2=0%, p=0.623).
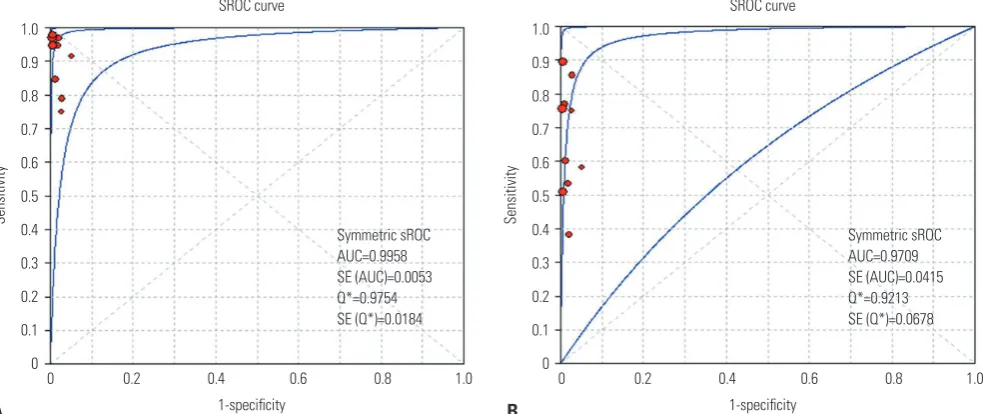
The SROC curves for the PNA clamping and DS tools with respect to predicting oncogenic alterations are shown in Fig. 3. The AUC was 0.996 [standard error (SE)=0.005] for PNA clamping and 0.971 (SE=0.042) for DS. Lastly, although Deeks’ funnel plots showed asymmetric, there was no statistically sig-nificance of potential publication bias (p=0.07 for PNA clamp-ing and p=0.15 for DS) (Supplementary Fig. 3, only online).
Diagnostic accuracy of PNA clamping and DS for
detecting EGFR mutations
We retrieved data on the PNA clamping and DS molecular tests for detecting EGFR mutations from eight trials.5,7,18,20-22,24,25 EGFR
mutations were detected in 316 of 770 cases (41.0%) with PNA clamping and in 228 of 770 cases (29.6%) with DS. For PNA clamping, the pooled sensitivity and specificity for detecting EGFR mutations were 0.92 (95% CI, 0.89 to 0.95; I2=67.8%,
p=0.003) and 1.00 (95% CI, 0.99 to 1.00; I2=0%, p=1.000),
respec-tively (Supplementary Fig. 4A and B, only online). The pooled PLR and NLR were 70.70 (95% CI, 26.74 to 186.89; I2=0%,
p=0.856) and 0.08 (95% CI, 0.04 to 0.16; I2=72.3%, p=0.001),
re-spectively. The DOR was 1113.71 (95% CI, 359.34 to 3451.76; I2=0%, p=0.546). For DS, the pooled sensitivity and specificity
of the detection of EGFR mutations were 0.67 (95% CI, 0.62 to 0.72; I2=75.8%, p<0.001) and 1.00 (95% CI, 0.99 to 1.00; I2=0%,
p=1.000), respectively (Supplementary Fig. 4C and D, only on-line). The pooled PLR and NLR were 47.52 (95% CI, 17.84 to 126.62; I2=0%, p=0.820) and 0.36 (95% CI, 0.27 to 0.49; I2=
76.6%, p<0.001), respectively. The DOR was 145.69 (95% CI, 51.95 to 408.57; I2=0%, p=0.688). The SROC curves for
predict-ing EGFR mutations in the two groups are shown in Supple-mentary Fig. 5 (only online). The AUCs were 0.993 [standard er-ror (SE)=0.009] for PNA clamping and 0.951 (SE=0.072) for DS.
Meta-regression for PNA clamping in detecting oncogenic alterations
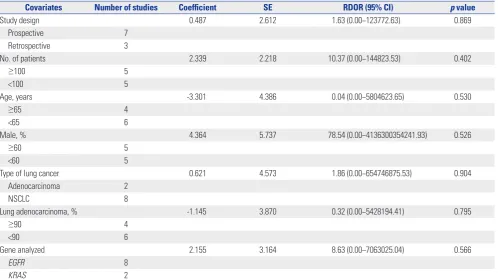
A substantial degree of heterogeneity was founded in the sen-sitivities and pooled LRs for both groups. Table 2 shows the results of meta-regression analyses for identifying potential sources of heterogeneity with respect to the diagnostic perfor-mance of PNA clamping for detecting oncogenic alterations in patients with NSCLC. Specifically, we investigated study design, sample size, age, proportion of males, type of lung can-cer, rate of lung adenocarcinoma, and genes analyzed as prob-able sources of heterogeneity, and there were no significant factors identified.
Comparison of clinical responses to EGFR-TKIs
according to EGFR mutations detected by PNA
clamping and DS
We retrieved data on clinical responses to EGFR-TKIs from seven trials (Fig. 4).5,7,18,20-22,25 Objective responses to
EGFR-TKIs therapy for patients with EGFR mutations detected by PNA clamping were not significantly different from those of patients with EGFR mutations detected by DS (53.4% vs. 50.8%; RR, 0.99; 95% CI 0.83 to 1.19; I2=0%, p=0.874).
DISCUSSION
[image:4.595.43.547.87.259.2]In the present study, we compared the effectiveness of DS and PNA clamping for predicting oncogenic alterations in patients with NSCLC using a systemic review and meta-analysis ap-proach. Oncogenic alterations were detected in 340 of 924 cases (36.8%) with PNA clamping and in 250 of 924 cases (27.1%) with DS. We found that PNA clamping had a sensitivity of 93% Table 1. Characteristics of the Studies Included in the Meta-Analysis
Study Design
Total patients
(no.) Age (mean,
years) Male
(%)
Type of lung cancer
Lung adenocarcinoma
(%)
Gene analyzed
EGFR detection
rate (%)
KRAS detection
rate (%)
Sample
Han, et al.18 Retrospective 41 67 68 Adenocarcinoma 100 EGFR 39 NA Tissue and cytology
Kang, et al.19 Prospective 20 72 67 NSCLC 58 KRAS NA 16 Tissue and cytology
Kim, et al.20 Retrospective 107 52 50 NSCLC 85 EGFR 44 NA Tissue
Kim, et al.21 Prospective 240 63 58 NSCLC 73 EGFR 35 NA Tissue
Kim, et al.5 Prospective 57 64 39 NSCLC 83 EGFR 47 NA Tissue
Lee, et al.22 Prospective 61 61 43 NSCLC 82 EGFR 62 NA Tissue
Lee, et al.23 Prospective 134 63 78 NSCLC 95 KRAS NA 16 Tissue and cytology
Min, et al.24 Retrospective 112 64 57 Adenocarcinoma 100 EGFR 52 NA Tissue and cytology
Yeo, et al.7 Prospective 37 71 70 NSCLC 89 EGFR 36 NA Tissue and cytology
Yoon, et al.25 Prospective 138 66 65 NSCLC 90 EGFR 42 NA Tissue and cytology
Sensitivity (95% CI) Han, et al.18 1.00 (0.79−1.00)
Kang, et al.19 1.00 (0.03−1.00)
Kim, et al.20 0.96 (0.86−1.00)
Kim, et al.21 0.98 (0.92−1.00)
Kim, et al.5 0.96 (0.82−1.00)
Lee, et al.22 0.80 (0.65−0.90)
Lee, et al.23 1.00 (0.85−1.00)
Min, et al.24 0.85 (0.75−0.93)
Yeo, et al.7 1.00 (0.48−1.00)
Yoon, et al.25 0.96 (0.85−0.99)
Pooled sensitivity=0.93 (0.90 to 0.95) Chi-square=25.42; df=9 (p=0.0025) Inconsistency (I-square)=64.6%
Sensitivity
0 0.2 0.4 0.6 0.8 1.0
Sensitivity (95% CI) Han, et al.18 0.38 (0.15−0.65)
Kang, et al.19 1.00 (0.03−1.00)
Kim, et al.20 0.78 (0.63−0.88)
Kim, et al.21 0.76 (0.65−0.85)
Kim, et al.5 0.54 (0.34−0.72)
Lee, et al.22 0.86 (0.73−0.95)
Lee, et al.23 0.91 (0.72−0.99)
Min, et al.24 0.60 (0.48−0.72)
Yeo, et al.7 0.60 (0.15−0.95)
Yoon, et al.25 0.51 (0.36−0.66)
Pooled sensitivity=0.69 (0.64 to 0.73) Chi-square=25.42; df=9 (p=0.0000) Inconsistency (I-square)=75.7%
Sensitivity
0 0.2 0.4 0.6 0.8 1.0
Specificity (95% CI) Han, et al.18 1.00 (0.86−1.00)
Kang, et al.19 1.00 (0.82−1.00)
Kim, et al.20 1.00 (0.94−1.00)
Kim, et al.21 1.00 (0.98−1.00)
Kim, et al.5 1.00 (0.88−1.00)
Lee, et al.22 1.00 (0.80−1.00)
Lee, et al.23 1.00 (0.97−1.00)
Min, et al.24 1.00 (0.92−1.00)
Yeo, et al.7 1.00 (0.66−1.00)
Yoon, et al.25 1.00 (0.96−1.00)
Pooled specificity=1.00 (0.99 to 1.00) Chi-square=0.00; df=9 (p=1.0000) Inconsistency (I-square)=0.0%
Sensitivity
0 0.2 0.4 0.6 0.8 1.0
Specificity (95% CI) Han, et al.18 1.00 (0.86−1.00)
Kang, et al.19 1.00 (0.82−1.00)
Kim, et al.20 1.00 (0.94−1.00)
Kim, et al.21 1.00 (0.98−1.00)
Kim, et al.5 1.00 (0.88−1.00)
Lee, et al.22 1.00 (0.80−1.00)
Lee, et al.23 1.00 (0.97−1.00)
Min, et al.24 1.00 (0.92−1.00)
Yeo, et al.7 1.00 (0.66−1.00)
Yoon, et al.25 1.00 (0.96−1.00)
Pooled specificity=1.00 (0.99 to 1.00) Chi-square=0.00; df=9 (p=1.0000) Inconsistency (I-square)=0.0%
Specificity
0 0.2 0.4 0.6 0.8 1.0
C
A B
[image:5.595.60.553.72.437.2]D
Fig. 2. Paired forest plots of the sensitivity and specificity of peptide nucleic acid clamping (A and B) and direct sequencing (C and D) for the detection of oncogenic alterations. CI, confidence interval.
1-specificity 1-specificity
Symmetric sROC AUC=0.9958 SE (AUC)=0.0053 Q*=0.9754 SE (Q*)=0.0184
Symmetric sROC AUC=0.9709 SE (AUC)=0.0415 Q*=0.9213 SE (Q*)=0.0678
SROC curve SROC curve
0 0.2 0.4 0.6 0.8 1.0 0 0.2 0.4 0.6 0.8 1.0
1.0
0.9
0.8
0.7
0.6
0.5
0.4
0.3
0.2
0.1
0
1.0
0.9
0.8
0.7
0.6
0.5
0.4
0.3
0.2
0.1
0
Sensitivity Sensitivity
Fig. 3. SROC curves for peptide nucleic acid clamping (A) and direct sequencing (B) for the detection of oncogenic alterations. SROC, summary re-ceiver operating characteristic; AUC, area under the curve; SE, standard error.
[image:5.595.61.553.484.691.2]for detecting oncogenic alterations, which was higher than the 69% sensitivity for DS. Subgroup analysis showed that PNA clamping had a sensitivity of 92% for detecting EGFR muta-tions, which was higher than the 67% sensitivity for DS. Al-though substantial heterogeneity was identified in the pooled estimates in both groups, potential sources of heterogeneity were not identified in a meta-regression analysis. In addition, there was no evidence of publication bias. Lastly, there was no
significant difference in objective responses to EGFR-TKIs treatment between patients whose EGFR mutations were de-tected by PNA clamping or DS.
[image:6.595.43.542.85.365.2]Molecular testing for oncogenic alterations has become an essential part of identifying patients eligible for treatment with targeted therapeutic agents. EGFR mutations are representa-tive of treatable oncogenic alterations. Indeed, several ran-domized control trials have reported that NSCLC patients with Table 2. Meta-Regression Analysis to Identify Potential Sources of Heterogeneity
Covariates Number of studies Coefficient SE RDOR (95% CI) p value
Study design 0.487 2.612 1.63 (0.00−123772.63) 0.869
Prospective 7
Retrospective 3
No. of patients 2.339 2.218 10.37 (0.00−144823.53) 0.402
≥100 5
<100 5
Age, years -3.301 4.386 0.04 (0.00−5804623.65) 0.530
≥65 4
<65 6
Male, % 4.364 5.737 78.54 (0.00−4136300354241.93) 0.526
≥60 5
<60 5
Type of lung cancer 0.621 4.573 1.86 (0.00−654746875.53) 0.904
Adenocarcinoma 2
NSCLC 8
Lung adenocarcinoma, % -1.145 3.870 0.32 (0.00−5428194.41) 0.795
≥90 4
<90 6
Gene analyzed 2.155 3.164 8.63 (0.00−7063025.04) 0.566
EGFR 8
KRAS 2
SE, standard error; RDOR, relative diagnostic odds ratio; CI, confidence interval; EGFR, epidermal growth factor receptor; NSCLC, non-small cell lung cancer.
Han, et al.18
Kim, et al.20
Kim, et al.21
Kim, et al.5
Lee, et al.22
Yeo, et al.7
Yoon, et al.25
Overall (I-squared=0.0%, p=0.874)
0.94 (0.64–1.40) 5.70
0.97 (0.64–1.46) 21.01
0.90 (0.64–1.27) 33.94
0.81 (0.50–1.33) 10.26
1.19 (0.58–2.46) 9.11
1.00 (0.45–2.23) 3.80
1.21 (0.85–17.4) 16.18
0.99 (0.83–1.19) 100.00
Study ID Favors DS Favors PNA clamping RR (95% CI) % Weight
[image:6.595.110.488.390.602.2]0.406 1 2.46
EGFR mutations are more responsive to EGFR-TKIs and have a prolonged survival rate, compared to patients with non-mu-tated EGFR lung cancer.1 Thus, because EGFR mutation is a
crucial prognostic biomarker for drug response, efficient de-tection of EGFR mutations is helpful for prolonging the sur-vival of patients with NSCLC through targeted therapy.
DS can detect mutant DNA comprising ≥25% of the total DNA.26 However, the samples available for mutational
analy-sis in lung cancer are frequently limited due to small tissue bi-opsy size or use of cytological specimens.18 Our results
con-firmed that the sensitivity of DS was low for detecting oncogenic alterations in NSCLC, and suggest the need for improved mo-lecular testing methodologies. A number of sensitive detec-tion methods have been developed based on the close reladetec-tion- relation-ship between treatable oncogenic alteration status and response to targeted agents. Among these methods, our pooled estimates demonstrated that PNA clamping was more sensitive than DS. In addition, PNA clamping is rapid and simple to conduct, and can detect mutant alleles comprising as little as approximately 1% of mutant alleles.6
Obtaining a sufficient amount of sample is critical for being able to perform both pathologic examination and mutation analysis. However, because many patients with NSCLC have advanced stage disease at the time of diagnosis, they frequently have inoperable disease and poor performance status. Thus, they often are not candidates for surgical treatment or inva-sive diagnostic procedures, which can often lead to a failure of obtaining a sufficient sample for analysis. Indeed, in some pa-tients, the amount of diagnostic sample or cytological speci-men is insufficient to permit additional molecular analysis after routine pathologic examination.19 Considering the frequency
at which a very small amount of sample is obtained from NSCLC patients, PNA clamping has the potential to be very useful in clinical settings. Indeed, previous studies have revealed that the diagnostic performance of PNA clamping for detection of oncogenic alterations in NSCLC is favorable for cytology speci-mens, such as pleural effusions, as well as tumor tissue.7,19
However, to improve the rate of detection of oncogenic altera-tions, proper tissue handling, including timing of tissue sam-ple acquisition, shorter fixation time, and DNA quality control, continue to be important.27
EGFR mutations can accumulate during tumor progression; thus, there is potential for heterogeneous EGFR status within tumors. In addition, multiple different EGFR mutations in a single tumor specimen have been reported; for this reason, heterogeneity of EGFR mutations has been suggested as one of the causes of resistance to EGFR TKIs.8-10 Such intratumor
heterogeneity of EGFR mutations could also partially explain why some patients with wildtype EGFR respond to EGFR-TKIs, whereas some patients with EGFR mutations fail to re-spond to EGFR-TKIs.18 A prospective study revealed that
pa-tients with heterogeneous EGFR mutation status do not re-spond well to EGFR-TKIs (gefitinib), and experience a
signifi-cantly reduced time to progression and overall survival after gefitinib treatment, compared to patients with EGFR-mutant tu-mor cells.9 Because of the high sensitivity of PNA clamping, we
were concerned that patients with a low burden of EGFR mu-tations detected by PNA clamping might also have a lower ob-jective response to EGFR-TKIs than those detected by DS. How-ever, according to pooled estimates, there was no significant difference in objective responses to EGFR-TKIs according to the method of mutation detection.
A recent prospective study reported that heterogeneity of EGFR mutations is extremely rare in lung adenocarcinoma, with the authors instead suggesting that reported findings of heterogeneity are better explain as “pseudoheterogeneity” at-tributable to mutant-allele specific imbalance and heteroge-neously distributed EGFR amplification.11 In addition, because
EGFR mutations can be detected in precancerous lesions, a large portion of invasive adenocarcinomas would contain EGFR mutations.11 The clinical implications of the difference
between true heterogeneity and pseudoheterogeneity contin-ue to be limited.18 Thus, further studies are needed to
deter-mine whether there are differences in other treatable oncogen-ic alterations detected by either DS or the PNA clamping method and if these are associated with differences in treatment re-sponses to targeted therapy in NSCLC.
To the best of our knowledge, this is the first meta-analysis to compare PNA clamping and DS for predicting oncogenic alterations in NSCLC and to assess potential predictive bio-markers of response for EGFR-TKIs treatment. Our findings could be helpful for physicians implementing PNA clamping in clinical practice. However, there were some limitations to the present study that should be considered when interpret-ing our results. First, since our meta-analysis was based on a relatively small number of trials, our results should be inter-preted with caution due to limited statistical power. Second, there was substantial heterogeneity among the included stud-ies, although large heterogeneities are commonly seen in sys-tematic reviews of studies on diagnostic test accuracy.28
Varia-tions in baseline characteristics of the selected studies could have also potentially introduced heterogeneity. Third, 10 stud-ies are too small to test for funnel plot asymmetry. Although there was no evidence of publication bias according to our analysis using the Deeks’ test, the possibility could not be ex-cluded. Considering of potential publication bias for small study effect, we additionally conducted the Begg’s test and the Egger’s test. For PNA clamping and DS, p-values of the two tests indi-cated that there also was no publication bias in the meta-analy-sis (0.592 and 0.691 for the Begg’s test and 0.721 and 0.724 for the Egger’s test, respectively).
re-spect to objective responses to EGFR-TKIs therapy, there were no significant differences between patients whose EGFR mu-tations were detected by PNA clamping or DS. Our findings provide evidence that PNS clamping is more useful than DS among the current methods for molecular testing in NSCLC.
ORCID
Jae-Uk Song https://orcid.org/0000-0003-4597-7037 Jonghoo Lee https://orcid.org/0000-0003-2626-7099
REFERENCES
1. Reck M, Rabe KF. Precision diagnosis and treatment for advanced non-small-cell lung cancer. N Engl J Med 2017;377:849-61. 2. Won JK, Keam B, Koh J, Cho HJ, Jeon YK, Kim TM, et al.
Concom-itant ALK translocation and EGFR mutation in lung cancer: a comparison of direct sequencing and sensitive assays and the impact on responsiveness to tyrosine kinase inhibitor. Ann Oncol 2015;26:348-54.
3. Lindeman NI, Cagle PT, Beasley MB, Chitale DA, Dacic S, Giaccone G, et al. Molecular testing guideline for selection of lung cancer patients for EGFR and ALK tyrosine kinase inhibitors: guideline from the College of American Pathologists, International Associa-tion for the Study of Lung Cancer, and AssociaAssocia-tion for Molecular Pathology. Arch Pathol Lab Med 2013;137:828-60.
4. Pao W, Ladanyi M. Epidermal growth factor receptor mutation testing in lung cancer: searching for the ideal method. Clin Can-cer Res 2007;13:4954-5.
5. Kim HS, Sung JS, Yang SJ, Kwon NJ, Jin L, Kim ST, et al. Predictive efficacy of low burden EGFR mutation detected by next-genera-tion sequencing on response to EGFR tyrosine kinase inhibitors in non-small-cell lung carcinoma. PLoS One 2013;8:e81975. 6. Lee KY, Kim HJ, Kim SJ, Yoo GH, Kim WD, Oh SY, et al.
PNA-me-diated PCR clamping for the detection of EGFR mutations in non-small cell lung cancer. Tuberc Respir Dis 2010;69:271-8.
7. Yeo CD, Kim JW, Kim KH, Ha JH, Rhee CK, Kim SJ, et al. Detec-tion and comparison of EGFR mutaDetec-tions in matched tumor tis-sues, cell blocks, pleural effusions, and sera from patients with NSCLC with malignant pleural effusion, by PNA clamping and direct sequencing. Lung Cancer 2013;81:207-12.
8. Sakurada A, Lara-Guerra H, Liu N, Shepherd FA, Tsao MS. Tissue heterogeneity of EGFR mutation in lung adenocarcinoma. J Tho-rac Oncol 2008;3:527-9.
9. Taniguchi K, Okami J, Kodama K, Higashiyama M, Kato K. Intra-tumor heterogeneity of epidermal growth factor receptor muta-tions in lung cancer and its correlation to the response to gefitinib. Cancer Sci 2008;99:929-35.
10. Yeh YC, Chou TY. Pulmonary adenocarcinoma with microcystic histology and intratumoral heterogeneity of EGFR gene polymor-phism. Histopathology 2010;57:112-20.
11. Yatabe Y, Matsuo K, Mitsudomi T. Heterogeneous distribution of EGFR mutations is extremely rare in lung adenocarcinoma. J Clin Oncol 2011;29:2972-7.
12. Moher D, Liberati A, Tetzlaff J, Altman DG; PRISMA Group. Pre-ferred reporting items for systematic reviews and meta-analyses: the PRISMA statement. Ann Intern Med 2009;151:264-9. 13. Whiting P, Rutjes AW, Reitsma JB, Bossuyt PM, Kleijnen J. The
de-velopment of QUADAS: a tool for the quality assessment of stud-ies of diagnostic accuracy included in systematic reviews. BMC Med Res Methodol 2003;3:25.
14. Reitsma JB, Glas AS, Rutjes AW, Scholten RJ, Bossuyt PM, Zwind-erman AH. Bivariate analysis of sensitivity and specificity produces informative summary measures in diagnostic reviews. J Clin Epi-demiol 2005;58:982-90.
15. Thompson SG. Why sources of heterogeneity in meta-analysis should be investigated. BMJ 1994;309:1351-5.
16. Lijmer JG, Mol BW, Heisterkamp S, Bonsel GJ, Prins MH, van der Meulen JH, et al. Empirical evidence of design-related bias in stud-ies of diagnostic tests. JAMA 1999;282:1061-6.
17. Deeks JJ, Macaskill P, Irwig L. The performance of tests of publica-tion bias and other sample size effects in systematic reviews of di-agnostic test accuracy was assessed. J Clin Epidemiol 2005;58: 882-93.
18. Han HS, Lim SN, An JY, Lee KM, Choe KH, Lee KH, et al. Detec-tion of EGFR mutaDetec-tion status in lung adenocarcinoma specimens with different proportions of tumor cells using two methods of dif-ferential sensitivity. J Thorac Oncol 2012;7:355-64.
19. Kang JY, Park CK, Yeo CD, Lee HY, Rhee CK, Kim SJ, et al. Com-parison of PNA clamping and direct sequencing for detecting KRAS mutations in matched tumour tissue, cell block, pleural effu-sion and serum from patients with malignant pleural effueffu-sion. Res-pirology 2015;20:138-46.
20. Kim HJ, Kim WS, Shin KC, Lee GH, Kim MJ, Lee JE, et al. Compara-tive analysis of peptide nucleic acid (PNA)-mediated real-time PCR clamping and DNA direct sequencing for EGFR mutation detec-tion. Tuberc Respir Dis 2011;70:21-7.
21. Kim HJ, Lee KY, Kim YC, Kim KS, Lee SY, Jang TW, et al. Detection and comparison of peptide nucleic acid-mediated real-time poly-merase chain reaction clamping and direct gene sequencing for epidermal growth factor receptor mutations in patients with non-small cell lung cancer. Lung Cancer 2012;75:321-5.
22. Lee HJ, Xu X, Kim H, Jin Y, Sun P, Kim JE, et al. Comparison of di-rect sequencing, PNA clamping-real time polymerase chain reac-tion, and pyrosequencing methods for the detection of EGFR mu-tations in non-small cell lung carcinoma and the correlation with clinical responses to EGFR tyrosine kinase inhibitor treatment. Korean J Pathol 2013;47:52-60.
23. Lee B, Lee B, Han G, Kwon MJ, Han J, Choi YL. KRAS mutation de-tection in non-small cell lung cancer using a peptide nucleic acid-mediated polymerase chain reaction clamping method and com-parative validation with next-generation sequencing. Korean J Pathol 2014;48:100-7.
24. Min KW, Kim WS, Jang SJ, Choi YD, Chang S, Jung SH, et al. Com-parison of EGFR mutation detection between the tissue and cytol-ogy using direct sequencing, pyrosequencing and peptide nucleic acid clamping in lung adenocarcinoma: Korean multicentre study. QJM 2016;109:167-73.
25. Yoon SH, Choi YD, Oh IJ, Kim KS, Choi H, Chang J, et al. Peptide nucleic acid clamping versus direct sequencing for the detection of EGFR gene mutation in patients with non-small cell lung can-cer. Cancer Res Treat 2015;47:661-9.
26. Endo K, Konishi A, Sasaki H, Takada M, Tanaka H, Okumura M, et al. Epidermal growth factor receptor gene mutation in non-small cell lung cancer using highly sensitive and fast TaqMan PCR assay. Lung Cancer 2005;50:375-84.
27. Pirker R, Herth FJ, Kerr KM, Filipits M, Taron M, Gandara D, et al. Consensus for EGFR mutation testing in non-small cell lung can-cer: results from a European workshop. J Thorac Oncol 2010;5: 1706-13.