Georgia State University
ScholarWorks @ Georgia State University
Public Health Theses School of Public Health
1-5-2018
The Impact of Supplemental Nutrition Assistance
Program and Acculturation on Obesity among
Adult Immigrant Groups in the United States
Sashoy Patterson
Follow this and additional works at:https://scholarworks.gsu.edu/iph_theses
This Thesis is brought to you for free and open access by the School of Public Health at ScholarWorks @ Georgia State University. It has been accepted for inclusion in Public Health Theses by an authorized administrator of ScholarWorks @ Georgia State University. For more information, please contact [email protected].
Recommended Citation
Patterson, Sashoy, "The Impact of Supplemental Nutrition Assistance Program and Acculturation on Obesity among Adult Immigrant Groups in the United States." Thesis, Georgia State University, 2018.
ABSTRACT
THE IMPACT OF SUPPLEMENTAL NUTRITION ASSISTANCE PROGRAM AND ACCULTURATION ON OBESITY AMONG ADULT IMMIGRANT GROUPS IN THE UNITED STATES
By
SASHOY J. PATTERSON
DECEMBER 4, 2017
INTRODUCTION:
Obesity is a dangerous, costly and common condition that has more than doubled worldwide since 1980 and affects greater than one-third (~37%) of adults in the United States. Studies have shown that minority groups have disproportionately high rates of obesity and that there is an overall positive association between immigrant length of residency in the U.S. and obesity. Immigrant families are incredibly likely to experience poverty in their new host environment—limiting them to low-cost high-density foods. The Supplemental Nutrition Assistance Program (SNAP) was implemented to promote behaviors that can reduce the impact of obesity and improve nutrition levels among low-income families in America. The trend of obesity has been examined across demographic groups. However, less is known about the pattern among immigrant groups. This study aimed to investigate the association between acculturation and obesity among immigrant groups and to assess if SNAP participation modifies this association.
METHODS:
Data from the cross-sectional study, the National Health and Nutrition Examination Survey 2009-2014, was used on 3,759 non-U.S. born individuals ≥ 20 years. Obesity was assessed using BMI and
acculturation was measured by length of residency in the United States along with self-reported nativity. Chi-square analyses were performed for bivariate comparisons between acculturation status and
sociodemographic variables, including obesity and SNAP participation status. Following this, a univariate analysis of obesity and all variables in the study was performed. After that was the computation of logistic regression models among the sample population testing for the effect of acculturation on obesity.
RESULTS:
remained positive after controlling for all covariates and SNAP participation did not affect the
relationship between acculturation and obesity, but it did, however, increase the risk of obesity overall.
DISCUSSION:
THE IMPACT OF SUPPLEMENTAL NUTRITION ASSISTANCE PROGRAM AND ACCULTURATION ON OBESITY AMONG ADULT IMMIGRANT GROUPS IN THE UNITED STATES
by
SASHOY J. PATTERSON
B.S., GEORGIA STATE UNIVERSITY
A Thesis Submitted to the Graduate Faculty of Georgia State University in Partial Fulfillment
of the
Requirements for the Degree
MASTER OF PUBLIC HEALTH
APPROVAL PAGE
THE IMPACT OF SUPPLEMENTAL NUTRITION ASSISTANCE PROGRAM AND ACCULTURATION ON OBESITY AMONG ADULT IMMIGRANT GROUPS IN THE UNITED STATES
by
SASHOY J. PATTERSON
Approved:
__Ike Okosun, PhD__ Committee Chair
__Ruiyan Luo, PhD_____ Committee Member
Acknowledgments
I would like to thank my committee members Dr. Ike Okosun and Dr. Ruiyan Luo for their support and guidance throughout my thesis and my MPH program. I would also like to extend gratitude to the entire SPH faculty and staff as they all played a role in my success throughout this program.
I am very appreciative and fortunate to have a strong support team consisting of my family, friends and loved ones.
Author’s Statement Page
In presenting this thesis as a partial fulfillment of the requirements for an advanced degree from Georgia State University, I agree that the Library of the University shall make it available for inspection and circulation in accordance with its regulations governing materials of this type. I agree that permission to quote from, to copy from, or to publish this thesis may be granted by the author or, in his/her absence, by the professor under whose direction it was written, or in his/her absence, by the Associate Dean, School of Public Health. Such quoting, copying, or publishing must be solely for scholarly purposes and will not involve potential financial gain. It is understood that any copying from or publication of this dissertation which involves potential financial gain will not be allowed without written permission of the author.
TABLE OF CONTENTS
ACKNOWLEDGMENTS ...iii
LIST OF TABLES………...vi
INTRODUCTION...1
1.1 Background……….………...1
1.2 Aims of the Study………..………..3
LITERATURE REVIEW...3
2.1 Obesity……..………...…….3
2.2 Acculturation………..………….4
2.3 Acculturation and Obesity………..………5
2.4 Supplemental Nutrition Assistance Program…….………..………...7
METHODS ………...9
3.1 Study Population.……….…….9
3.2 Study Measures….………..………..9
3.3 Covariates…………...10
3.4 Statistical Analysis...10
RESULTS...11
4.1 Frequencies and Descriptive Statistics.………..………...11
4.2 Univariate Analysis………...12
4.3 Multivariate Analysis………...14
DISCUSSION AND CONCLUSION...16
5.1 Discussion………...16
5.2 Strengths and Limitations…………..………...17
5.3 Conclusion……….…………..18
List of Tables
Table 1. Baseline Characteristics of Study Sample
Table 2. The Association between Acculturation and Obesity by SNAP Status
Table 3. Univariate Analysis of the Association of Obesity with Sociodemographic Variables,
Acculturation, and SNAP
Table 4. Adjusted Multivariate Analysis for the Association between Acculturation and Obesity
EXCLUDING SNAP
Table 5. Adjusted Multivariate Analysis for the Association between Acculturation and Obesity
I. Introduction
1.1 Background
Obesity is a serious, costly and common condition. It has more than doubled worldwide
since 1980 and affects greater than one-third (~37%) of adults in the United States (U.S.)
(Centers for Disease Control and Prevention [CDC], 2017). Research has well established the
negative health effects of obesity; it puts individuals at risk for more than 30 chronic health
conditions. These conditions include type II diabetes, heart disease, stroke, and cancer, in
addition to a reduction in life expectancy (CDC, 2017). There is growing evidence suggesting
that obesity in the U.S. is not equally shared across the population. The highest rates of obesity
falls among non-Hispanic blacks (48.1%), followed by Hispanics (42.5%), non-Hispanic whites
(34.5%), and non-Hispanic Asians (11.7%) (CDC, 2017).
Factors such as lack of physical activity, high amounts of stress, and unhealthy
eating patterns increases the risk of obesity. These same factors are often associated with
acculturation. The immigrant (defined as a person who comes to live in a foreign country)
population in the U.S. has quadrupled in the last four decades (Singh, Siahpush, Hiatt, &Timsina,
2011), and is the largest growing portion of the U.S. population (Goel, McCarthy,
Phillips,&Wee,2004). Individuals who migrate to the U.S. mainly come from low-income
countries with low incidence of obesity, though with increase in exposure to U.S. environment,
immigrants begin to adopt native-born behaviors leading to adverse health issues (Anectol &
Bedard, 2006). Adoption of poorer lifestyles and diet results in the loss of the protective health
behaviors that are associated with the native cultures of immigrants. (Kaplan, Huguet, Newsom,
of obesity and that there is an overall positive association between immigrant length of residency
in the U.S. and obesity. In addition, immigrant families are extremely likely to experience
poverty in their new host environment—limiting them to low-cost high-density foods.(NCCP,
2017).
More than 50 years ago, the Supplemental Nutrition Assistance Program (SNAP) was
implemented to alleviate hunger in the U.S. (SNAP, 2017) This federal entitlement program was
formulated to improve the nutritional status of low-income families and to eliminate food
insecurity in America. Households that meet the eligibility requirements are awarded monthly
benefits to purchase food. (Project Bread’s GettingSNAP.Org., 2017) Some studies found that
SNAP benefits increase body mass index (BMI) and the probability of being obese, while others
found that the benefits reduce or have no effect on obesity prevalence.
Obesity rates are increasing among all groups. Researchers have examined the trends of
this condition across demographic groups, however, less is known about the trend among
immigrant groups. (Singh et al., 2011). This study aims to examine the association between
acculturation and obesity among immigrant minority groups, and to assess if SNAP participation
modifies this association. Due to large disparities in obesity prevalence between racial and ethnic
groups, as well as contradicting reports about SNAP and its association with obesity, studies
such as this is warranted in order to aid in closing this gap in knowledge and improve policy
1.2 Aims
1. To assess the association between acculturation of immigrant groups in the U.S. and
obesity
2. To assess if the use of SNAP modifies the relationship between acculturation of
immigrant groups in the U.S. and obesity
II. Literature Review
2.1 Obesity
Obesity is defined as excess adipose tissue, and is usually caused by energy imbalances.
An imbalance of energy means that the energy or calories taken in do not equal the amount of
calories being expelled. Over time, individuals develop obesity when they take in more calories
than they put out—causing a storage of fat in the body (NHLBI, 2017).Factors such as lack of
physical activity, high amounts of stress, and unhealthy eating patterns increases the risk of
obesity (NHLBI, 2017).The reported annual medical cost of obesity in the U.S. reached $147
billion in 2008 and numbers have been increasing. Overall, individuals who are obese spend 42%
more in medical costs than individuals of normal weight (Finkelstein, Trogdon, Cohen, &Dietz,
2009). BMI, which is a measure of body fat based on a person’s height and weight, is the most
commonly used screening tool for obesity. A BMI of 30 or higher indicates obesity, while a BMI
of 18.5-25 falls within the normal body mass range (CDC, 2017).
The prevalence of obesity vary by race, sex, age and socioeconomic status. The highest
rates of obesity falls among non-Hispanic blacks (48.1%) and the lowest among non-Hispanic
Asians (11.7%). The condition is more prevalent among adults aged 40-59 years (40.2%), when
From their study conducted in Mississippi, Qobadi and Payton found that the rate of
obesity was significant among individuals aged 25-44, those who were physically inactive and
those who were unemployed. This finding however did not find any racial disparities among the
groups being studied--non-Hispanic blacks and non-Hispanic whites. On the other hand, racial
disparities in the prevalence of obesity was present by gender and education. The obesity rate
was higher among African American women as compared to African American men, but there
was no significant difference in the rate among Hispanic whites by gender. In addition,
non-Hispanic white adults with a college degree had a much lower prevalence of obesity, while these
levels were not significant among non-Hispanic black adults by education. Overall, the rate of
obesity was found to be higher among non-Hispanic blacks than non-Hispanic whites.
(Qobadi&Payton, 2017).
2.2 Acculturation
Acculturation refers to a sociocultural process where individuals of one cultural group
encounter people, groups, and social influences of another culture (Schwartz, Unger,
Zamboanga, &Szapocznik, 2010). More specifically, it is an interaction of two aspects: adopting
the values, beliefs, and attitudes of the receiving culture and retaining the values, beliefs, and
attitudes of the immigrant individual’s native culture (Lopez-Class, Castro, &Ramirezde, 2011).
The unidimensional approach is that as immigrants move towards the mainstream culture of their
new host environment, they move further away from their original culture
(https://link.springer.com/article/10.1007/s10903-014-0027-6). The adjustments associated with
acculturation can be extreme, such as changes in language, socioeconomic status, and living
environment (Lopez-Class et al., 2011).Because of the numerous challenges and life changes,
Due to the conceptualization from various perspectives, several scales have been
developed in order to measure acculturation. Public health researchers most often use proxy
measures based on the assumption that the more an individual is exposed to their new host
country, the more acculturated they become. These proxy measures include length of residency
in the new host country, percent of lifetime spent in the new host country, nativity, and English
proficiency. (Lee, Nguyen, &Tsui, 2009)
2.3 Acculturation and Obesity
Studies have shown an overall positive association between acculturation and obesity.
Researchers that examined obesity prevalence among immigrants as their length of stay in the
U.S. progressed, mostly concluded that obesity increases with length of stay (Kaushal, 2009).
Publications have also reported that the majority of individuals from low- to medium-income
countries who have migrated to high-income countries are usually more susceptible to being
overweight and obese as compared to their local counterparts (Delavari, Sønderlund,
Swinburn,Mellor,&Renzaho, 2013).
i. Hispanic
Kaplan et al. performed a study assessing the length of residence in the
U.S. of Hispanic immigrants on obesity prevalence, using data from the
National Health Interview Survey. They concluded that Hispanic
immigrants who resided in the U.S. longer (≥15 years) experienced an
almost four-fold increase in obesity prevalence than recent immigrants (<
5 years). (Kaplan et al., 2004).Data from the National Health and Nutrition
Examination Survey (NHANES) 2009-2010 was used by Isasi et al. to
observed that Hispanics who were born in the U.S., lived in the U.S.
longer or migrated to America at an early age had the highest prevalence
of obesity. They suggested that extended exposure to the U.S.
environment, conducive of diets filled with energy-dense foods and low
physical activity, could help to explain these results. (Isasi et al., 2015).
ii. African American
Bennett et al. (2007) executed a study that examined the associations of
immigrant generation, nativity, and language acculturation with obesity
among non-Hispanic black adults. They reported that when compared to
U.S.-born citizens, foreign-born blacks had a lower obesity risk (OR=
0.57; 95% CI 0.38, 0.84). The researchers also found that among
U.S.-born citizens, those with parents U.S.-born outside of the country were less
likely to be obese than those with U.S.-born parents (OR=0.54; 95% CI
0.37, 0.80). Additionally, Bennett et al. (2007) observed that the odds of
being obese was also decreased with low-moderate language acculturation
(OR= 0.45; 95% CI 0.23, 0.88).
(Bennett,Wolin,Askew,Fletcher,&Emmons, 2007).
iii. Asian
Antecol and Bedard(2006) conducted an analysis on Asian Americans
using data from California Health Interview Survey and found that Asian
immigrants initially had BMI measures 2-5% lower than U.S. born
individuals. However, after 10-15 years of U.S. residency, BMI of the
Furthermore, a study performed by Lauderdale and Rathouz(2000)
assessing six Asian American ethnicities revealed that there was a positive
correlation between length of stay in the U.S. and increasing BMI levels.
Park et al. showed that the association of obesity and acculturation was
weakest among Asian immigrants when compared to non-Hispanic black
and Hispanic immigrants (Park, Neckerman, Quinn, Weiss, & Rundle,
2008).
Though majority of the literature found a positive association, some researchers could not
replicate those findings or they found mixed results as to whether or not acculturation by length
of residency in the US or language was associated with an increase in obesity prevalence.
2.4 Supplemental Nutritional Assistance Program (SNAP)
In its efforts to alleviate the hunger crisis in America, the U.S. government established
the SNAP in 1964 (Gundersen, 2016). It was designed to promote behaviors that can reduce the
impact of obesity and improve nutrition levels among low-income families (SNAP, 2017). After
multiple revisions since its introduction, the basic eligibility requirements for SNAP are as
follows: the gross household income must be below 130% of the family size adjusted poverty
guideline, the net income must be below 100% of the guideline, and the value of the liquid assets
of a household must be less than$2,000. (Gundersen, 2016). Individuals must be a U.S. citizen or
an eligible, lawfully-present non-citizen to qualify for SNAP benefits.
The Family Nutrition Program and Food Stamp Nutrition Education, currently known as
SNAP-Ed, was implemented in 1988. It is a federally funded program that aims to expand
nutrition education and obesity prevention interventions to SNAP eligible individuals. The
nutrition. (USDA, 2017). It aims to teach people using or eligible for SNAP about good
nutrition and the importance of physical activity.
In 2012, Leung et al. used data from NHANES 1999-2008 to perform a dietary analysis
of SNAP participants vs. nonparticipants among income adults. They found that most
low-income adults exceeded recommended dietary limits, but SNAP participants had lower dietary
quality scores than nonparticipants. Furthermore, a more recent study conducted by Grummon
and Taillie (2017) examined household store purchases of participants and nonparticipants of
SNAP. Like the previous study, this study found lower purchases of healthy foods (ex: fruits and
vegetables) and higher purchases of junk foods and saturated fat. However, when compared to
income-eligible and high-income nonparticipants, SNAP participants purchased more unhealthy
foods. Baum (2011) concluded that SNAP participation is positively associated with obesity
among women. Fan (2010) found no evidence of association between SNAP participation and
obesity in his study. (Gundersen, 2016). The literature illustrates that most SNAP participants
have lower quality diets than nonparticipants, but contradicting reports about the program’s
effect on obesity exists.
III. Methods
3.1 Study Population
The National Health and Nutrition Examination Survey (NHANES) is a cross-sectional
study conducted to assess the health and nutrition of children and adults in the U.S., using a
combination of interviews and physical exams. This study used data on foreign-born participants
participants, 181 were excluded because they were missing data on acculturation, leaving an
analytic sample of 3,759.
3.2 Study Measures
Obesity
Obesity was assessed using BMI. Measured weight (kg) and height (m) were used to
calculate BMI (kg/m2). Obesity was defined as BMI ≥ 30 kg/m2.
Acculturation
This study used length of residency in the United States along with self-reported
nativity--foreign-born (born outside of the 50 U.S. stated or Washington DC) versus U.S.-born, as a
proxy measure of acculturation. Participants who were born outside of and resided in the U.S. ≤
15 years were classified as not acculturated and those born outside of and resided in the U.S. >15
years were considered acculturated.
3.3 Covariates
The following confounding sociodemographic and lifestyle variables: age, gender,
educational attainment, the ability of the participant’s household to afford balanced meals,
household income-poverty ratio and physical activity were included as covariates in this study.
Also included in the multivariable model was SNAP participation as a proxy to aid in the
measurement of nutritional food security.
3.4 Statistical Analysis
Analyses for this study were carried out using SAS version 9.4 to determine whether
Chi-square analyses were performed for bivariate comparisons between acculturation status and
sociodemographic variables, including obesity and SNAP participation status. Following this, a
univariate logistic regression analysis between obesity and all variables in the study was
performed. After that was the computation of multiple logistic regression models among the
sample population testing for the effect of acculturation on obesity. The first model assessed the
association controlling for age, gender, race, educational attainment, household income-poverty
ratio, the ability to afford balanced meals, and moderate and vigorous physical activity. The
second model controlled for all covariates in the second model, as well as SNAP participation.
Findings with a two-sided p-value of < 0.05 were considered statistically significant.
IV. Results
4.1 Frequencies and Descriptive Statistics
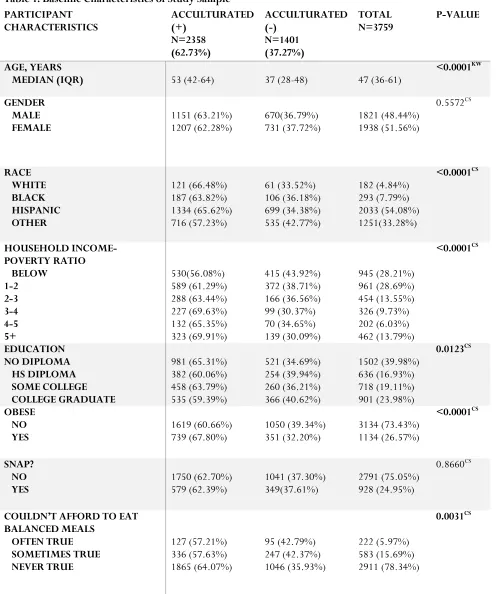
Of the 3,759 study participants, 2358 (62.7%) were acculturated. Participant
characteristics stratified by acculturation status are summarized in Table 1. Significantly more
participants who were acculturated were obese, older in age (median=53), had less than a high
school education, had an income-poverty ratio greater than 5, could afford to eat balanced meals,
and do not perform physical activities. The highest rate of acculturation fell among
non-U.S.-born non- Hispanic whites (66.48%), then Hispanics (65.62%), followed by non-Hispanic blacks
(63.82%), and finally other groups (including Asians) (57.23%). There was no significant
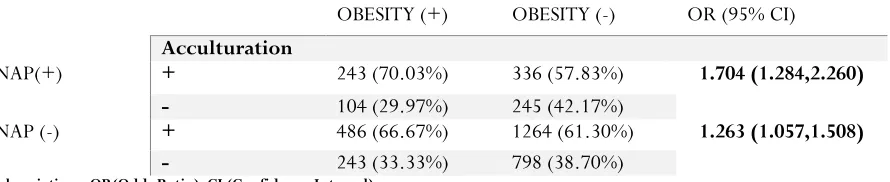
difference in gender, and SNAP participation among acculturation groups. Table 2 shows the
association between acculturation and obesity by SNAP status and reflects that SNAP status did
not affect obesity risk among acculturated individuals (SNAP (yes) OR=1.704; 95% CI 1.284,
Table 1. Baseline Characteristics of Study Sample PARTICIPANT
CHARACTERISTICS ACCULTURATED (+) N=2358 (62.73%) ACCULTURATED (-) N=1401 (37.27%) TOTAL N=3759 P-VALUE AGE, YEARS
MEDIAN (IQR) 53 (42-64) 37 (28-48) 47 (36-61) <0.0001 KW
GENDER MALE
FEMALE 1151 (63.21%) 1207 (62.28%) 670(36.79%) 731 (37.72%) 1821 (48.44%) 1938 (51.56%)
0.5572CS RACE WHITE BLACK HISPANIC OTHER 121 (66.48%) 187 (63.82%) 1334 (65.62%) 716 (57.23%) 61 (33.52%) 106 (36.18%) 699 (34.38%) 535 (42.77%) 182 (4.84%) 293 (7.79%) 2033 (54.08%) 1251(33.28%) <0.0001CS HOUSEHOLD INCOME-POVERTY RATIO BELOW 1-2 2-3 3-4 4-5 5+ 530(56.08%) 589 (61.29%) 288 (63.44%) 227 (69.63%) 132 (65.35%) 323 (69.91%) 415 (43.92%) 372 (38.71%) 166 (36.56%) 99 (30.37%) 70 (34.65%) 139 (30.09%) 945 (28.21%) 961 (28.69%) 454 (13.55%) 326 (9.73%) 202 (6.03%) 462 (13.79%) <0.0001CS EDUCATION NO DIPLOMA HS DIPLOMA SOME COLLEGE COLLEGE GRADUATE 981 (65.31%) 382 (60.06%) 458 (63.79%) 535 (59.39%) 521 (34.69%) 254 (39.94%) 260 (36.21%) 366 (40.62%) 1502 (39.98%) 636 (16.93%) 718 (19.11%) 901 (23.98%) 0.0123CS OBESE NO
YES 1619 (60.66%) 739 (67.80%) 1050 (39.34%) 351 (32.20%) 3134 (73.43%) 1134 (26.57%)
<0.0001CS
SNAP? NO
YES 1750 (62.70%) 579 (62.39%) 1041 (37.30%) 349(37.61%) 2791 (75.05%) 928 (24.95%)
0.8660CS
Abbreviations: IQR (Interquartile Range); KW (Kruskal-Wallis); CS (Chi-Square)
Table 2. The Association between Acculturation and Obesity by SNAP Status
OBESITY (+) OBESITY (-) OR (95% CI)
Acculturation
SNAP(+) + 243 (70.03%) 336 (57.83%) 1.704 (1.284,2.260)
- 104 (29.97%) 245 (42.17%)
SNAP (-) + 486 (66.67%) 1264 (61.30%) 1.263 (1.057,1.508)
- 243 (33.33%) 798 (38.70%)
Abbreviations: OR(Odds Ratio); CI (Confidence Interval)
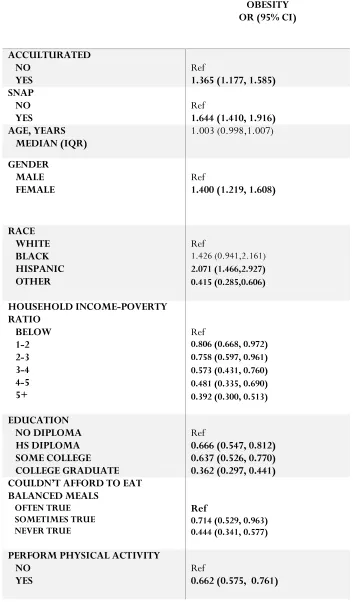
4.2 Univariate Analysis
A univariate analysis of the odds of obesity was performed and summarized in table 3.
The results yielded increased odds of obesity among acculturated individuals (compared to those
who were not acculturated), SNAP participants, females, Hispanics, those with an
income-poverty ratio below 1, those with less than a high school education, and individuals who often
could not afford to eat balanced meals. The odds of obesity was decreased among those with an
income-poverty ratio greater than 1, individuals who at least had a high school education, those
who usually could afford to eat balanced meals, persons who performed physical activities, and
“other” races (including Asians). PERFORM PHYSICAL ACTIVITY NO
YES 1305 (64.44%) 1053 (60.73%) 720 (35.56%) 681 (39.27%) 2025 (53.87%) 1734 (46.13%)
Table 3. Univariate Analysis of the Association of Obesity with Sociodemographic Variables, Acculturation, and SNAP
OBESITY OR (95% CI)
ACCULTURATED NO
YES Ref 1.365 (1.177, 1.585) SNAP
NO
YES Ref 1.644 (1.410, 1.916) AGE, YEARS
MEDIAN (IQR) 1.003 (0.998,1.007)
GENDER MALE
FEMALE Ref 1.400 (1.219, 1.608)
RACE WHITE BLACK HISPANIC OTHER Ref 1.426 (0.941,2.161) 2.071 (1.466,2.927) 0.415 (0.285,0.606) HOUSEHOLD INCOME-POVERTY RATIO BELOW 1-2 2-3 3-4 4-5 5+ Ref
0.806 (0.668, 0.972) 0.758 (0.597, 0.961) 0.573 (0.431, 0.760) 0.481 (0.335, 0.690) 0.392 (0.300, 0.513)
EDUCATION NO DIPLOMA HS DIPLOMA SOME COLLEGE COLLEGE GRADUATE Ref
0.666 (0.547, 0.812) 0.637 (0.526, 0.770) 0.362 (0.297, 0.441) COULDN’T AFFORD TO EAT
BALANCED MEALS
OFTEN TRUE SOMETIMES TRUE NEVER TRUE
Ref
0.714 (0.529, 0.963) 0.444 (0.341, 0.577)
PERFORM PHYSICAL ACTIVITY NO
Abbreviations: IQR (Interquartile Range); OR(Odds Ratio); CI (Confidence Interval)
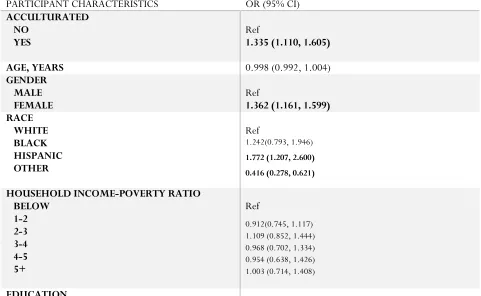
4.3 Multivariate Analysis
When analyzing the direct association between acculturation and obesity, there was a
positive significant association between the variables (OR= 1.365; 95% CI 1.177, 1.585) (Table
3). After adjusting for all covariates except SNAP participation the association remained
positively significant (OR= 1.335; 95% CI 1.110, 1.605) (Table 4). A model with all covariates
including SNAP and an interaction term of SNAP and acculturation (SNAP*acculturation) was
performed and there was no significant interaction between the variables. A final adjusted model
controlling for all covariates including SNAP participation still yielded a positive significant
[image:23.612.66.547.412.708.2]relationship between acculturation and obesity (OR=1.329; 95% CI 1.105, 1.599). (Table 5)
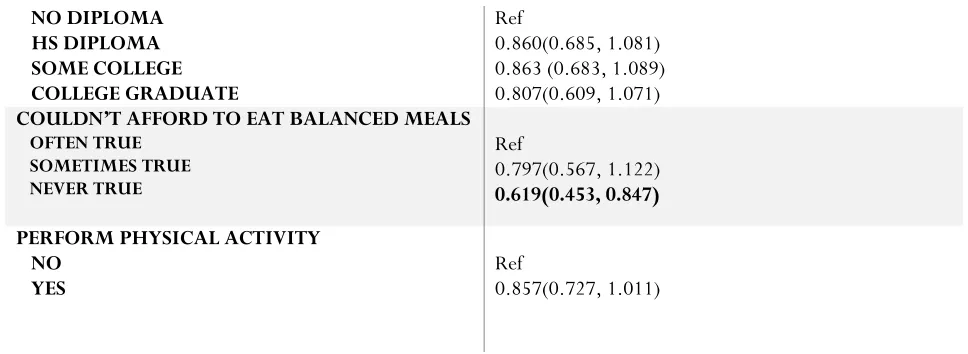
Table 4. Adjusted Multivariate Analysis for the Association between Acculturation and Obesity EXCLUDING SNAP*
PARTICIPANT CHARACTERISTICS OR (95% CI)
ACCULTURATED NO
YES Ref 1.335 (1.110, 1.605)
AGE, YEARS 0.998 (0.992, 1.004)
GENDER MALE
FEMALE Ref 1.362 (1.161, 1.599)
RACE WHITE BLACK HISPANIC OTHER Ref 1.242(0.793, 1.946)
1.772 (1.207, 2.600) 0.416 (0.278, 0.621)
HOUSEHOLD INCOME-POVERTY RATIO BELOW 1-2 2-3 3-4 4-5 5+ Ref 0.912(0.745, 1.117) 1.109 (0.852, 1.444) 0.968 (0.702, 1.334) 0.954 (0.638, 1.426) 1.003 (0.714, 1.408)
NO DIPLOMA HS DIPLOMA SOME COLLEGE COLLEGE GRADUATE Ref 0.860(0.685, 1.081) 0.863 (0.683, 1.089) 0.807(0.609, 1.071)
COULDN’T AFFORD TO EAT BALANCED MEALS
OFTEN TRUE SOMETIMES TRUE NEVER TRUE Ref 0.797(0.567, 1.122) 0.619(0.453, 0.847)
PERFORM PHYSICAL ACTIVITY NO
YES Ref 0.857(0.727, 1.011)
Abbreviations: IQR (Interquartile Range); OR(Odds Ratio); CI (Confidence Interval)
[image:24.612.64.548.69.246.2]*Adjusted model included the following covariates: age, gender, race, household income-poverty ratio, education, couldn’t afford to eat balanced meals, moderate physical activity, and vigorous physical activity.
Table 5. Adjusted Multivariate Analysis for the Association between Acculturation and Obesity INCLUDING SNAP**
PARTICIPANT CHARACTERISTICS OR (95% CI)
ACCULTURATED NO
YES Ref 1.329 (1.105, 1.599)
SNAP NO
YES Ref 1.163 (0.962, 1.405)
AGE, YEARS 0.998 (0.992, 1.004)
GENDER MALE
FEMALE Ref 1.360 (1.159,1.597)
RACE WHITE BLACK HISPANIC OTHER Ref
1.230 (0.785, 1.928)
1.770 (1.206, 2.598) 0.420 (0.281, 0.627)
HOUSEHOLD INCOME-POVERTY RATIO BELOW 1-2 2-3 3-4 4-5 5+ Ref
0.950 (0.772, 1.169) 1.169 (0.892, 1.533) 1.034 (0.743, 1.438) 1.024 (0.679, 1.543) 1.080 (0.761, 1.533) EDUCATION NO DIPLOMA HS DIPLOMA SOME COLLEGE COLLEGE GRADUATE Ref
0.862 (0.686, 1.083) 0.866 (0.686, 1.094) 0.800 (0.602, 1.061)
OFTEN TRUE SOMETIMES TRUE NEVER TRUE
Ref
0.817 (0.580, 1.151)
0.642 (0.468, 0.880)
PERFORM PHYSICAL ACTIVITY NO
YES Ref 0.862 (0.731, 1.017)
Abbreviations: IQR (Interquartile Range); OR(Odds Ratio); CI (Confidence Interval)
**Adjusted model included the following covariates: age, gender, race, household income-poverty ratio, education, couldn’t afford to eat balanced meals, moderate physical activity, vigorous physical activity, and SNAP.
V. Discussion and Conclusion
5.1 Discussion
The objective of this study was to assess the association between acculturation and
obesity, and to determine if SNAP participation affects this association. Studies have found that
acculturation may or may not be associated with obesity and researchers often examined SNAP
participation and obesity based on income status; but studies have yet to be conducted on SNAP
and obesity by acculturation status. Results from this cross-sectional study agreed with majority
of the literature that there is a positive association between acculturation and obesity. When the
relationship was assessed with and without covariates, the association remained positively
significant, indicating that individuals who are acculturated are more likely to become obese
compared to their un-acculturated counterparts. After including the participation of SNAP into
the model, this added variable did not impact the increased odds of obesity among acculturated
individuals.
As previously stated, some characteristics that increase the risk of obesity are lack of
physical activity, high amounts of stress, and unhealthy eating patterns. Results from this
investigation supports these claims as obesity was in fact associated with those who could not
reflect that acculturated immigrants had difficulty providing balanced meals for their families but
they did lack physical activity. According to National Heart, Lung, and Blood Institute, 2017,
individuals become obese when they take in more calories than they put out. One assumption is
that immigrants may be consuming balanced meals, but are not physically active, causing an
imbalance of energy which in turn leads to obesity. This study’s results reflected that majority of
acculturated immigrants had less than a high school education so another assumption is that their
idea of a balanced meal could be skewed. This finding helps to support the fact that a healthy
lifestyle is important in the prevention of obesity.
Only 25% of immigrants received SNAP benefits and merely 15% of immigrants who
received food stamps were acculturated. This small sample may be due to stigma associated with
needing government assistance or the lack of knowledge about the program and may explain
why SNAP participation did not affect the association between acculturation and obesity.
5.1Strengths and Limitations
NHANES uses a multistage probability sampling design to select a sample representative
of the civilian non-institutionalized resident population of the United States. Using 5 years of this
data, we are more likely able to generalize our findings to the U.S. population. In addition, the
credibility of the data source gives plausibility to the study findings about the relationship
between acculturation and obesity and the impact of participating in SNAP on this relationship.
However, there were some limitations to the study. One limitation was the inability to measure
BMI upon arrival to the U.S. and follow cohorts over time. This would have yielded more
accurate results as to whether acculturation measured by length of stay is in fact a risk factor for
obesity among immigrants. Also, because this was a cross-sectional study, associations can only
acculturation does not capture other factors that could affect obesity such as stress and dietary
intake. Still, the observed positive association between acculturation and obesity and positive
association between SNAP and obesity can help inform policies to educate immigrants on
healthy diet and lifestyle as well as the benefits and availability of SNAP.
5.3 Conclusion
Immigrants constitute the largest portion of the U.S. population and studies have shown
that there is an overall positive association between immigrant length of residency in the U.S.
and obesity. In order to control the obesity epidemic in America, it is important that the trend of
the condition is also thoroughly examined among immigrant groups. Obesity is an outcome that
can be caused by a combination of many different factors and acculturation is a multidimensional
process. Further research performing a comprehensive investigation that includes all known risk
factors of obesity and a more extensive measure of acculturation to most accurately assess their
association is needed. Furthermore, there also needs to be additional assessment of the SNAP-Ed
programs because the overall association of why SNAP participation increases the risk of obesity
References
Antecol, H., &Bedard, K. (2006). Unhealthy assimilation: Why do immigrants converge to
American health status levels?Demography, 43(2), 337-360.
Bennett, G. G., Wolin, K. Y., Askew, S., Fletcher, R., &Emmons, K. M. (2007). Immigration and
Obesity Among Lower Income Blacks. Obesity, 15(6), 1391-1394.
Centers for Disease Control and Prevention (CDC). (2017, August 29). Adult Obesity
Facts.Retrieved from https://www.cdc.gov/obesity/data/adult.html
Delavari, M., Sønderlund, A. L., Swinburn, B., Mellor, D., &Renzaho, A. (2013). Acculturation and
obesity among migrant populations in high income countries – a systematic review. BioMed
Central Public Health, 13, 458.
Finkelstein, E. A., Trogdon, J. G., Cohen, J. W., &Dietz, W. (2009). Annual Medical Spending
Attributable To Obesity: Payer-And Service-Specific Estimates. Health Affairs, 28(5), 822-831.
Goel, M. S., McCarthy, E. P., Phillips, R. S., &Wee, C. C. (2004). Obesity among US immigrant
subgroups by duration of residence.Journal of the American Medical Association, 292(23),
2860-7.
Grummon, A. H., Taillie, L. S. (2017). Nutritional profile of Supplemental Nutrition Assistance
Program household food and beverage purchases. The American Journal of Clinical Nutrition,
105(6), 1433-1442.
Gundersen, C. (2016). SNAP Matters: SNAP and Obesity. In How Food Stamps Affect Health and Well-Being (Chapter 6). Retrieved from
Isasi, C. R., Ayala, G. X., Sotres-Alvarez, D., Madanat, H., Penedo, F., Loria, C.
M.,…Schneiderman, N. (2015). Is Acculturation Related to Obesity in Hispanic/Latino Adults?
Results from the Hispanic Community Health Study/Study of Latinos. Journal of Obesity, 2015,
Article ID 186276, 8 pages.
Kaplan, M. S., Huguet, N., Newsom, J. T., &McFarland, B. H. (2004). The association between
length of residence and obesity among Hispanic immigrants. American Journal of Preventive
Medicine, 27(4), 323-326.
Kaushal, N. (2009). ADVERSITIES OF ACCULTURATION? PREVALENCE OFOBESITY AMONG
IMMIGRANTS. Health Economics, 18, 291-303.
Lauderdale, D. S., &Rathouz, P. J. (2000). Body mass index in a US national sample of Asian
Americans: effects of nativity, years since immigration and socioeconomic status. International
Journal of Obesity, 24(9), 1188-1194.
Lee, S., Nguyen, H. A., &Tsui, J. (2009). Interview Language: A Proxy Measure for Acculturation
Among Asian Americans in a Population-Based Survey. Journal of Immigrant and Minority
Health, 13(2), 244-252.
Leung, C. W. Ding, E. L., Catalano, P. J., Villamor, E., Rimm, E. B., &Willett, W. C. (2012). Dietary intake and dietary quality of low-income adults in the Supplemental Nutrition Assistance Program. The American Journal of Clinical Nutrition, 96(5), 977.
Lopez-Class, M., Castro, F. G., &Ramirezde, A. G. (2011). Conceptions of acculturation: A review and statement of critical issues. Social Science & Medicine, 72(9), 1555-1562.
National Center for Children in Poverty (NCCP). (2017). Immigrant Families. Retrieved from
http://www.nccp.org/topics/immigrantfamilies.html
National Heart Lung and Blood Institute (NHLBI). (2017). Overweight and Obesity. Retrieved
Park, Y., Neckerman, K. M., Quinn, J., Weiss, C., &Rundle, A. (2008). Place of birth, duration of residence, neighborhood immigrant composition and body mass index in New York City.
International Journal of Behavioral Nutrition and Physical Activity, 5, 19.
Project Bread’s GettingSNAP.Org. (2017). What is SNAP?. Retrieved from
http://www.gettingfoodstamps.org/whatissnap.html
Qobadi, M., & Payton, M. (2017). Racial Disparities in Obesity Prevalence in Mississippi: Role of
Socio-Demographic Characteristics and Physical Activity. International Journal of Environmental
Research and Public Health, 14(3), 258.
Schwartz, S. J., Unger, J. B., Zamboanga, B. L., &Szapocznik, J. (2010). Rethinking the Concept of
Acculturation--Implications for Theory and Research. American Psychologist, 65(4), 237-251.
Singh, G. K., Siahpush, M., Hiatt, R. A., &Timsina, L. R. (2011). Dramatic increases in obesity and overweight prevalence and body mass index among ethnic-immigrant and social class groups in
the United States, 1976-2008.Journal of Community Health, 36(1), 94-110.
SNAP to Health (SNAP). (2017). The History of SNAP. Retrieved from
https://www.snaptohealth.org/snap/the-history-of-snap/
United States Department of Agriculture (USDA). (2017). Supplemental Nutrition Assistance
Program (SNAP). Retrieved from