Area Based Traffic Control System
SweSwe Win
*, Wut Yi Win
**, Theingi
***
Department of Mechatronic Engineering, Mandalay Technological University, Myanmar
**
Department of Mechatronic Engineering, Mandalay Technological University, Myanmar
***
Department of Mechatronic Engineering, Technological University (Thanlyin), Myanmar
*
[email protected],
**[email protected],
***[email protected]
DOI: 10.29322/IJSRP.8.12.2018.p8488 http://dx.doi.org/10.29322/IJSRP.8.12.2018.p8488
Abstract- An efficient traffic control system is an important issue to reduce the traffic congestion. In this research, area based traffic control system is implemented for four-way intersection by using image processing techniques. This system is a vehicle-actuated signal type control system such that traffic cycle time can be varied and related to the actual demands by traffic. The CCTV traffic video file at a station in Mandalay is utilized as the input for the image processing. The amount of vehicles bounded on the road is estimated and defined as the traffic area with the numbers of pixels. Depending on sum of the amount of area on both opposite directions, three types of traffic cycle times are determined such as 60 sec, 85 sec and 120 sec respectively. The vehicles areas on the analyzed road are calculated by using contour, moment and area-based calculation image processing algorithms. The experimental results are implemented with the help of OpenCV and simulation of traffic signal timing sequence is tested with Arduino.
Index Terms- Contour, Moment, Area-Based Calculation Algorithm, Traffic Cycle Time, Traffic Timing Signals, Arduino Uno
I. INTRODUCTION
The vision based intelligent traffic management system is a robust framework that manages the on-road traffic flow in real time by estimating traffic density near traffic signals. This system used a simple algorithm to calculate the number of vehicles at various signals on a road to efficiently manage the traffic by controlling signals to avoid congestion and traffic jam [1]. The traffic density estimation and vehicle classification are useful and effective for traffic management systems. The real time video traffic video file was utilized for traffic surveillance system using neural network method [2].
The image captured in the traffic signal is processed and converted into gray scale image then its threshold is calculated based on which the contour has been drawn in order to calculate the number of vehicles present in the image [3]. The system detects vehicles through images instead of using electronic sensors embedded in the pavement. Setting image of an empty road as reference image, the captured images are sequentially matched using image matching. The Prewitt edge detection operator has been carried out and according to percentage of matching traffic light durations can be controlled [4].
Image based traffic control/ management systems are designed as different way to approach. Some of them are inductive loop detection system based traffic control system, microwave radar system based and they are shown in the following Fig 1 and Fig 2 respectively. This proposed system is a type of video image based vehicle detection system and this is a sample design shown in Fig 3.
Figure1: Inductive Loop Detection [9] Figure2: Microwave Rader Based [10] Figure3:Video Image Vehicles Detection [11]
are determined in the next section with the timing diagrams. In the final section, the simulation results for traffic signal timing sequences are tested and depicted with the help of Arduino.
II.IMAGE PROCESSING BASED TRAFFIC CONTROL SYSTEM
The block diagram below gives an overview of the traffic control system in Fig 4. It also shows how the vehicles area is estimated and the steps of the image processing. The system is mainly descried into four steps as the following. The image acquisition and estimation of area are firstly processed. The traffic cycle time to allow for passing the road is defined according to the amount of area. Arduino receive the data how is the duration of traffic cycle time via the serial communication and sent this signal for Red, Green and Yellow traffic signals display system.
Input Video
Sequence
Foreground
Detector
Image
Enhancement
Vehicle Detection
Vehicles Area
Calculation
U
S
B
Arduino Uno
Traffic Signal
System
Determination of
Traffic Cycle Time
Figure4: Overview of Traffic Control System
III.VEHICLESAREACALCULATION
Firstly, the images of video camera on the road are captured. And then, background image is subtracted to get the foreground objects. Secondly, image enhancement process is used to detect the vehicles area clearly. Thirdly, the contour, moment and area estimation algorithms can be applied to calculate the area of vehicles bounded on this road. Finally, the vehicle detection is completed by using frame differencing method and also described into the following section.
(1) Capturing Image
(2) Foreground Detector
Foreground Detector is considered as the most important function; it plays a big role in the filter and detects the ground. In this system, it will take the previous image as the background image and current image, and then make subtraction between those two images.
(3) Image Enhancement
Image enhancement is the process of adjusting digital images so that the results are more suitable for description or further analysis. Morphological operation is carried out for the better resultant images. First step is removing small connected components and objects from binary image by using function specified for this process. Second step, dilation process is for enlarge the detected areas and fill in black areas near borders/perimeters. Third step, the black areas will be enlarged and eat away at the white areas with the help of erosion process.
(4) Vehicle Detection
[image:3.612.38.535.243.372.2]The vehicle detection is a process to describe the vehicles area in the specified image. In this research, frame difference method is used. This method has less computational complexity, and it is easy to implement; its difference between the current frame and the reference frame. Fig 6 shows the detection of vehicles on the road.
Figure 5: Capture Image Figure 6: Vehicles Detection
(5) Vehicles Area Calculation
The amount of traffic area is calculated according to the contour area of the vehicles abounded on the lane. After the morphological operations, threshold value is determined for separating the foreground objects from background image. And then the contour algorithms are applied for calculation the density area. Contours are simple curve to join all the continuous points (along the boundary), having same color or intensity [6]. The different features of contours like mass of objects and area of objects, perimeter, centroid and bounding box etc… can calculate from the images. The contour area is measured by the pixel numbers and shown in Fig.7and Fig. 8.
Figure 7: Contoured Image Figure 8: Vehicles Area Detection
IV.RESULTSOFVEHICLEAREACALCULATION
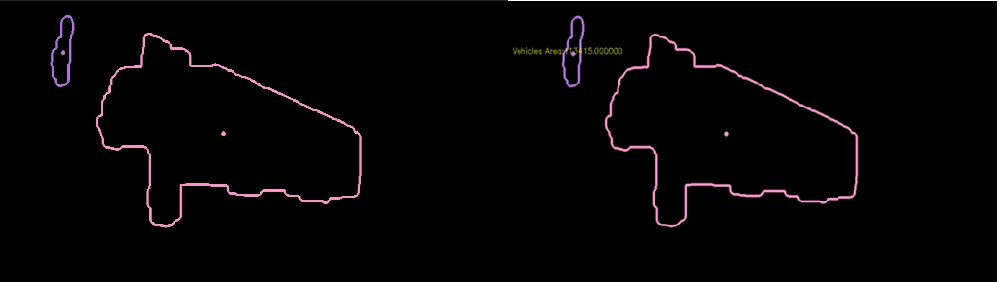
[image:3.612.39.539.487.628.2]video are applied to estimate the numbers of pixels for vehicles area on the road. The status of traffic congestion is depended on the amount of pixels or area of the detected image.
The following experimental results are described for both directions (east and west) of 26th Street. The original images for vehicles and result images of the east are shown in Fig 9and Fig 11. The images of Fig 10 and Fig 12 are processed and estimated for west of 26th Street. The image results for each frame are presented with the amount of pixels numbers.
Figure 9:Image of Street 26(east) Figure 10:Vehicle Area=58152.5 pixels
Figure 11: Image of Street 26(west) Figure 12:Vehicle Area=43177 pixels
V.DETERMINATION OF AREA BASED TRAFFIC CYCLTE TIMES
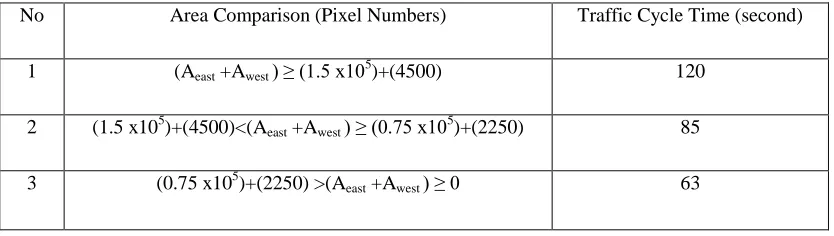
[image:4.612.99.516.556.674.2]The determination of area based traffic cycle time is depended on the pixel number and camera vies on each side of the investigated road. For the east of 26th Street, the maximum pixel number is about 1.5x105 pixels at the largest area on the peak hour according to the survey data. It is about 4500 pixels for the west of that street. There is not same maximum pixel number at both streets due to the camera view. The traffic cycle times are divided into three types such as 63 seconds, 85 seconds and 120 seconds respectively and shown in Table I. It is also considered according to the status on both directions of a road. Therefore, the total sum of pixel numbers for both opposite directions of that road determine type of traffic cycle time.
Table I: Area Based Traffic Cycle Time
No Area Comparison (Pixel Numbers) Traffic Cycle Time (second)
1 (Aeast +Awest ) ≥ (1.5 x10⁵)+(4500) 120
2 (1.5 x10⁵)+(4500)<(Aeast +Awest ) ≥ (0.75 x10⁵)+(2250) 85
3 (0.75 x10⁵)+(2250) >(Aeast +Awest ) ≥ 0 63
According to the above the results, the total number of pixels is about (0.58152 x10⁵+43177=101329 pixels). The total number of pixel values is in the middle group. Therefore, the traffic cycle time will be the duration of 85 seconds for the road.The traffic light timing diagrams for 85 sec of cycle time is also described in Fig 13.
time of travelling straight through and turning right are mainly considered. In the maximum cycle time of 120 seconds, the green time is taken as 30 seconds for travelling straight and turning right. The green time is lasted for 15 seconds of that phase at 85 seconds cycle time. For 63 seconds cycle time, the green time of 10 seconds is determined for vehicles on the road respectively.
Figure13. Timing Diagram for 85 second Duration
VI.ALOGORITHM OF THE PROPOSED SYSTEM
This traffic control system is intended to apply for the four-way intersection. Traffic moment is each possible trajectory of traffic flow. There are three traffic moments such as vehicle turning left, vehicle travelling straight through and vehicles turning right respectivelyand shown in Fig 14.
In the proposed design, cross junction of four roads traffic control system (right side drive) is used and shown in Fig 15. In Federal data have shown: 53.1% of crossing-path crashes due to vehicle turning left. On the other hand, case of vehicle turn right is about 5.7% of crossing –path crashes. Therefore, the vehicle turning left is generally unsafe and inefficient while driving.In this type of traffic phase design,this is firstly passed because this search data.
Figure14. Traffic Moment Design
P1 P2
P3 P4
VII. SIMULATION RESULT FOR TRAFFIC SIGNAL SYSTEM
The amount of vehicles area is calculated and then the duration of traffic cycle time is determined from the OpenCV framework. The type of traffic cycle time is sent as the data to the controller board for the traffic signal system. In this research, Arduino Uno board is utilized as the controller for the traffic signal display system. At first, serial data communication to Arduino is established to accept the type of traffic cycle time. Based on the determination of traffic signal duration, Red, Green and Yellow traffic signals are displayed for the passing road. This image result is described into the following Fig 17. For the simulation results, the LEDs are used instead of signals and it is shown in Fig 16.
Figure16. Setup for Signal DisplayFigure17. Traffic Signal Simulation Image Result
II. CONCLUSION
This traffic control system is based on the vision sensor CCTV camera and utilized with image processing techniques. And the experimental and simulation results also had been presented for the analyzed road. Depending on the traffic demand on the road, this system is intelligent and work well effectively. And it is also carried out for saving time of the vehicles at the road in the city. In addition, it is more reducing the waiting time without vehicles on the road. Due to the consideration of both direction areas, it will decrease vehicle abounded time on the road. On the other word, the traffic phase design will also be effective for the four way intersection. Avoiding the same passing time for go through and left turn, it can also be reduced the accidents. As a result, this image processing based intelligent traffic control system can be available that the congestion problems will be effectively reduced at peak hours on the road than other convectional system in Mandalay.
ACKNOWLEDGMENT
Firstly, I would like to acknowledge particular thanks to Dr. SintSoe, Rector of Mandalay Technological University (MTU), for his kind permission to carry out this research. I would like to thank Dr.Wut Yi Win (Professor and Head).Without their continued support and interest, this research would not have been the same as present here. And I also would like to thank all the teachers from the Department of Mechatronic Engineering, Mandalay Technological University (MTU).And I also would like to thank my family and my friends who have helped me throughout the year.
REFERENCES
[1] Akoum, A.H., “Automatic Traffic Using Image Processing”, Journal of Software Engineering and Applications, 10, 765-776,2017.
[2] CelilOzkurt and FatihCamci, “Automatic Traffic Density Estimation and Vehicle Classification for Traffic Surveillance System using Neural Networks, Computer Engineering Department, Fatih University, Vol. 14, No. 3, pp. 187-196, 2009.
[3] K.Vidhya and A.BazilaBanu, “Density Based Traffic Signal System”, International Conference on Innovations in Engineering and Technology, K.L.N. College of Engineering, On 21st& 22nd March, 2014.
[4] PallaviChoudekar, Sayanti Banerjee and M.K.Muju, “ Implementation of Image Processing in Real Time Traffic Light Control”, Ajay Kumar Garg Engineering College, Department of mechanical engineering Ghaziabad, UP ,India, 978-1-4244-8679-3/11/$26.00 ©2011 IEEE
[5] Al Hussain Akoum, “Automatic Traffic using Image Processing”, Department CCNE, Lebanese University, Saida, Lebanon, Journal of Software Engineering and Applications, 2017, 10, 765-776.
[6] M.H.M, “Vision Based Intelligent Traffic Management System”, COMSATS Institute of Information Technology, 978-0-7695-4625-4/11 © 2011 IEEE. [7] htpps://docs.opencv.org,OpenCV Contour Features.
[8] LeonidasKotoulas, Student Member, IEEE, and IoannisAndreadis, “Accurate Calculation of Image Moments”, IEEE Transactions on Image Processing,
[9] Vidya, B., Riru, R. and Manjeet, Y.: Application of Gas and Remote Sensing in Modern Transportation System, Department of Civil Engineering, Tezpur University, India, (2015).
[10] Mohammad, M.: Wireless Sensor Network-technology and Applications, Computer and Information Science, India, (2012). AUTHORS
First Author – SweSwe Win, Lecturer, Department of Mechatronic Engineering,MandalayTechnological University, Myanmar, [email protected]
Second Author – Wut Yi Wub, Professor,Department of Mechatronic Engineering, Mandalay Technological University, Myanmar, [email protected]