Policy Interpretation, Project Management Practices and
Performance of Construction Projects
Stephen J. Kamau*, Charles M. Rambo**, John Mbugua**
* PhD Candidate, School of Open and Distance Learning, University of Nairobi, Kenya **School of Open and Distance Learning, University of Nairobi, Kenya
DOI: 10.29322/IJSRP.9.06.2019.p9068 http://dx.doi.org/10.29322/IJSRP.9.06.2019.p9068
Abstract- The study sought to determine whether the performance of construction projects was influenced by school infrastructure policy interpretation and whether project management practices mediated that relationship. A cross-sectional survey using a correlational design was used. The target population comprised of 920 head teachers and 86 District Education Officers (DEOs) in all the 13 regions of Somaliland. Purposive sampling and proportionate stratified random sampling with replacement were used to sample 272 schools while simple random sampling was used to sample 20 DEOs. Data collection was by self-administered questionnaires for head teachers and semi-structured interviews for DEOs. Questionnaires pilot testing was done on 28 head teachers in Awdal region. The response rate was 90.8% (247 head teachers) for questionnaires and 100% (20 DEOs) for interviews. Variable relationships were tested using ttests at 5% level of significance. School infrastructure policy interpretation exerted a significant direct effect (b =
-0.3215, p< 0.001, R2 = 0.4183) on the performance of construction projects. Project management practices mediated the relationship
with a significant positive indirect effect of 0.4548, CI [0.3505, 0.5642]. A direct negative linear relationship existed between school infrastructure policy interpretation and the performance of construction projects. Policy interpretation exerts its influence on the performance of construction projects through project management practices.
Index Terms- Policy interpretation, project performance, mediation, construction projects, school infrastructure policy.
INTRODUCTION
The importance placed in education globally can be seen in its inclusion in global goals such as sustainable development goals and in government investments and budgetary allocations to education ministries and departments worldwide. Many governments use the school system to deliver education services to their citizens. This requires establishing school infrastructure which in turn requires undertaking school infrastructure construction projects. School construction projects take the form of establishing new infrastructure facilities, expanding existing facilities, maintenance repair or rehabilitating of old facilities. The success of such projects can be measured using indicators such as timely completion, completion within budget, client satisfaction, meeting scope and quality standards among others. Different authors have advocated different project performance indicators among them: Freeman and Beale (1992), Shenhar, Levy, and Dvir (1997); Lim and Mohammed (1999), Sadeh, Dvir, and Shenhar (2000),Vandevelde, Dierdonck and Debackere (2002), Chan, Scott and Lam (2002), Shenhar, Tishler, Dvir, Lipovetsky and Lechler (2002) and, Patanakul and Milosevic (2009). These performance indicators gravitate around; project budget management, schedule management, the realization of project objectives, meeting standards, and client and stakeholder satisfaction. This study adopted the Chan and Chan (2004) blend of objective and subjective indicators: realization of project deliverables, variations from project plans and set standards, attaining project functionality, and satisfaction of the client, contractor, end-users, design team and construction teams with the project outcome.
users may not have access to all the documents and may be unaware of the full extent of the policy. This can increase policy interpretation variations even more. Policy interpretation can be indicated by users’ and implementers’ access of the policy, existence and use of policy interpretation guidelines, policy users’ education and sensitization on the policy, existence of policy disputes and litigations, existence of significant policy ambiguity, uncertainty in the policy substance, policy existence form, and extent of consistency in the determination of resource requirements for policy implementation by the users.
Project management practices unfold around the project cycle and are key in determining the project’s performance. The relationship between project focused policies and project management practices are two-way. When project regulatory policies are set, they influence and even change project management practices that project managers deploy. In the reverse, the practices that project managers use and deploy can be what causes the need for regulatory policy intervention by the government. When a regulatory policy is enacted, it changes existing practices and existing practices also inform the need for a policy or a policy review. The study sought to assess the influence of school infrastructure policy interpretation on the performance of construction projects in primary schools in Somaliland with project management practices mediating the relationship.
LITERATUREREVIEW
Once a policy is instituted, policy users and implementers interpret the policy substance in terms of what the requirements are and the resources needed to fulfil those requirements (Coglianese, 2012). Depending on the existing situation and current practices in an organization, the resource or cost interpretation of a policy may vary from one organization to organization. Different parties may interpret the same policy differently hence one policy may attract a mixture of support and criticisms. Policy ambiguity refers to provisions in the policy being unclear as to their intended meaning or having more than one interpretations. Where the policy is ambiguous, the results can be detrimental to both policy objectives and organizational objectives. School infrastructure policy substance ambiguity can result to delay of new projects, failure of existing projects, back-passing and jostling between the parties involved, a halt in mounting new school infrastructure projects, slack service delivery, and blame games among the regulators and the policy implementers (Dubois, 2014). Such policy ambiguities can also result in policy uncertainty among the regulated parties and eventually different interpretations of the same policy. When the resource interpretation of the policy is lacking, policy implementation faces many handles and realization of policy goals is frustrated. This has been witnessed in numerous African countries that introduced free primary education policy in line with international millennium goals without interpreting the infrastructural resource requirements necessary to support the free primary education and ensure quality was not compromised. This was the case in Malawi (Kadzamira and Rose, 2001), Kenya (Ngware, Oketch, and Ezeh, 2011), Tanzania (Moshi and Vavrus, 2009) and South Africa (Marishane, 2013). Policy uncertainty refers to omitted aspects of the policy or gaps in the policy provisions. Uncertainty creates a silence in policy requirements, the result of which is policy non-application in the omitted aspect allowing policy users and implementers to practice as they see best. In the case of construction projects, uncertainty in school infrastructure policy can result to non-performance of construction projects as schools’ delay mounting new projects and halt existing projects in the short run as they adopt a wait-and-see approach on whether the policy uncertainty to be cleared. The study was anchored the punctuated equilibrium theory of policy and program theory of project management.
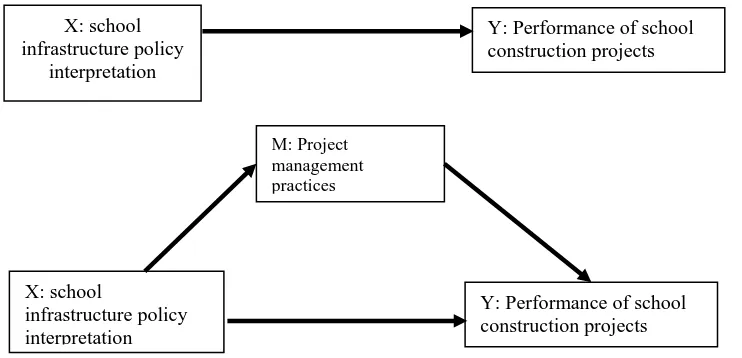
[image:2.612.40.411.507.686.2]The study sought to analyze the following models.
Figure 1: Models of analysis
M: Project management practices
X: school
infrastructure policy interpretation
Y: Performance of school construction projects X: school
infrastructure policy interpretation
METHODOLOGY
The study was cross-sectional survey research using correlational convergent parallel design. The target population was 920 public primary schools. Each school has a head teacher who also often doubles in as the project manager for the school’s construction projects. Headteachers are supervised by District Education Officers who are in charge of public schools in a district region. To draw a sample, the study used the sample size formula for a large population (n=z2 (P)(Q)/ (level of statistical significance)2 ) and then applied the Cochran finite population correction at 5% level of significance. Somaliland is demarcated into 13 regions which have 86 districts and 920 public primary schools (MoEHE, 2015). The determined sample was 272 schools multistage sampling was used. Purposive sampling was used to sample 7 regions with a total of 56 districts which have 735 primary schools. The criteria used for purposive sampling of regions was: physical accessibility, national geographical spread, a high number of primary schools, the balance between rural and urban schools, secure, and not engaged in armed conflict. A sample of 272 schools was drawn from 735 schools using proportionate stratified random sampling with replacement. In the 272 schools, expert sampling was used to pick the head teacher as the organizational respondent. Simple random sampling was applied to pick 20 DEOs for interviews from the 56 districts, purposively sampled. The 272 head teachers filled questionnaires that were dropped and picked later. The questionnaires were anchored on a 5-point Likert attitudinal scale. Each variable was measured using 10 Likert scale items and one open-ended question. Semi-structured interviews were used to collect data from 20 DEOs. Pretesting of the questionnaire was done on 28 head teachers. Reliability was
ensured by the Cronbach alpha coefficient of internal consistency: α = 0.924. Construct validity was ensured by the use of proven
variable indicators in constructing the questionnaire items. Content validity was ensured through peer review. Path analysis was used to assess the variable relationships and path coefficients were used to test hypotheses. Andrew Hayes Process tool was used to analyze the mediation effect. The following three equations were used to analyze the total effect, direct effect and indirect effect.
Y= a0 +cX+ e1 ………….… total effect X1 on Y
M = a1+ b1 X+ e2 ……… first part of the indirect effect
Y= a2+ c’ X+ b2M +e3 ………... direct effect and second part of indirect effect
Where Y is the dependent variable, X is the independent variable, M is the mediator variable, a0, a1 anda2 are model constants, c is the
total effect of X on Y, b1 = P21 and is the effect of X on M, c’ = P51 the direct effect of Xon Y controlling for M, b2, =P52 the effect of
M on Y while, e1, e2 and e3 are disturbance terms.
FINDINGSANDDISCUSSIONS
Of the 272 schools surveyed 253 questionnaires were completed and returned. Of these, 6 were dropped due to gaps in responses. The usable sample was 247. This represents a 90.8% response rate. The high response rate was attributed to the short period between drop time and pick time of the questionnaire which was 1 to 2 days. Shapiro Wilk test was used to test the data for normality. Data for
policy interpretation, D(247) = 0.991, P = 0.113; project management practices, D(247) = 0.995, P = 0.585; and performance of
construction projects, D(247) = 0.994, P = 0.454; were all normally distributed. Multicollinearity was tested using tolerance value
(TV) and VIF: policy interpretation, TV =0.657, VIF=1.523; project management practices TV=0.574, VIF =1.741; indicating absence of multicollinearity. Homogeneity of variance was tested using the Levene statistic. For policy interpretation, F (29, 212) = 1.087, P = 0.355; project management practices F (29,212) = 0.890, P = 0.633 indicating that the variances of the explained variable (Y) were stable for different levels of the independent variable. The independent of error terms tests were also done using the Durbin Watson statistic which returned D =2.070, indicating the absence of autocorrelation.
The study sought data on projects completed in a period of 5 years prior to the study. The school's responses were summed up for each variable on a scale of 10-50 and grouped into three categories: disagree, not sure and agree. The results are shown in Table 1 below.
Table 1: Data collected on model variables
Variable Response category Frequency Percent Mean Standard Deviation
Performance of construction projects
Disagree/low (10-26) 68 27.5
29.60 7.12
Not sure (26-34) 109 44.2
Agree/high (34-50) 70 28.3
Total 247 100.0
School infrastructure policy interpretation
Disagree/low (10-26) 64 25.9
30.64 8.67
Not sure (26-34) 91 36.9
Agree/high (34-50) 92 37.2
Total 247 100.0
Project management practices
Disagree/low (10-26) 40 16.2
30.88 5.33
Not sure (26-34) 133 53.8
Total 247 100.0
On the performance of construction projects, the respondents took a lukewarm position with a mean score of 29.60 with a response spread around the mean of 7.12. Of the 247 schools, 68 had low performance in their construction projects, 70 had high performance, while 109 had some of their construction projects attaining low performance and others attained high performance. On policy interpretation, 64 of the 247 schools reported having had school infrastructure policy interpretation issues, 92 schools had not had such issues while 91 schools were not sure if they had had policy interpretation issues with regard to the school infrastructure policy. The mean was 30.64 and the standard deviation 8.67 indicating the respondents took a lukewarm position and the responses were more spread around the mean than the other two variables. Further analysis showed that most schools with policy interpretation issues were from rural regions. Of the 247 schools surveyed 74 indicated their project management practices were sufficient to yield high performance of their construction projects, 40 schools indicated inadequate project management practices that resulted to low project performance while, 133 schools were not sure whether their project management practices could lead to high or low performance of their construction projects. With a mean of 30.88 and the responses spread around the mean being 5.33, the response was slightly in favour of project management practices that yielded high performance of construction projects. This shows that project management practices exerted a positive influence on the performance of construction projects
Policy interpretation was positively correlated with performance of construction projects but the correlation was not significant (r =
0.64, p = 0.319, α = 0.01) indicating that it is not a key predictor of performance of construction projects without a mediating variable.
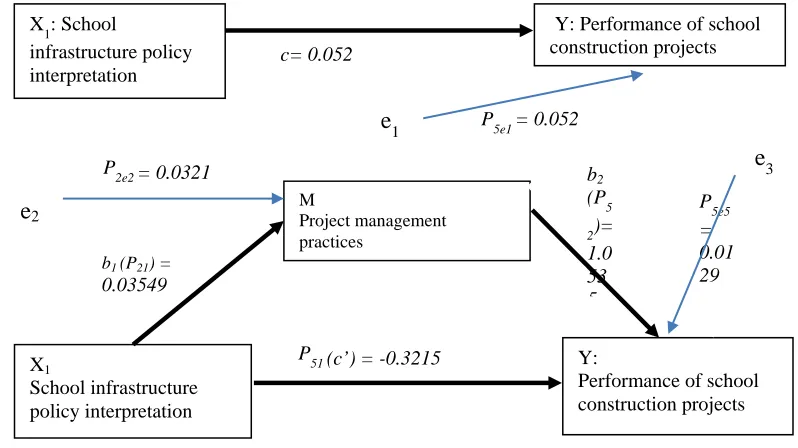
[image:4.612.90.523.309.388.2]The total effect was computed using linear regression analysis. The results are shown in Table 2.
Table 2: Regression Coefficients for Total Effect of Policy Interpretation on Performance of Construction Projects.
Unstandardized
Coefficients Standardized Coefficients Correlation
Model b Std. Error Beta t Sig. Zero-order Partial Part
Constant 27.999 1.668 16.783 0.000
PI 0.052 0.052 0.064 0.999 0.319 0.064 0.064 0.064
Note: Dependent Variable: Performance of Construction Projects; n =247, α = 0.05.
The total effect of policy interpretation on performance of construction projects with no other variable in the model was not
significant: c = 0.052, t = 0.999, P = 0.319 (> 0.05) and R2 = 0.004. The total effect model was: Y = 27.999+ 0.052X + e; e1 = 0.052.
This shows that no significant relationship exist between school infrastructure policy interpretation and performance of construction projects when there are no other variables in the model.
Path analysis was used to determine the direct and indirect effects exerted by policy interpretation on the performance of construction projects using the Hayes Process model 4 (Preacher, Rucker and Hayes, 2007). The results are shown in Table 3, Table 4 and Figure 2.
Table 3 shows the results of the regression of X on M.
Table 3: Regression coefficients for the indirect effect of policy interpretation on project management practices
Coefficient. se t p Confidence interval
LLCI ULCI
Constant 20.0068 1.0213 19.5899 0.0000 17.9952 22.0184
Policy interpretation 0.3549 0.0321 11.0614 0.0000 0.2917 0.4181
Note: n =247, α = 0.05
In the X →M relationship, policy interpretation predicts project management practices (b1 = 0.3549, t = 11.0614, p< 0.001). The value
of R2 was 0.3331 (p < 0.001), showing that 33.31% of the variations in Mcould be explained by variations in X. This shows that
school infrastructure policy interpretation is an important predictor of the project management practices used in school construction projects.
The effect of M on Y and the direct effect of X on Y were analyzed. The results are presented in Table 4.
Table 4: Regression coefficients for the direct effect of policy interpretation and indirect effect of project management practices on performance of construction projects.
Coefficient se t p Confidence interval
Note: n =247, α = 0.05
For the relationship between the independent variable and the dependent variable controlling for the mediator (X│M→Y), X
significantly predict Y, (b = -0.3215, t = -6.5419, p<0.001). R2 was 0.4183 (p<0.001) indicating that 41.83% of the variations in Y
could be explained by the variations in both Xand M. The following mediation equations were constructed:
M= 20.0068+ 0.3549X + e2. e2 = 0.0321
Y= 6.9218 – 0.3215X + 1.0535M + e3. e3 = 0.129
(e is the disturbance term)
Policy interpretation had a negative direct effect on the performance of construction projects of c’ = -0.3215 (p<0.001) showing that the independent variable had a direct negative effect on the dependent variable when the mediator is in the model. The unstandardized
indirect effect of X on Y through Mwas 0.3739 which when fully standardized, was 0.4548, CI [0.3505, 0.5642], showing that policy
interpretation exerted a significant influence on the performance of construction projects through project management practices.
[image:5.612.79.478.264.488.2]
Figure 2: Path analysis model.
Figure 2 depicts the path coefficients for the model. The following hypothesis was tested:
HO: X has no influence on Y. HO: p51 = 0
HA: X has a significant influence on Y. HA: p51 ≠ 0
With the value of p51 = -0.3215, p< 0.001, HO was rejected and HA accepted. Policy interpretation was found to exert a significant influence on the performance of construction projects when project management practices are in the model as a mediator.
CONCLUSION
The results show that the direct relationship between school infrastructure policy interpretation and performance of construction projects is moderate negative and linear. This indicates that when school infrastructure policy interpretation improves and the policy is better understood, the performance of construction projects reduces taking into account changes in project management practices. This can be attributed to resource requirements aspect of policy interpretation. When the policy is properly interpreted, the resource and costs required to implement it and comply with its requirements at the school become clear. These costs add on to project costs resulting to an increase in the overall project costs which in turn may cause a reduction in project performance such as mounted projects delaying to complete and new projects delaying to start due to an increase in the projects’ budgets.
Constant 6.9218 2.0468 3.3817 0.0008 2.8901 10.9335
Policy interpretation -0.3215 0.0491 -6.5419 0.0000 -0.4183 -0.2247
Project management practices 1.0535 0.0799 13.1811 0.0000 0.8961 1.2110
M
Project management practices
X1
School infrastructure policy interpretation
Y:
Performance of school construction projects
e
2b1 (P21) =
0.03549
P51 (c’) = -0.3215 P2e2 = 0.0321
b2
(P5
2)=
1.0 53 5
P5e5 = 0.01 29
e
3X1: School
infrastructure policy interpretation
Y: Performance of school construction projects c= 0.052
e
1 P5e1 = 0.052The study further concludes that school infrastructure policy interpretation has a significant positive indirect relationship with the performance of construction projects through project management practices. When project management practices are taken out of the model there is no significant relationship between policy interpretation and performance of construction projects. This explains that school infrastructure policy works by influencing the project management practices that school management uses to implement school construction projects. Since policies tend to be restrictive, controlling, and often set standards to be met, school management adjust their project management practices in light of policy requirements and in some cases, in anticipation of new policy requirement. These changes in project management practices affect the number of projects mounted, speed of project implementation, number of projects completed, and number of projects delayed among other project performance parameters hence the positive indirect effect. The insignificant total effect of school infrastructure policy interpretation on the performance of construction projects aligns with reality in that, when there are no project management practices in the school, it follows that there are no projects being implemented.
REFERENCES
[1] Brown, A. C., Stern, J., Tenenbaum, B., & Gencer, D. (2006). Handbook for evaluating infrastructure regulatory systems. Washington, D. C.: The World Bank. [2] Chan, A. P. C., & Chan, A. P. L. (2004). Key performance indicators for measuring construction success. Benchmarking:An International Journal, 11 (2),
2003-221.
[3] Chan, A.P.C., Scott, D., & Lam, E.W.M. (2002). Framework of success criteria for design/build projects. Journal of Management in Engineering,18(3), 120–128. [4] Coglianese, C. (2012). Measuring regulatory performance: Evaluating the impact of regulation and regulatory policy- Expert paper No. 1. Paris, France: OECD. [5] Dubois, H. F. W. (2014). Ambiguously divided responsibilities across government spheres: How they impact the policy process and result in coordination
problems in the case of Poland. Central European Journal of Public Policy, 8(1), 4–29.
[6] Freeman, M. & Beale, P. (1992). Measuring project success. Project Management Journal, 23(1), 8-17.
[7] Kadzamira, E., & Rose, P. (2001). Education policy choice and policy practice in Malawi: Dilemas and disjunctures. Institute of Development Studies, Working Paper, 124.
[8] Lim, K. C., & Mohammed, A. Z., (1999). Criteria of project success: An exploration re-examination. International journal of project management, 17(4), 243-8. [9] Marishane, R. N. (2013). Management of school infrastructure in the context of a no-fee schools’ policy in rural South African schools: Lessons from the fields.
International Journal of Education Policy & Leadership, 8(5), 1-13.
[10] Ministry of Education and Higher Education. (2015). Education statistics yearbook 2013/2014. Hargeisa, Somaliland: Author.
[11] Moshi, G., & Vavrus, F. (2009). The cost of a ‘free’ primary education in Tanzania. International Critical Childhood Policy Studies,2(1), 32-42.
[12] Ngware, M. W., Oketch, M., & Ezeh, A. C. (2011). Quality of primary education inputs in urban schools: Evidence from Nairobi. Education and Urban Society,
43(1) 91–116.
[13] Patanakul, P. and Milosevic, D. (2009). The effectiveness in managing a group of multiple projects: Factors of influence and measurement criteria. International
Journal of Project Management, 27, 216-233.
[14] Preacher, K. J., Rucker, D. D., & Hayes, A. F. (2007). Addressing moderated mediation hypotheses: Theory, methods, and prescriptions. Multivariate Behavioral Research, 42(1), 185–227.
[15] Sadeh, A., Dvir, D., & Shenhar, A. (2000). The role of contract type in success of R & D defense projects under increasing uncertainty. Project Management Journal, 31(3), 14-21.
[16] Shenhar, A.J., Levy, O., & Dvir, D. (1997). Mapping the dimensions of project success, Project Management Journal,8(2), 5-13.
[17] Shenhar, A.J., Tishler, A., Dvir, D., Lipovetsky, S., & Lechler, T. (2002). Refining the search for project success factors: A multivariate, typological approach. R
& D Management,32(2). 101-109.
[18] Vandevelde, A., Dierdonck, R.V., & Debackere, K. (2002). Practitioners view on project performance: A three-polar construct. Vlerick Working Papers 2002/06: Vlerick Leuven: Gent Management School.
AUTHORS
First Author – Stephen J. Kamau, PhD candidate. School of Open and Distance Learning, University of Nairobi.
Second Author – Prof. Charles M. Rambo, PhD School of Open and Distance Learning, University of Nairobi
Third Author – Dr John Mbugua, PhD School of Open and Distance Learning, University of Nairobi
ISSN 2250-3153
476
Annexe: Data collected from the field
This section presents the data that was collected from the field
1. Performance of Construction Projects
The following indicators were used to measure the performance of construction projects: realization of set standards, the realization of planned deliverables, completed projects’ variance from the initial plans, the functionality of completed projects, end-user satisfaction and, construction team satisfaction with the completed projects. Quantitative data on the variable was collected by questionnaires administered on head teachers. To collect quantitative data, the questionnaire used 10, 5-point Likert type items to measure the performance of construction projects at an interval scale with Strongly Agree (SA)=5, Agree (A)=4, Not sure (NS)=3, Disagree (D)=2 and Strongly Disagree (SD)=1. Quantitative data was analyzed into frequency distributions. The mean, the standard deviation and the composite mean were computed. An open-ended question was also used. The data is presented in Table 1.
Table 1
Performance of Construction Projects
Statements SA A NS D SD MEAN STDV
1 All of the school construction projects
completed in my school have realized their planned standards (+)
78 105 41 4 19 3.89 1.110
(31.6%) (42.5%) (16.6%) (1.6%) (7.7%)
2 The school construction projects
completed in my school have realized their planned deliverables (+)
56 57 57 47 30 3.25 1.326
(22.7%) (23.1%) (23.1%) (19.0%) (12.1%)
3 Most of the construction projects in
the school are completed with minimal variance from the initial plan (+)
2 42 12 134 57 2.18 1.002
(0.8%) (17.0%) (4.9%) (54.2%) (23.1%)
4 All completed infrastructural projects
have attained the intended functionality (+)
30 97 57 3 60 3.14 1.360
(12.1%) (39.3%) (23.1%) (1.2%) (24.3%)
5 In some cases, teachers were not
satisfied with the projects’ outcome (-)
4 45 33 105 60 3.70 1.079
(1.6%) (18.2%) (13.4%) (42.5%) (24.3%)
6 School managementhas expressed
satisfaction with the project outcome of construction projects in the school (+)
30 151 44 19 3 3.75 0.811
(12.1%) (61.2%) (17.8%) (7.7%) (1.2%)
7 There have been some cases where the
project design team has expressed dissatisfaction with the project outcome of some school construction projects (-)
75 153 1 18 0 1.85 0.760
(30.4%) (61.9%) (0.4%) (7.3%) (0%)
8 There have been some cases where
contractors have expressed dissatisfaction with the project outcome of the school construction projects they were implementing (-)
76 153 0 16 2 1.85 0.786
(30.8%) (61.9%) (0%) (6.5%) (0.8%)
9 Some school construction projects
undertaken by the school have received negative MoEHS inspection reports (-)
77 151 1 16 2 1.85 0.792
(31.2%) (61.1%) (0.4%) (6.5%) (0.8%)
10 We have not had cases where projects
being implemented were discontinued for failure to comply with standards (+)
81 143 7 13 3 4.16 0.809
(32.8%) (57.9%) (2.8%) (5.3%) (1.2%)
Composite mean and standard deviation
2.96 0.983
ISSN 2250-3153
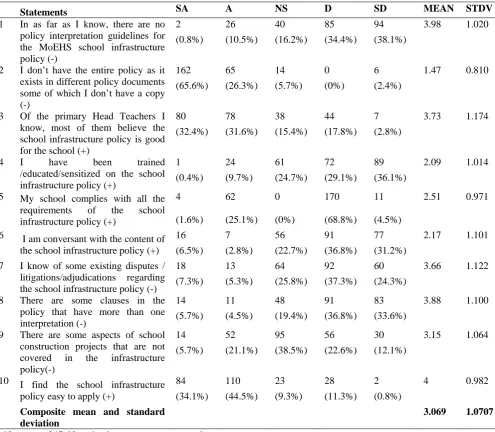
2. Policy Interpretation
In this study, policy interpretation was measured using the following indicators: policy interpretation guidelines, stakeholder attitude on the policy, regulatee’s policy sensitization, policy interpretation disputes and regulatees’ perceived policy ambiguity. Data on the variable were collected through 10 Likert type questionnaire items administered on head teachers using the scale: Strongly Agree (SA)=5, Agree (A)=4, Not sure (NS)=3, Disagree (D)=2 and Strongly Disagree (SD)=1; and semi-structured interviews with DEOs. One open-ended question was also used. The data is presented in Table 2.
Table 2
Policy Interpretation.
Statements SA A NS D SD MEAN STDV
1 In as far as I know, there are no
policy interpretation guidelines for the MoEHS school infrastructure policy (-)
2 26 40 85 94 3.98 1.020
(0.8%) (10.5%) (16.2%) (34.4%) (38.1%)
2 I don’t have the entire policy as it
exists in different policy documents some of which I don’t have a copy (-)
162 65 14 0 6 1.47 0.810
(65.6%) (26.3%) (5.7%) (0%) (2.4%)
3 Of the primary Head Teachers I
know, most of them believe the school infrastructure policy is good for the school (+)
80 78 38 44 7 3.73 1.174
(32.4%) (31.6%) (15.4%) (17.8%) (2.8%)
4 I have been trained
/educated/sensitized on the school infrastructure policy (+)
1 24 61 72 89 2.09 1.014
(0.4%) (9.7%) (24.7%) (29.1%) (36.1%)
5 My school complies with all the
requirements of the school infrastructure policy (+)
4 62 0 170 11 2.51 0.971
(1.6%) (25.1%) (0%) (68.8%) (4.5%)
6 I am conversant with the content of
the school infrastructure policy (+)
16 7 56 91 77 2.17 1.101
(6.5%) (2.8%) (22.7%) (36.8%) (31.2%)
7 I know of some existing disputes /
litigations/adjudications regarding the school infrastructure policy (-)
18 13 64 92 60 3.66 1.122
(7.3%) (5.3%) (25.8%) (37.3%) (24.3%)
8 There are some clauses in the
policy that have more than one interpretation (-)
14 11 48 91 83 3.88 1.100
(5.7%) (4.5%) (19.4%) (36.8%) (33.6%)
9 There are some aspects of school
construction projects that are not covered in the infrastructure policy(-)
14 52 95 56 30 3.15 1.064
(5.7%) (21.1%) (38.5%) (22.6%) (12.1%)
10 I find the school infrastructure policy easy to apply (+)
84 110 23 28 2 4 0.982
(34.1%) (44.5%) (9.3%) (11.3%) (0.8%)
Composite mean and standard deviation
3.069 1.0707
Notes: n =247. Negative items are reverse scored.
3. Project Management Practices
[image:8.595.68.564.188.620.2]Project management practices were indicated by stakeholder involvement in project identification, stakeholder participation in design and planning, project financing sources and, close-out practices after completion. It was measured using 10 Likert-type items on the following scale: Strongly Agree (SA)=5, Agree (A)=4, Not sure (NS)=3, Disagree (D)=2 and Strongly Disagree (SD)=1. Data was collected from head teachers and DEOs in the sampled districts. Responses for the individual items were analyzed into a frequency distribution and the mean, standard deviation and composite mean calculated. The results are shown in Table 3.
Table 3
ISSN 2250-3153
478
Statements SA A NS D SD MEAN STDV
1 Most of the projects we undertake are
identified by our stakeholders (+)
0 0 2 119 126 1.50 0.517
(0%) (0%) (0.8%) (48.2%) (51.0%)
2 We do not consult with stakeholders
when selecting projects (-)
7 161 0 78 1 2.62 0.976
(2.8%) (65.2%) (0%) (31.6%) (0.4%)
3 We do not engage experts to design the
projects (-)
7 169 0 70 1 2.55 0.948
(2.8%) (68.5%) (0%) (28.3%) (0.4%)
4 We always involve our stakeholders in
project planning (+)
57 123 13 9 45 3.56 1.372
(23.1%) (49.8%) (5.3%) (3.6%) (18.2%)
5 We engage the community to finance
school construction projects (+)
75 115 37 20 0 3.99 0.883
(30.3%) (46.6%) (15.0%) (8.1%) (0%)
6 MoEHS has financed most of the
school construction projects in my school in the last five years. (+)
0 0 7 119 121 1.54 0.554
(0%) (0%) (2.8%) (48.2%) (49.0%)
7 As the Head Teacher, I oversee all
project implementation activities for school construction projects in the school (+)
75 135 37 0 0 4.15 0.657
(30.3%) (54.7%) (15.0%) (0%) (0%)
8 We do not engage external parties to
implement school construction projects in the school (-)
6 4 50 73 114 4.15 0.963
(2.4%) (1.6%) (20.2%) (29.6%) (46.2%)
9 As the Head Teacher, I ensure that the
work site has been fully cleaned up before accepting the project as completed (+)
102 115 28 2 0 4.28 0.693
(41.3%) (46.6%) (11.3%) (0.8%) (0%)
10 School construction projects completed
are not inspected against the school infrastructure policy requirements for compliance before being accepted (-)
10 166 0 70 1 2.54 0.961
(4.1%) (67.2%) (0%) (28.3%) (0.4%)
Composite mean and standard deviation
3.09 0.852