Georgia State University
ScholarWorks @ Georgia State University
Public Health Theses School of Public Health
Summer 8-7-2018
Examining Variations of Patient Visit
Characteristics on Lifestyle Counseling Among
Diabetic Patients
Ashley McCook
Follow this and additional works at:https://scholarworks.gsu.edu/iph_theses
This Thesis is brought to you for free and open access by the School of Public Health at ScholarWorks @ Georgia State University. It has been accepted for inclusion in Public Health Theses by an authorized administrator of ScholarWorks @ Georgia State University. For more information, please contact [email protected].
Recommended Citation
McCook, Ashley, "Examining Variations of Patient Visit Characteristics on Lifestyle Counseling Among Diabetic Patients." Thesis, Georgia State University, 2018.
1
ABSTRACT
Examining Variations of Patient Visit Characteristics on Lifestyle Counseling Among Diabetic Patients
By
Ashley Alesia McCook
August 7th, 2018
INTRODUCTION: Hyperglycemia is associated with increased risk of diabetic complications; however, this can be reduced by the maintenance of healthy blood glucose levels. Substantial evidence suggests that glycemic control can improve health outcomes in diabetic patients; however, a lack of translation to practice of interventions' effectiveness. Several barriers to providing counseling may exist. The likelihood of counseling has been hypothesized to be associated with patient, physician and system characteristics.
AIM: Explore variations in lifestyle counseling for US adult diabetic patients along with patient, physician, and system characteristics during clinical visit using the NAMCS dataset.
METHODS: Clinical patient visit data was obtained from the National Ambulatory Medical Care Survey [NAMCS] 2012-2015 for analysis. Multivariate logistic regression was utilized to calculate estimates and adjusted odds ratios for characteristics associated with the likelihood of intervention for diabetic patients.
RESULTS: Among the characteristics included in the statistical models for counseling, were found to be significantly associated with the likelihood of being offered diet and exercise counseling in the logistic model. These include HbA1c testing [OR=1.615]; Shift, hourly physicians [OR=5.370]; EMR meeting DHHS criteria [OR=6.529]; patient race [Hispanic OR=2.074, Black OR=1.337]; physician specialty [cardiology OR=1.402]; patient’s history of chronic conditions [obesity OR=2.524, OR=4.264].
2
Examining Variations of Patient Visit Characteristics on Lifestyle Counseling among Diabetic Patients
By
Ashley Alesia McCook
B.A., Agnes Scott College
A Thesis Submitted to the Graduate Faculty of Georgia State University in Partial Fulfillment
of the
Requirements for the Degree
MASTER OF PUBLIC HEALTH
3
APPROVAL PAGE
Examining Variations of Patient Visit Characteristics on Lifestyle Counseling among Diabetic Patients
By
Ashley Alesia McCook
Approved:
__________________________________________ Committee Chair [Dr. Lee Rivers Mobley]
___________________________________________ 2nd Chair/Committee Member [Dr. Ruiyan Luo]
____________________________________________ Committee Member [Dr. Megha Kumudchandra Shah]
Date
4
Acknowledgments
I would like to thank my thesis committee Dr. Mobley, Dr. Luo, and Dr. Shah for their patience, assistance, and generosity throughout my journey of developing and successfully completing my thesis. Without the help of the three of you, I wouldn't have the opportunity that awaits me this coming September. Also, I would like to thank my coworker Alcides Fernandes Filho who had it not been for I would have never figured out a thesis topic. My family, friends, and significant other; I appreciate the love and support you guys have given me the past 6 months. Dealing with a family illness, full-time job, graduate school, and planning a departure all at once took a toll on my mental health. Thanks for being there in ways that I can't describe in those dark moments. To the professors and peers that I've encountered throughout my graduate experience at GSU, it has been a pleasure to learn from you and consider my friends throughout these past 3 years. Lastly, I'd like to acknowledge the podcasts that provided wisdom, encouragement, and comic relief in the arduous process to complete my thesis and degree: Black Girl Podcasts, Gettin' Grown, Therapy for Black Girls, The Friendzone, The Joe Budden Podcast, Small Doses with Amanda Seales, and The Brilliant Idiots. Psalms 23:5 the scripture says: You prepare a table before me in the presence of my enemies. You anoint my head with oil; my cup overflows. With that said, I will feast. Stanford here I come!!!!!!!
5
Author’s Statement Page
In presenting this thesis as a partial fulfillment of the requirements for an advanced degree from Georgia State University, I agree that the Library of the University shall make it available for inspection and circulation in accordance with its regulations governing materials of this type. I agree that permission to quote from, to copy from, or to publish this thesis may be granted by the
author or, in his/her absence, by the professor under whose direction it was written, or in his/her absence, by the Associate Dean, School of Public Health. Such quoting, copying or publishing
must be solely for scholarly purposes and will not involve potential financial gain. It is understood that any copying from or publication of this dissertation which involves potential
6
TABLE OF CONTENTS
ACKNOWLEDGEMENTS.……… 4
LIST OF TABLES AND FIGURES……….7
INTRODUCTION……….8
1.1Background……….8
1.2Type II Diabetes versus Other Diabetes………....9
1.3Risk Factors and Prevention……….11
1.4Aims of the Study……….11
REVIEW OF LITERATURE……….12
METHODS AND PROCEDURES……….17
3.1 Conceptual Framework……….17
3.2 Data Sources………...20
3.3 Institutional Review Board………...21
3.4. Inclusion/Exclusion Criteria………21
3.5 Independent Variable and Covariates………22
3.6 Dependent Variables……….23
3.7 Statistical Data Analysis………23
RESULTS……….25
4.1 Non-Clinical and Clinical Characteristics………...25
4.2 Multivariate Logistic Models………26
DISCUSSION AND CONCLUSION………29
7
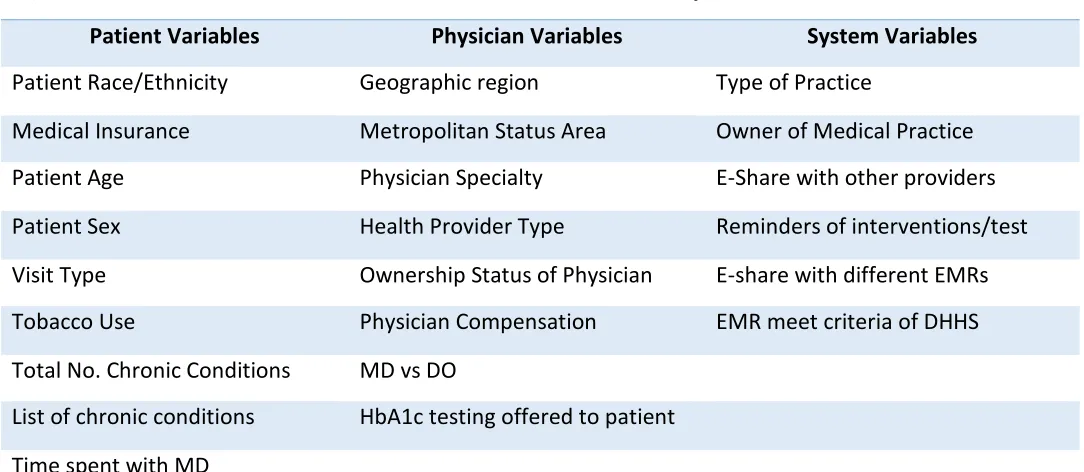
List of Tables & Figures Figure 3.1 List of Patient Visit Characteristics in Analysis
Table 4.1 Patient Visit Non-Clinical Characteristics Offered Lifestyle Counseling
Table 4.2 Patient Visit Clinical Characteristics Offered Lifestyle Counseling
Table 4.3 Parameter Estimates and Odds Ratio of Patient/Physician Characteristics Diet Counseling
8
CHAPTER I: INTRODUCTION Background
Diabetes mellitus, Type 2 [DM II] is a chronic metabolic disease whose prevalence has
been rapidly increasing across the population. Due to this trend, diabetes quickly has become an
epidemic in both developed and underdeveloped countries worldwide. The increased prevalence
of DM II coupled with an influx of an aging population has only exacerbated the burden for
healthcare providers to combat the negative impact on the population’s health (Alim, 2017).
Diabetes accounts for significant part of healthcare expenditures, health related disabilities, and
negatively impacts the workforce. According to the Center of Disease Control, medical costs and
loss of work wages for people with a diagnosis of diabetes total to 327 billion dollars yearly in
the United States of America (Prevention, 2017). Currently, in the U.S. population, 30.3 million
people have diabetes [23.1 million officially diagnosed but 7.2 million people are undiagnosed]
however 84.1 million adults [18 years or older] are pre-diabetic (Prevention, 2017).
People living with this disease are more susceptible to other complications that can
hinder their quality of life and lead to premature death. Patients with hyperglycemia are
approximately two times more likely to be diagnosed with some form of cardiovascular disease
or suffer from a cerebrovascular event [i.e., stroke] than their counterparts without
hyperglycemia (Prevention, 2017). Diabetes is the leading cause of renal failure, limb
amputations, and retinal complications [adult onset-blindness] (Prevention, 2017). Apart from
obesity, diabetes is one of the gateways to other severe and potentially fatal chronic diseases,
adding to the trend of patients living with comorbidities.
For example, according to a New York Times article there is an association between
pancreatic cancer and Type II diabetes. Although diagnosis of pancreatic cancer is rare, it’s
9
2018). Due to delay of symptoms and early detection biomarker test, survival rates for patients
with this diagnosis is very poor. People who are more likely to develop pancreatic cancer have
one of the following risk factors:
• Older age
• African-American or Ashkenazi Jew
• Two or more first-degree relatives who have cancer
Tobacco smoking, originally known risk factor, accounts for 20-25% of pancreatic cancer
despite the decline over the past few decades (Brody, 2018). However, it’s discovered that the
main risks of pancreatic cancer and deaths are obesity, Type II diabetes, and metabolic
syndrome. The severity of obesity and Type II diabetes is attributable to the rise of pancreatic
cancer. When the body resists insulin, the pancreas produces excess insulin promoting cell
growth including cancer cells. It’s stated that 50-80% of pancreatic cancer patients have diabetes
or impaired glucose tolerance (Brody, 2018). However, research has discovered that patients
who have better glycemic control through metformin reduce the risk of pancreatic cancer and
better rates of survival.
Although currently no cure for this chronic disease, there are different methods of
hyperglycemia control such as oral hypoglycemic agents, insulin sensitizers [metformin],
biguanide, and more innovative medications. However, there are other treatment modalities such
as lifestyle modification that focus on nutrition and physical activity that are not cost effective
over time but are useful in controlling blood sugar level in patients who have diabetes.
Type II Diabetes versus Other Diabetes
Diabetes is a chronic condition that disrupts the way a person’s body metabolizes
10
insulin to regulate blood sugar or doesn’t produce an adequate amount of insulin to control a
consistent glucose level (Knowler, Barrett-Connor, Fowler, & Hamman, 2002). Untreated
hyperglycemia over time can cause health complications such as failure of vital organs including
the eyes [retinopathy], kidneys [nephropathy], heart, etc. (Ali MK, 2013). There are three types
of diabetes: Type I, Type II, and gestational diabetes.
Type I diabetes, also known as juvenile diabetes, is caused by an autoimmune response
that destroys pancreatic cells preventing the body from producing insulin. Approximately five
percent of people diagnosed with diabetes have Type I. Although the exact cause of Type I
diabetes is unknown, potential attributable factors causing Type I diabetes include genetics,
exposure to viruses, and other environmental factors.
Gestational diabetes is an ephemeral condition of diabetes-induced during pregnancy. An
infant that is born to a mother diagnosed with gestational diabetes has an increased risk of having
health complications. Although gestational diabetes majority of the time is temporary,
gestational diabetes predisposes women to an increased likelihood of being diagnosed with Type
II diabetes. Also, the offspring born to women with gestational diabetes have increased odds to
become obese during adolescence and developing Type II diabetes later in life.
Type II diabetes or adult-onset diabetes is slightly different from Type I diabetes.
Although under the condition of DM II insulin is produced, the body is not producing an
adequate amount of insulin or is resistant to the insulin produced. Because of this malfunction,
the body is unable to maintain a consistent and normal glucose level [hyperglycemia]. Most
patients diagnosed with diabetes have DM II. Unlike Type I diabetes where it is not known how
11
maintaining a healthy weight, eating a balanced, healthy diet, and getting an adequate amount of
physical activity consistently (Balas, 1998).
Risk Factors & Prevention
Although the different types of diabetes possess the same consequences when it comes to
the longevity and complications of the patient’s health, Type II diabetes is a bit more preventable
based on specific risk factors and method of prevention. Some of the known risk factors that
increase the likelihood of developing diabetes are classified as clinically overweight or obese, 45
years of age or older, having a family history of diabetes, race/ethnicity [people of African,
Hispanic/ Latino, American Indian or Alaska Native descent have a higher incidence of diabetes]
, diagnosis of pre-diabetes [hyperglycemia- abnormal glucose level but not high enough for
diabetes diagnosis], physical active less than 3 days per week, and medical history of
hypertension; hyperlipidemia; and history of gestational diabetes during pregnancy (Kreuter,
Scharff, Brennan, & Lukwago, 1997). However, there are many methods of prevention to
decrease the likelihood of developing DM II and mitigate the effects of diabetes such as
consuming a healthy balanced diet and getting an adequate amount of physical activity to
consistently control glycemic level in diabetic patients (Knowler, Barrett-Connor, Fowler, &
Hamman, 2002). Even though the strong empirical evidence of lifestyle interventions are more
effective at improving glycemic control in patients diagnosed with diabetes, other studies that
reflect a lack of effectiveness of translation from clinical research into practice. It is estimated
that it would take approximately take 17 years for a small percentage of research to integrate into
12
Aims of the study
Our data analysis for this research study aims to explore the variations in counseling
offered based on patient, provider, and system characteristics for patients diagnosed with Type II
diabetes to discover the potential characteristics that influence the likelihood of receiving an
intervention. Using the National Ambulatory Medical Care Survey (NAMCS), the study’s
analysis will address the following research questions:
Question 1: Are patient characteristic variations associated with the likelihood of adult
diabetic patients being offered lifestyle counseling in the US?
Question 2: Are provider and system characteristic variations associated with the
likelihood of adult diabetic patients being offered lifestyle counseling in the US?
Despite the trends of lifestyle counseling offered to diabetic patients in the ambulatory
setting not being well known and other studies’ attempts to conduct analysis that lacked
statistical power and quality of complete data for study analysis, our goal is to provide more
information for community feedback to better identify and understand the barriers from these
selected levels of characteristics when it comes to receiving lifestyle counseling.
CHAPTER II: REVIEW OF THE LITERATURE
Statistics showed a population increase of diagnosis of diabetes from 3.5% in 1990 to
7.9% in 2008. A study whose objective was to update the national trends of diabetes
[undiagnosed or diagnosed] discovered the mean BMI of the adult U.S. population increased
significantly [p<0.001] (Menke A, 2015). The prevalence of obesity changed significantly from
21.1% in 1988-1994 to 32.4% among people diagnosed with diabetes in 2005-2010 (Menke A,
2015). Simultaneously, the prevalence of total diabetes [diagnosis plus hemoglobin A1c ≥ 6.5]
13
9.9% [9.2%-10.7%] 2005-2010 (Menke A, 2015). A similar trend increase was observed when
diagnosed with diabetes and fasting glucose count [≥ 126 mg/dL] (Menke A, 2015). However,
more alarming is the prevalence of undiagnosed diabetes that reflects a similar increasing trend.
Unfortunately, for ethnic minorities and geriatric population the prevalence of diabetes is
substantially greater including undiagnosed diabetes, treatment type, and blood sugar control in
comparison to their white counterparts. Non-Hispanic Black prevalence for diabetes is 15.4%
versus their white counterparts at 8.6%. Mexican-American prevalence fair no better when it
comes to diabetes 11.6% versus 8.6% whites (Selvin, Parrinello, Sacks, & Coresh, 2014). When
focusing on medication usage among diagnosed patients, prevalence still varies among different
ethnic groups. For example, reports on diabetic patients utilizing medication-only shows that
only 52% [46.2%- 56.7%] of Non-blacks and 43% [38.1%-49.0%] of Mexican-American had a
HbA1c level were less than 7.0% in comparison to 57% of Non-Hispanic White (Selvin,
Parrinello, Sacks, & Coresh, 2014). Once adjustments were made in the model to include
demographic and adiposity factors, it strongly attenuated and explains the total diabetes
prevalence in the U.S. Other studies have discovered an association between diabetes functional
status, mobility, cognition, fracture risk and life expectancy which explains the high burden of
diabetes in the older adult U.S. population. The high burden of diabetes, prediabetes, poor rates
of glycemic control [even patients treated with medications] has only increased the burden of
diabetic patients having a greater risk for diabetic complication and developing multiple
comorbidities (Morrison, Shubina, & Turchin, 2012). Despite the study’s findings revealing that
the prevalence of undiagnosed diabetes was relatively stable and increase of glycemic control
among diabetic patients, which may be attributable to improvements in initiatives for screening
14
that isn’t achieving the normal hemoglobin A1c levels especially among blacks and
Mexican-Americans (Albright AL & EW, 2013). Because of these additive burdens, the health of the
population has an increased likelihood of declining at an alarming rate. However, these trends
influence the population health but also a significant increase in the healthcare expenditure to
compensate for the medical crisis.
A study conducted by the Institute for Health Metrics examined the estimates of national
spending on personal health care and public health when stratifying by disease, age, sex, and
type of care in the U.S. population. The study utilized government budgets, insurance claims,
surveys from medical facilities, household surveys, and other U.S. records from 1996 to 2013 to
estimate spending based on 155 medical conditions and 38 age and sex groups. Although the
study found ischemic heart disease and cerebrovascular to be the most significant condition of
spending at approximately 231.1 billion dollars in 2013, diabetes along with a few other health
conditions trailed slightly behind as the second largest condition with spending of 224.5 billion
dollars (Dieleman, Baral, Birger, Bui, & al., 2016). Regarding resource and retail pharmaceutical
expenditure, total diabetes takes the lead with approximately 101.4 billion on resources, and
57.6% accounted for pharmaceutical spending (Dieleman, Baral, Birger, Bui, & al., 2016). The
spending on diabetes was incurred by the 45 years and older population which further aligns with
the high burden of diabetes in the aging population from previous studies. With these current
trends, it explains Diabetes’ significant attribution of morbidity and mortality with an estimated
cost of 245 billion dollars in health resources and lost productivity with no slowing down if
appropriate measures are not taken in the future (Dieleman, Baral, Birger, Bui, & al., 2016).
15
there is extensive research conducted to discover a solution to the medical and financial crisis of
diabetes.
A double-blind clinical trial study examined the effectiveness of different treatment
methods that would delay or prevent the development of diabetes. During the study, 3234
pre-diabetic patients from 27 centers were randomly allocated to three treatment groups: placebo,
metformin [hyperglycemic medication], and intensive lifestyle intervention [focus on weight loss
and physical activity]. Participants were of the age of 25 years or older, BMI of 24 or higher, and
plasma glucose concentration of 5.3 to 6.9 mmol per liter in a fasting state and 7.8 to 11.0 mmol
per liter two hour after a 75-g oral glucose load, and that weren’t taking altering glucose
tolerance medication or other illness that compromise the patients’ life expectancy.
At the end of the follow-up period, the cumulative incidence of diabetes was lower in the
lifestyle intervention group and metformin. The incidence of diabetes in the lifestyle intervention
group was approximately 58% lower and 31% of the metformin group in comparison to the
placebo group (Morrison, Shubina, & Turchin, 2012). These results were found to be statistically
significant even with the adjustment of baseline characteristics. The projected incidence of
diabetes at three-years of follow-up is estimated to be 28.9%-placebo, 21.7%-metformin, and
14.4%-lifestyle intervention groups.
Similar trends were seen when applied to the effectiveness of restoring normal fasting
glucose levels among the metformin and lifestyle intervention groups (Morrison, Shubina, &
Turchin, 2012). However, the lifestyle interventions were more effective in restoring normal
post-load glucose levels and among older participants who is the most vulnerable to diabetes.
Similar studies conducted by the Diabetes Prevention Program in the U.S. and Finland show
16
reduction in diabetes incidence among study participants in the intensive lifestyle intervention
group compared to those in the placebo group (Lindstrom, Louheranta, Mannelin, Rastas, & al.,
2003).
There is extensive research that reveals an association between electronic health record
adoption and maturation over time to patient health outcomes coupled with hospital
characteristics, i.e., hospital size and teaching status (Lin, Jha, & Adler-Milstein, 2018). There is
a growing trend in thought that integrating patient outcomes with electronic health records
promotes patient-centered care, research, and overall population health. A U.K. study attempted
to quantify and stratify diabetic patients’ electronic records with the intent to create a severity
score and ability to predict the risk of future health outcome due to diabetes. The purpose of the
study conducted in the U.K. was to find a tool for primary care physicians to take preventive
measures according to patients’ severity of risk for chronic conditions. High performing and
quality electronic health records systems and configuration can be influential to the patient health
outcomes of medical practices (Zghebi, Rutter, Ashcroft, Ashcroft, & al., 2018). Characteristics
of the dataset that proxy EEMR capabilities of every medical practice sampled will also be
included in the studies analysis to see if variations of EEMR capabilities are associated with the
likelihood of diet and physical activity counseling.
Although these studies show promise of effectiveness and applicative to different
demographics ethnically; culturally; economically diverse population, these studies lack the
statistical power to assess the effects for subgroup analysis to detect a difference in the effect of
treatments. Several studies have shown a lack of translation from clinical trials to clinical
practice. It is predicted that it would take approximately 17 years for a small percentage of
17
barriers and variation in the patient, provider, and system characteristics could explain the lack of
counseling offered in the ambulatory setting to improve glycemic control across the population.
CHAPTER III: METHODS AND PROCEDURES Conceptual Framework
Selected predictors in our analysis were based on the common factors that attribute to the
observed burden of Type II Diabetes and variations in counseling from previous studies
mentioned in the literature. Studies conducted that examined the prevalence and trends of U.S.
adults observed that race/ethnicity, age, BMI were significant factors in analysis. Unadjusted
prevalence of total diabetes where higher in age group 65 years and older when compared to
younger counterparts (Menke A, 2015). Similar prevalence observations were seen among men
and women. Non-Hispanic black, non-Hispanic Asian, and Hispanics when controlling for age
had higher prevalence diabetes in comparison to their white counterparts (Menke A, 2015). BMI
reflected similar trends in prevalence rates in different race/ethnic groups with the exception that
non-Hispanic Asian possessed lowest BMI. However, the diabetes trend in prevalence was
significantly increasing over time for all age groups regardless of race/ethnicity, education level,
and income.
Another study observed similar trends for Type II diabetes prevalence in the population.
Despite the prevalence of glycemic control improving and stability of undiagnosed in the study
analysis, there was a significantly greater prevalence of diabetes, undiagnosed diabetes, glycemic
control in different ethnic groups. A difference in diabetic treatment types among ethnic minority
groups i.e. non-Hispanic blacks and Mexican Americans was reflected in the result of analysis
(Selvin, Parrinello, Sacks, & Coresh, 2014). A study in Nova Scotia patient examined patient
18
patients are provided with diet or exercise advice. Out of the 38 % [diet] and 42% [exercise] of
patients who received advice for diet, patient who identified as a male, older than 35 years age,
more than one chronic condition, and good professional relationship with provider were more
likely to receive advice on diet and exercise (Sincliar, Lawson, & Burge, 2008). In terms of the
number of chronic illness, studies have shown that there is a positive association between the
number of chronic conditions of the patient and the likelihood of counseling (Sincliar, Lawson,
& Burge, 2008). This means physician are inclined to provide lifestyle counseling to patients
already sick. There is substantial evidence that patient characteristics are associated with the
likelihood of counseling; however, evidence supports that physician characteristic play a vital
role as well.
A study evaluating cholesterol management practices of physicians in the United states.
Like previous studies patient-level variables that were observed to be associated with the
likelihood of counseling of previous studies; however, physician characteristics added to the
missing explanation of variations of method of counseling offered to patients. Analysis of the
study revealed that physician specialty [cardiologist] were significantly more likely to offer
counseling when adjusting for other patient variables. Another study that observed at risk
cardiovascular disease in ambulatory settings rate of receiving, observed similar trends as
previous studies mentioned. These studies provide further evidence to support the association of
physician-level variables and lifestyle counseling offered by physicians. Patient visits with
physician approximately 20 minutes or longer, providers seen during the visit [physician,
physician assistants, and nurse practitioner], internists and cardiologists, insurance status,
geographic region, and metropolitan status area of site of care were significantly associated with
19
We hypothesize that these characteristics examined in the literature will be significant
predictors for the analysis of the study. Patients who are severely sick or more susceptible to
illness due age, race/ethnicity, insurance status, total number of chronic illnesses are more likely
to receive diet and physical activity counseling. As the prevalence of BMI over 30 increases,
more of the population are at risk for having multiple coexisting chronic illnesses (Alim, 2017).
The prevalence of BMI has a strong association with other chronic disease such as diabetes,
hypertension, and hyperlipidemia. Because of this significant relationship obesity could explain
the variations in the analysis. Insurance status/type for the patients potentially explain the
variations in odds of counseling, patients who lack access to healthcare may be less likely to be
offered counseling.
Physician-level characteristics such as physician specialty, medical degree possessed
[MD vs D.O], provider seen during visit, geographic region of physician sampled, Metropolitan
status area, ownership status of physicians, and basic compensation will be utilized in the study.
These variables variations can reflect a difference of medical training, comfort level, and
strategical plan of reducing the risk of disease of their patients. The severity of patient illness
seen may be influential to how often physician recommend counseling especially with specialties
such cardiology. The location of the physicians selected for the data could be associated with the
outcome of interest for the study. The physician selected could treat patients that live in
communities that lack access to appropriate healthcare, live in food desserts, severity of diseases
burden, and sociodemographic of communities in the regions observed.
Although EMR capabilities has mixed reviews on its association of patient health
outcomes. We believe that EMR capabilities would be a great reflection of system-level
20
capabilities, for example ability to access and sharing patient health information from another
facility’s EMR system or meeting the Department of Health and Human Services criteria, would
be associated with the variations of lifestyle counseling for diabetic patients. Efficient EMR
capabilities and sharing PHI could give provider thorough information about the patient’s health
to take the appropriate measures to improve patient health. This could also be associated with the
amount of time spent with patients as well. All the variables that will be utilized in our analysis
will encompass more characteristics that can explain the variations in proportions of counseling
in comparison to previous studies of this nature.
Data Sources NAMCS
The National Ambulatory Medical Care Survey [NAMCS] is a national survey collected
by the Center of Disease Control’s National Center for Health Statistics annually since 1973.
NAMCS was designed with the intent to meet the need for objective, reliable information about
the provision and use of ambulatory medical services in the U.S. Physicians who are nonfederal
employed office-based and primarily concentrated in direct patient care [including community
health center-CHCs] were included during data collection. Specialties including anesthesiology,
pathology, and radiology were excluded from the survey data collection.
Each physician that participates in the data collection is randomly assigned to a 1-week
reporting period of patient visit information. The unit of analysis in the NAMCS survey is the
patient visit. The data for the systematic random sample of patient visits are recorded by official
census interviewers using patient record forms. The survey data capture patient characteristics
such as age, sex, race/ethnicity and visit characteristics such as patient's reason for visit, official
21
Along with the patient and visit characteristics collected, data about physician and
practice characteristics are documented during the survey induction interview. NAMCS data is
collected from physicians instead of patients with the intent to provide an analytic base that
expands the information on ambulatory care through other National Center for Health Statistics
surveys. Survey data collected from 2012 through 2015 utilized a new sampling design allowing
national estimates for all four census regions and 34 of the United States most populous states.
For the NAMCS survey data collection process, the physician sample is composed of
MDs and DOs from various specialties in the medical field. Physicians based on information
from the American Medical Association and American Osteopathic Association are randomly
selected to provide patient clinical data of 30 patients visit during their 1-week of the reporting
period. Due to NAMCS larger sample size; the ability of national representativeness in the data;
and the information obtained have patient, provider, and visit characteristics, NAMCS survey
data is the most reliable for the data analysis of our research question to attempt fill in the gap of
knowledge from prior existing studies.
Institutional Review Board Approval
For the data analysis of our thesis, secondary public use data was utilized to answer the
research questions and didn’t require IRB approval. The NAMCS survey data is a preapproved
data source with exempt status determined by the Georgia State University IRB based on
Institutional Review Board Policies.
Inclusion/Exclusion Criteria
For the statistical analysis of this thesis, patient visits were sampled from the merged
survey cross-sectional dataset from 2012 through 2015 consisting of 42,215 visit observations.
22
The survey question that prompted the determinant of the patient’s diabetes status is "Does the
patient now have: Diabetes mellitus (DM), Type 2” which is categorized into responses of yes or
no.
The following exclusion criteria are:
• Patients that were not 18 years of age or older at the time of visit
• Not diagnosed with Type II diabetes before being discharged from patient visit
[excluding patients with Type I or unspecified].
• Patient is pregnant during observation period.
• Any patient with missing information of lifestyle counseling was offered [defined as
diet/nutrition counseling and physical activity counseling].
These observations were excluded from analysis to produce the least biased estimates for
appropriate inferences. Once inclusion and exclusion criteria were applied to produce the sample
of interest [U.S. adults patients diagnosed with Type II diabetes], only 3,463 resulted in the final
sample size for the statistical data analysis of the research study.
Predictor Variables
The predictor variables used for analysis were recorded by census interviewers based on
randomly select physicians during their 1- week reporting period for the NAMCS survey from
2012-2015. The target population for our analysis was operationalized with the diagnosis of
Type II diabetes during the patient visit. The patient visit variables used in our analysis consisted
of race/ethnicity, insurance type, age, sex, geographic region, metropolitan area status, patient
visit type, tobacco use, total number chronic disease [comorbidities], time spent with physician
during patient visit, and other diagnosed disease during patient visit [each disease documented on
23
Revision, Clinical Modification- ICD-9-CM code]. The NAMCS forms also report provider and
system variables such as the type of health provider seen at the visit, physician specialty, type of
doctor, ownership status of medical practice, type of practice, basic compensation for the
physician, owner of the facility, and electronic medical record capabilities.
All predictors in our analysis are categorical/dichotomous due to the distribution of the
variables were re-coded into a categorical variable because of lack of normality to be a
continuous variable, i.e., total number of chronic disease, time spent with the provider, and
patient's age during the visit via statistical testing. All predictors for statistical analysis have no
more than 10% of missing observation in the dataset to prevent any bias in the analysis.[Refer to
Figure 3.1 for full list of variables in analysis].
Dependent Variables
The two dependent variables of interest are the documented provision of diet and exercise
counseling on the NAMCS survey forms collected. The outcome variables of interest from
previous studies are the same in this analysis which is the offering of diet or exercise counseling.
Like the independent variables selected for analysis, the outcome variables are categorized as yes
or no response of whether physician sampled in the survey data offered counseling.
Statistical Data Analysis
All statistical analyses for the research study were conducted using SAS 9.4 for Windows
software [Statistical Analysis Software System 9.4]. Each visit to the NAMCS is assigned
appropriate patient and physician weights for each visit data collected. The patient [PATWT] and
physician-level [PHYSWT] weights take into account the unequal selection probabilities from
the sample design and nonresponse. Omitting the sample weights from the survey data would
24
larger target population, only to the sample used for analysis. All analyses take into account
survey weights from patient weights which were available in the NAMCS datasets selected for
the research study from 2012-2015. The patient weights were utilized in the analysis for national
and regional estimates to represent the physicians and patients from the US observed in all four
regions of the United States [Northeast, South, Midwest, West] and different metropolitan
statistical area.
Descriptive statistics were conducted through PROC SURVEYFREQ to illustrate the
frequency distribution of the visit, patient, provider, and system characteristics among diabetic
patients offered both diet and exercise counseling from 2012-2015. Rao Chi-square tests were
used on all the categorical variables from the survey data to detect any associations between the
different characteristics and offered counseling among diabetic patients.
Using the PROC SURVEY LOGISTICS procedure in SAS 9.4, multivariate logistics
regression analysis was utilized to produce two models [diet and exercise counseling offerings]
beta estimates, standard errors, p-values, and adjusted odds ratios and respective 95% confidence
intervals of all the patient, physician, and system level characteristics examined in the analysis.
Both constructed models of intervention counseling included physician specialty, medical
insurance, different chronic disease conditions [hypertension, hyperlipidemia, CKD, and etc.],
HbA1 testing offered to patient, method of basic compensation for physicians, patient’s sex,
metropolitan statistical area, computerized capabilities: reminders for intervention/screening;
practice share of PHI electronically, EMR meet Department of Health and Human Service
criteria, provider type seen during patient visit, patient race/ethnicity, regions where physicians
were randomly sampled, obesity, total chronic disease, and substance/alcohol dependence. The
25
selected based on the previous literature of frequent contributors (Stafford, Blumenthal, &
Pasternak, 1997) to variations and stepwise model selection procedure with an entry probability
of p<0.01 and removal probability of p<0.05. The models for each lifestyle counseling were
chosen based on the conceptual framework, and the best statistical model fits according to
Akaike Information, i.e., AIC.
Statistical analyses were performed at an alpha level of 0.05 level and 95% confidence
intervals to determine if univariate and logistic regression analysis were statistically significant.
CHAPTER IV: RESULTS Non-Clinical and Clinical Characteristics
In the NAMCS dataset utilized in the study’s analysis, we identified 42,215 patients from
2012-2015. After excluding patients who were younger than 18 years of age; diagnosis of a type
of diabetes other than type II [Diabetes Mellitus type I or unspecified], pregnant during patient
visit recorded; and missing information of diet and exercise counseling offered during patient
visit, the final dataset was composed of 3,463 observation that fit the criteria of the study.
Tables 4.1 and 4.2 display the descriptive statistics of non-clinical and clinical
characteristics of the study population by diet/nutrition counseling and physical activity
counseling offers by randomly selected physicians. All non-clinical variables in the univariate
analysis considered in the study reflected the patient, physician, and some medical practice
(system) characteristics from the dataset. When comparing the weighted percentages/proportions
of the non-clinical characteristics, proportions of intensive lifestyle counseling seem to be similar
among diabetic patients who were offered counseling or not offered during the visit. However,
when the Rao-Scott Chi-Square test results are examined some characteristics have statistically
26
Metropolitan Statistical Area status of physician location [p=0.0147], physician specialty
[p=0.0112], and patient’s tobacco consumption status [p=0.0005], patient’s time spent with
provider during visit [p=0.0161] were the only non-clinical characteristics statistically associated
with the diet/nutrition offering groups. However, Metropolitan Statistical Area status of
physician location [p=0.0374], physician specialty [p=0.0195], health provider seen [p=0.0271],
and basic compensation of the physician randomly selected [p=0.0461] are statistically
associated with the physical activity offering groups.
Table 4.2 analyzes the association between clinical characteristics, i.e., chronic
comorbidities other than Type II diabetes and the outcome of interest in our study. Based on the
univariate analysis of patient chronic illness, cancer[p=0.006]; history of pulmonary embolism
[p=<0.0001]; and hyperlipidemia [p=0.0168] are statistically associated with dietary counseling.
However, arthritis[p=0.0386] was the only clinical characteristic statistically associated with
physical activity counseling. Obesity [p=<0.0001] is statistically associated regarding the
offering of diet and exercise counseling. Obesity was the only clinical characteristics statistically
significant among both intervention groups among diabetic patients. All variables with less than
10% missing observations are included in the analysis to reduce the likelihood of inducing bias
in the statistical models.
Multivariate Logistic Models
Multivariate logistics models were fit for diet/nutrition counseling and exercise
counseling respectively. All characteristics in the models are based on the conceptual framework
and univariate analysis. Tables 4.3 and 4.4 display the beta estimates, standard error, adjusted
odds ratios and 95% confidence interval for all the non-clinical and clinical variable chosen for
27
exhibited differences in adjusted odds ratio, only a select group of characteristics were deemed
statistically significant in the models.
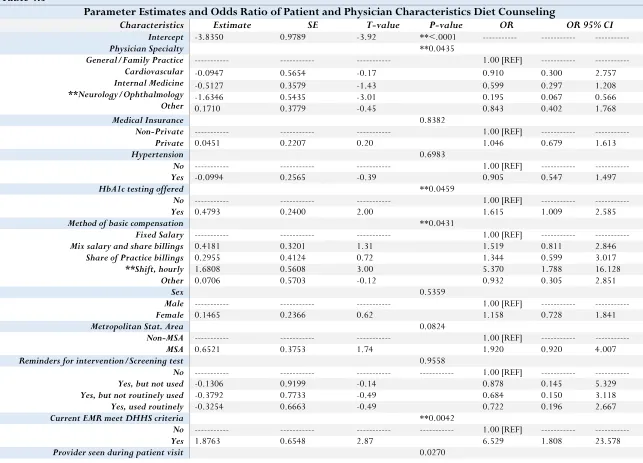
In model 1, the response variable for analysis was diet and nutrition counseling offered
by a physician and predictors were selected based on univariate analysis. For the patient level
characteristics, patients who identify as having Non-Hispanic black or Hispanic racial-ethnic
backgrounds, have an increased likelihood of being offered dietary counseling than their
Non-Hispanic White counterparts [Non-Non-Hispanic black OR=1.337 (0.686, 2.606) Non-Hispanic OR=2.074
(1.189,3.618)]. Patients who identified as Hispanic in the survey have a statistically significant
adjusted odds ratio of counseling than their Non-Hispanic White counterparts in the analysis
results. However, patients who identified as Non-Hispanic other had a smaller likelihood of
counseling relative to Non-Hispanic white participants [Non-Hispanic Other OR=0.890 (0.205,
3.868)]. Although some of the chronic conditions reveal variance in the odds of nutrition
counseling, obesity [OR=2.524 (1.551,4.109)] and cancer [OR=0.499(0.291,0.855)] were the
only statistically significant adjusted odds ratio. Patients who were clinically obese were 2.524
times the odds to be offered diet counseling in comparison to patients who are not clinically
obese. However, the opposite occurred in patients diagnosed with cancer. Cancer patients were
0.499 times the odds to be offered counseling than patients who were not diagnosed with any
form of cancer.
For the physician characteristics, there were also variations in the likelihood of diet
counseling. When controlling for other covariates, patients who are offered HbA1c testing is
1.615 times the odds to be offered diet counseling than patients who are not offered to test for
HbA1c. Surprisingly, physician’s compensation seems to be associated with diet counseling
28
share billings OR=1.519 (0.811, 2.846), and Share of practice billings OR=1.344 (0.599, 3.017)
in comparison to Fixed salary]. Physicians compensated through an hourly rate had a statistically
significant adjusted odds ratio. Interesting, in the analysis, it was observed that physician’s
whose specialty is Neurology/Ophthalmology had 0.195 odds of offering nutrition counseling
than physicians in General/Family practice specialties. Also, medical practices’ electronic
medical records have an association on counseling outcomes. For example, patients who attend a
visit in a medical practice whose EHR meet the Department of Health and Human Services 6.529
times the odds to be offered nutrition counseling than those who visit medical practices with
EHR that don't meet DHHS criteria.
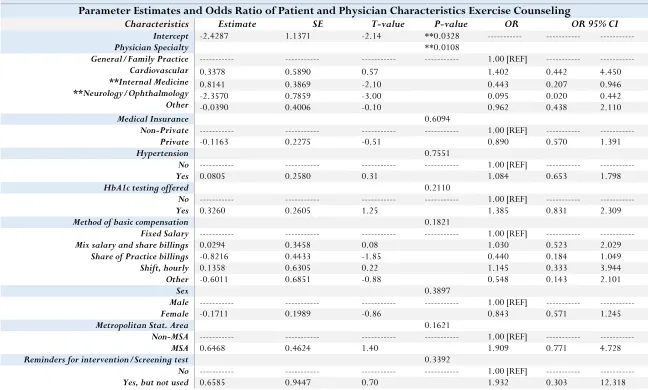
Model 2 is in respect to the physical activity counseling among diabetic patients in the
data analysis. Like model 1, the predictors in model 1 that were adjusted where selected for the
statistical model also there were similar variations in the odds for receiving physical activity
counseling. However, unlike model 1 there are other interesting variations at patient and
physician-level that wasn't observed in model 1. Cardiologists are 1.402 times the odds to offer
diabetic patients exercise counseling than General Practice /Family Practice physicians.
Specialties in Internal Medicine and Neurology/Ophthalmology has a statistically significant
decrease in the likelihood of offering physical activity counseling [OR=0.443 (0.207,0.946),
OR=0.095(0.020, 0.442)]. All racial/ethnic groups have an increased likelihood of offered
physical activity in comparison to their white counterparts [Non-Hispanic Black OR=
1.248(0.650, 2.397), Hispanic OR=1.566 (0.800, 3.068), Non-Hispanic Other OR=1.506
(0.401,5.664)] despite not being statistically significant. Physicians sampled from the southern
region were 1.340 times the odds to offer exercise counseling than physicians sampled from the
29
variables in the model, has attenuated odds ratio in comparison to model 1. Clinically obese
patients are 4.264 times the odds of receiving physical activity counseling than patients of a
healthy weight. Also, patients diagnosed with COPD have a statistically significant adjusted odds
of 2.904 odds of being offered exercise counseling than patients without COPD.
Interestingly, some characteristics decrease the likelihood of being offered exercise
counseling. For example, diabetic patients that suffer from chronic kidney disease have 0.200
odds of physical activity counseling in comparison to their counterparts without CKD. As far as
the ownership of medical practices sampled for analysis, medical practices owned by an
insurance company or other health corporations are 0.412 times the odds to offer diabetic
patients physical activity counseling than physician or physician group owned medical practices.
The type of entity that owns a medical practice was observed to be statistically significant in our
model.
CHAPTER V: DISCUSSION AND CONCLUSION Conclusion
The main objective of this study was to examine the potential variations in the patient,
physician, and system characteristics that are associated with the likelihood of diabetic patients
offered diet and physical activity counseling. Due to the burden of Type II Diabetes in every
aspect of healthcare, effective uniform counseling is critical to improve population health. At the
end of the analysis, we observed that there are definite factors on all three levels that influence
the variations of this intervention being offered to diabetic patients. When controlling for other
covariates in the model for diet counseling, we observed statistically significant odds ratio for
testing of HbA1c for diabetic patients, methods of basic compensation, current EMR meets
30
diagnosis of cancer. For the exercise counseling model, the statistically significant odd ratios
were physician specialty; provider seen during visit; diagnosis of CKD; status of obesity; history
of COPD; and ownership of medical practice. These results from our logistic model suggests that
patient characteristic aren’t the only factors that can explain for the variations of likelihood of
counseling. Previous studies that examined the effectiveness of lifestyle counseling of diabetic
patients only focused on the variations among patient characteristic. Our results from analysis is
very important to address the gap of translation in practice for counseling among diabetic
patients. Variation in these characteristics reflect barriers of improving population health among
the diabetic population. If there is knowledge of what is contributing to these barriers for diabetic
patients, then we can better reduce the burden of diabetic complication overtime.
Discussion
Although patient characteristics have been the primary focus on to improve the DMII
burden of the population health, to effectively create an intervention to significantly reduce this
burden and improve the cost of healthcare all patient visit characteristics must thoroughly be
examined. Previous studies have shown that lifestyle intensive intervention is effective for
increasing the likelihood of diabetic patients consistently controlling their glycemic levels and
decreasing the likelihood of having diabetic complications. However, the lack of translation from
clinical trials to clinical practice may be attributable to the lack of attention to physician and
medical practice.
The following characteristics were observed to be statistically significant in our model,
including HbA1c testing [OR=1.615]; Shift, hourly physicians [OR=5.370]; EMR meeting
DHHS criteria [OR=6.529]; patient race [Hispanic OR=2.074, Black OR=1.337]; physician
31
OR=4.264. As stated in previous studies and reiterated in our analysis, patients who identify in
certain racial/ethnic groups and possess BMI over 30 [obese] are more likely to be recommended
diet or exercise counseling. For physician-level characteristics, physicians who work hourly
shifts; offered HbA1c testing to patients and specialize in Cardiology more likely to offer
lifestyle counseling. Cardiologist may be more likely to offer diet and physical activity
counseling because of the health severity of the patients they encounter during medical patient
visit in comparison to other specialties. Logically, patients who receive HbA1c testing are more
likely to receive counseling makes sense. HbA1c is the main tool of observing the pattern of
blood sugar levels over time. Finally, EMR capabilities meeting DHHS criteria would create
variation of offering because physician would have the full scope of patient’s medical history
and current state of health to make the appropriate and strategic plan to improve the patient’s
health. Many factors that were observed increased the likelihood of counseling, but other factors
decreased the likelihood of counseling for diabetic patients. CKD and Cancer patients were
observed to be less likely to be offered counseling in our analysis. These observations may be
due to the severity of the chronic disease to which such counseling would be counterproductive
to the recovery of patients' health, or the sample of cancer and CKD patient are too small for
analysis.
MSA is a variable that represents the Metropolitan status area of the physicians’ location
in the NAMCS dataset. MSA is census marker to describe the size of a geographic location’s
population. In the survey, MSA proxy whether physician location is an urban area with a
population of 50,000 or more [MSA] or rural area with a population of less than 50,000
[MSA]. The response in the survey for this question is reflected by an answer of MSA or
32
in the univariate analysis that MSA was statistically significant for diet and exercise counseling,
MSA lost statistical significance when included in the logistic regression model when controlling
for other non-clinical and clinical variables. A reasonable explanation for these observations is
the univariate analysis between MSA and the outcome interest, MSA reflected all the variance in
the relationship between the predictor and outcome variable.
Details of geographic regions are very important to explaining variations in health
outcomes in public health research. We hypothesize that the physician location where the patient
visits may have different levels of certain disease burden accounted for in the MSA variable. For
example, it is possible for specific physician location have a larger prevalence of comorbidities,
obesity, access to adequate to healthcare, and food desert relative to other locations in the study.
When we accounted for all the variables in the model that were attributable to the variations and
significance via the MSA variable, the statistical significance disappeared in the logistic
regression model for both types of counseling. Diabetic patient’s that see physicians located in
more urban area potentially have a higher burden of disease and access to healthcare. As
previously stated, physicians may offer counseling to sicker patients because of the state of their
health due to outside factors that influence the disease.
Unlike many previous studies, the two main strengths of the study are the sample size
utilized for analysis and the quality of complete patient data for analysis. Although these factors
are essential for appropriate and unbiased analysis, there were many weaknesses in this study’s
analysis. Some variables were proxy for other variables for analysis due to the amount of
“missingness” could have hidden potential additive effects of characteristic variation. For
example, obesity was substituted for BMI due to 60% of the observation were missing.
33
into the physician's medical criteria to offer intervention. HbA1c levels were more than 10%
missing as well. It is possible exploring the variations among the different BMI [overweight vs.
obese], and HbA1c [pre-diabetes vs. diabetes] could provide more insight to providing an
effective treatment for people at risk of diabetes and people diagnosed diabetes.
More patient information should be collected to give a clearer picture to account for
socioeconomic characteristics [income, marital status, and zip code] for further explanation of
variance observed. Other physician and system characteristics that create the variation for
outcome variables of interest should take into account for future research. There has been
extensive research that physician’s race, sex, year of experience, and socioeconomic background
is associated with patient health outcomes and health disparities in the population. For example,
patients who identify themselves as black women and children tend to have poorer health
outcomes and mortality rate when it comes to childbirth.
In our analysis, we examined that the electronic patient records capabilities could
influence effective care being provided to patients at risk for poor health outcomes. For system
characteristics, patient-centered medical home status was not available for dataset before 2016
for analysis. Patient-centered medical home [PCMH] is a medical care delivery model that
focuses on coordination through primary care doctor to effectively give the patient the care they
need. This variable would have beneficial for further analysis to gain further insight into the
system levels relationship with lifestyle counseling.
Limitations
One major limitation in the analysis is the size of the survey sample to address the aims
of the study. After applying inclusion and exclusion criteria to the data observed, 3,463 survey
34
Type II diabetes, the exclusion of patient who were pregnant during patient visit affected the
sample weights in our analysis. Approximately 27.36% of observations of patient who were
pregnant, or pregnancy status were unknown where excluded from analysis. The sample weights
post exclusions are incorrect due to the observations that were included in the calculation of the
sample weight are no longer in the dataset. Despite the intent of resolving the issue of sample
size from past research studies with a representative data, there may be issues of generalizability
for the type II diabetic populations. This impairs the representativeness of the sample despite
utilizing the sample weights.
Sample weights were utilized to produce national estimates for patients and physician
from all four regions of the U.S.; however, for the number of predictors are analysis may need
more observation in the data for analysis. A survey sample size of 4,000 can’t provide
implications of the observations that weren’t analyzed. To extrapolate and apply results to the
overall population, a sufficient statistical power (i.e. adequate sample size) must be attained for
appropriate analysis for the population. The inferences and generalizability from this research
study can only be implied to the relevant study sample in analysis, not for all people in the
population. This could be resolved by extending the timepoint for data analysis for the survey
sample size issue.
Another limitation in the study analysis was the questions that were asked for the
NAMCS survey. This limitation is the major factor for the lack of statistical power and sample
size issue. The survey question utilized to identify patients that were pregnant wasn’t recorded
until 2012. Because the uncertainty of the pregnancy status, observation from 2012-2015 were
included for statistical analysis of lifestyle counseling. Finally, the last limitation would be the
35
detected to be a contributor to the burden of DMII and indicators to explain the variations in
likelihood of lifestyle counseling in previous studies had more than 10% of missing observations.
This resulted in variables such as BMI and A1c-levels to be proxy for other variables related to
the ones of interest. Further variation in the survey that was excluded from the analysis could
have explained the difference in likelihood of counseling for diabetic patients.
Future Directions
For future studies, more characteristics on all levels should be examined to develop a
thorough and complete framework of potential barriers of the interventions to be effective in
diabetic glycemic control. Once these barriers have been explored, figuring out how much of the
variations can significantly explain the difference of likelihood of diet and exercise counseling.
The patient and visit characteristics are nested within provider characteristics in the NAMCS
dataset so a hierarchal model [generalized mixed effect model] would address if provider and
system characteristics can explain the difference in the likelihood of diabetic patients offered
intensive lifestyle counseling. A hierarchal model with the appropriate statistical software is the
best approach when independence is violated due to the clustering in the dataset. If the
appropriate measures are taken to analyze specific contributing patient visit characteristics and
the ability to quantify how much variations account for the lack of translation in the delivery of
effective glycemic control, then health population and cost of healthcare can improve drastically
36
REFERENCES
Albright AL, & EW, G. (2013). Preventing type 2 diabetes in communities across the U.S.: the National Diabetes Prevention Program. Am J Prev Med, S346-51.
Ali MK, B. K. (2013). Achievement of goals in U.S. Diabetes Care, 1999-2010. N Engl J Med, 287-8. Alim, J. (2017). The Impact of Race and Diabetes on Mortality among Breast Cancer Patients. Thesis,
Georgia State University.
Balas, E. A. (1998). From appropriate care to evidence-based medicine. Pediatr Ann, 581-4. Brody, J. E. (2018, July 23). Nytimes. Retrieved from The New York Times:
https://www.nytimes.com/2018/07/23/well/pancreatic-cancer-risk.html?mabReward=CBMG1&recid=17mYvhlxWwj4Ms9TsaNN5TiODuw&recp=5&action= click&pgtype=Homepage®ion=CColumn&module=Recommendation&src=rechp&WT.nav= RecEngine
Dieleman, J. L., Baral, R., Birger, M., Bui, A. L., & al., e. (2016). US Spending on Personal Health Care and Public Health, 1996-2013. JAMA, 2627-46.
Knowler, W. C., Barrett-Connor, E., Fowler, S. E., & Hamman, R. F. (2002). Reduction in the incidence of type 2 diabetes with lifestyle intervention or metformin. N Engl J Med, 393-403.
Kreuter, M. W., Scharff, D. P., Brennan, L. K., & Lukwago, S. N. (1997). Physician recommendations for diet and physical activity: which patients get advised to change? Prev Med, 825-33.
Lin, S. C., Jha, A. K., & Adler-Milstein, J. (2018). Electronic Health Records Associated With Lower Hospital Mortality After Systems Have Time To Mature. Health Aff (Millwood), 1128-1135. Lindstrom, J., Louheranta, A., Mannelin, M., Rastas, M., & al., e. (2003). The Finnish Diabetes
Prevention Study (DPS): Lifestyle intervention and 3-year results on diet and physical activity.
DIabetes Care, 3230-6.
Ma, J., Urizar, G. G., & Stafford, R. (2004). Diet and physical activity counseling during ambulatory care visits in the United States. Preventive Medicine, 815-822.
Menke A, C. S. (2015). Prevalence of and Trends in Diabetes Among Adults in the United States, 1988-2012. JAMA, 1021-9.
Morrison, F., Shubina, M., & Turchin, A. (2012). Lifestyle counseling in routine care and long-term glucose, blood pressure, and cholesterol control in patients with diabetes. Diabetes Care, 334-41. Pi-Sunyer, X. (2014). The Look AHEAD Trial: A Review and Discussion Of Its Outcomes. Curr Nutr
Rep, 387-391.
Prevention, C. f. (2017). National Diabetes Statistics Report. Atlanta,GA: Centers for Disease Control and Prevention, US Department of Health and Human Services.
Selvin, E., Parrinello, C. M., Sacks, D. B., & Coresh, J. (2014). Trends in prevalence and control of diabetes in the United States, 1988-1994 and 1999-2010. Ann Intern Med, 517-25.
Sincliar, J., Lawson, B., & Burge, F. (2008). Which patients receive advice on diet and exercise? Can Fam Physician, 400-412.
Stafford, R. S., Blumenthal, D., & Pasternak, R. C. (1997). Variations in cholesterol management practices of U.S. physicians. J Am Coll Cardiol, 139-46.
37
Figure 3.1 List of Patient Visit Characteristics in Analysis
Patient Variables Physician Variables System Variables
Patient Race/Ethnicity Geographic region Type of Practice
Medical Insurance Metropolitan Status Area Owner of Medical Practice
Patient Age Physician Specialty E-Share with other providers
Patient Sex Health Provider Type Reminders of interventions/test
Visit Type Ownership Status of Physician E-share with different EMRs
Tobacco Use Physician Compensation EMR meet criteria of DHHS
Total No. Chronic Conditions MD vs DO
List of chronic conditions HbA1c testing offered to patient
38
TABLE 4.1
Patient Visit Non-Clinical Characteristics Offered Lifestyle Counseling [Diet/Exercise]
Diet/Nutrition Counseling Exercise Counseling Variable Total Freq. Frequency [weighted %] p-value Frequency [weighted %] p-value
Race/Ethnicity 0.0942 0.1541
Non-Hispanic White Non-Hispanic Black Hispanic
Non-Hispanic Other
2517 427 [13.3281] 311 [9.5767]
426 84 [4.4136] 64 [2.9158]
330 79 [6.0416] 55 [4.7104]
190 19 [1.0110] 14 [0.9154]
Medical Insurance 0.4550 0.9313
Non-private
Private 1554 1909 265 [9.9834] 344 [14.8210] 180 [7.8612] 264 [10.2571]
Age 0.4581 0.4972
18-34 35-49 50-69 70+
69 13 [0.3529] 8 [0.2304]
436 92 [3.8070] 68 [3.0215]
1960 366 [14.6715] 266 [10.2613]
998 138 [5.9729] 102 [4.6051]
Sex **0.0212 0.0845
Male
Female 2427 1036 402 [15.4319] 207 [9.3725] 293 [11.3344] 151 [6.7839]
Geographic Region 0.5053 0.8474
Northeast Midwest South West
439 92 [5.5661] 57 [3.0279]
1046 173 [3.6263] 123 [2.7680]
1056 210 [10.2019] 158 [7.5923]
922 134 [5.4101] 106 [4.7302]
Metropolitan Status Area **0.0147 **0.0374
MSA
Non-MSA 3062 401 556 [23.5889] 53 [1.2155] 410 [17.2255] 34 [0.8928]
Visit Type 0.7874 0.5104
New or GME
Return or Non-GME 2264 1199 416 [14.9711] 193 [9.8332] 290 [10.3433] 154 [7.7751]
Physician Specialty **0.0112 **0.0195
General/Family Practice Internal Medicine Cardiology
915 220 [11.0523] 160 [8.4163]
616 130 [6.3567] 94 [3.6326]
39
Neurology/Ophthalmology
Other 369 1277 27 [0.2138] 168 [5.0910] 11 [0.0858] 122 [4.1422]
Health provider type 0.2163 **0.0271
Physician
Mid-level provider Other
3415 603 [24.7418] 442 [18.1353]
19 2 [0.0864] 1 [0.0432]
19 3 [0.0351] 1 [0.0081]
Tobacco Use **0.0005 0.2837
No
Yes 3352 111 564 [23.0367] 45 [1.7677] 410 [17.1063] 34 [1.0121]
Total No. Chronic Condition 0.1466 0.4979
0-1
2 or more 294 3169 32 [1.5954] 577 [23.2090] 21 [1.4398] 423 [16.6786]
MD vs DO 0.6653 0.5662
MD
DO 3218 245 559 [23.0610] 50 [1.7434] 2173 [7.573] 151 [0.4542]
Ownership Status Physician 0.6639 0.8003
Full-owner Part-owner Employee Contractor
956 157 [8.8496] 117 [6.7291]
847 156 [7.3596] 101 [4.84]
1564 285 [8.3014] 223 [6.5298]
83 7 [0.0623] 2 [0.0250]
Type of Practice 0.3714 0.2767
Non-Solo
Solo 2517 945 442 [14.4804] 167 [10.3325] 324 [10.1219] 120 [8.0027]
Basic Compensation*** 0.1581 **0.0461
Fixed Salary
Share of Practice billing Shift, hourly or time based Mix of salary and share billings Other
1030 190 [8.0120] 153 [7.1065]
633 111 [4.6726] 74 [1.7180]
33 7 [0.2291] 5 [0.1173]
1394 245 [10.8351] 175 [8.4521]
200 24 [0.5706] 17 [0.4404]
Time Spent with MD **0.0161 0.6347
0-30 minutes 31-60 minutes ≥ 61 minutes
2986 513 [19.7909] 385 [15.1338]
436 88 [4.9085] 55 [2.9192]
41 8 [0.1050] 4 [0.0654]
Owner of Medical Practice *** 0.2613 0.1546
40
Medical/Academic Health Center
Insurance company/Health Corp. 550 2263 110 [2.3928] 79 [1.8654] 82 [1.7274] 51 [1.1500]
HbA1c testing offered to patient 0.0638 0.4618
No
Yes 2784 679 407 [16.0098] 202 [8.7946] 310 [12.5622] 134 [5.5561]
E-share w/ other providers 0.7697 0.8417
No
Yes 1386 2077 208 [11.3032] 401 [13.5012] 143 [8.8436] 301 [9.2747]
Reminders for intervention/test*** 0.5763 0.7116
No
Yes, used routinely Yes, not routinely Yes, not used
395 54 [1.4535] 32 [1.0967]
2584 461 [19.4025] 340 [13.5632]
283 49 [1.9446] 37 [1.3058]
98 26 [0.5980] 23 [0.7376]
E-share [different systems] *** 0.4926 0.1759
No
Yes 1562 1480 251 [14.2012] 290 [11.4955] 176 [11.3955] 214 [7.3536]
EMR meet DHHS criteria *** 0.5406 0.1765
No
Yes 144 3040 14 [3.0884] 563 [22.4450] 16 [3.0077] 410 [15.9524]
** p <0.005 is statistically significant
![TABLE 4.1 Patient Visit Non-Clinical Characteristics Offered Lifestyle Counseling [Diet/Exercise]](https://thumb-us.123doks.com/thumbv2/123dok_us/9054141.976955/39.792.74.718.99.538/table-patient-clinical-characteristics-offered-lifestyle-counseling-exercise.webp)
![TABLE 4.2 Patient Visit Clinical Characteristics Offered Lifestyle Counseling [Diet/Exercise]](https://thumb-us.123doks.com/thumbv2/123dok_us/9054141.976955/42.792.68.713.94.535/table-patient-clinical-characteristics-offered-lifestyle-counseling-exercise.webp)