Journal of Chemical and Pharmaceutical Research, 2016, 8(12):38-44
Research Article
CODEN(USA) : JCPRC5
ISSN : 0975-7384
38
RP-HPLC Method Development and Validation for Determination of
Rivaroxaban in the Pure and Pharmacuetical Dosage Form
R Meenakshi
*and R Nageswara Rao
Department of Pharmaceutical Analysis and Quality Assurance, Creative Educational Society’s College of Pharmacy, JNTUA, Kurnool, Andhra Pradesh, India
_______________________________________________________________________________________
ABSTRACT
A simple, rapid, accurate, precise, robust and reproducible reverse phase high performance liquid chromatographic method was developed for the determination of Rivaroxaban in pure drug and pharmaceutical dosage form. The quantification was carried out using enable C18(250×4.6mm,5µm) column in a binary mode with mobile phase
comprising 0.1%glacial acetic acid: acetonitrile in 30:70 %v/v at flow rate 1ml/min, detection was carried out at 250nm using PDA detector with injection volume 20µl, the retention time was found to be 3.44min. The proposed method was validated as per ICH Q2B guidelines. The method produced linear response in the concentration range of 2-10µg/ml (R2 ˜0.9993). The recovery studies were carried out and found to be within 98-102%. %RSD was found to be 2%. LOD and LOQ of Rivaroxaban for the method were found to be 0.008µg/ml and 0.248µg/ml respectively. The proposed method was statistically evaluated and can be applied for the routine analysis, quality control of raw materials, formulation of different strengths, dissolution studies and bioequivalence studies for the same formulation of Rivaroxaban.
Keywords: Rivaroxaban; Acetonitrile; RP-HPLC; Validation; ICH guidelines
_______________________________________________________________________________________
INTRODUCTION
Rivaraxoban is 5-chloro n-{[(5S)-2-oxo-3-[4-(3-xomorpholin-4-yl) phenyl]-1, 3-oxozolidin-5-yl] methyl} thiophene-2-corboxamide, [1]. It belongs to the class of direct factor Xa inhibitor approved for the prevention of venous thromboembolic events in patients who have undergone total hip or total knee replacement surgery. RXN blocks the amplification of the intrinsic and extrinsic pathway of coagulation cascade by binding directly to the catalytic pocket of factor Xa and thereby preventing the formation of thrombus [2]. It has a molecular formula of C19
H18 CIN3 O5 S and a molecular weight 435.881 g/mol. Its structure is given in figure No.1. Literature survey revealed
that studies had been carried out on Rivaroxaban on RP-HPLC, LCMS/MS, HPTLC [3-13]. The focus of present study was to develop and validate a rapid, stable and economic RP-HPLC method for the estimation of Rivaroxaban in bulk and its formulation. In the present study, a new factor RP-HPLC method was developed which shown high reproducibility and sensitivity. The developed method was validated as per ICH guidelines [14].
EXPERIMENTAL SECTION
Materials used Chemicals:
39
Instrument:
HPLC (schimadzu) with PDA detector was used. LC Solutions software was used.
Methodology
Preparation of 0.1% glacial acetic acid:
In a 100ml of volumetric flask 0.1ml of Glacial acetic acid (GAA) solution is taken and to this 100ml of milli-Q water was added and then final volume was made up to 100 ml with milli-Q water.
Preparation of Mobile Phase:
An accurately measured 0.1% GAA and Acetonitrile in ratio of 70:30 % v/v were filtered through 0.45µ filter. Acetonitrile was used as a diluent.
Preparation of Standard Solution:
10mg of Rivaroxaban was weighed and placed into a 10 ml of volumetric flask, to this add 5 ml of diluent for 30 minutes, it is sonicated and make up the solution to 10 ml with diluents. From the above stock solution, 1 ml is taken in to a 10ml volumetric flask and make up the solution to final volume with diluent. 1ml is taken in to a 10ml volumetric flask and make up the solution to final volume with diluent.
Preparation of Solution for Selection of Wavelength:
Standard solution of Rivaroxaban was prepared and scanned in the range of 200 nm to 400 nm using a photodiode array detector. The spectrum was recorded.
Analysis of Formulation:
10 tablets were weighed. The Average weight of each tablet was caluculated. Now transfer in to 10ml flask i.e., weight equivalent to 10mg is transferred to flask. To this add 5ml of diluent for 30 min it is sonicated, then final volume was made up with diluent. Then the above solutions was filtered and take 1ml of the filtered solution in to 10ml 0f flask and make up volume with 10ml of diluent.
RESULTS AND DISCUSSION
Validation of developed method
Method validation as per International Conference of Harmonization is defined as “establishing documented evidence, which provides a high degree of assurance that a specific activity will consistently produce a desired result or product meeting its predetermined specifications and quality characteristics”.
System Suitability Testing
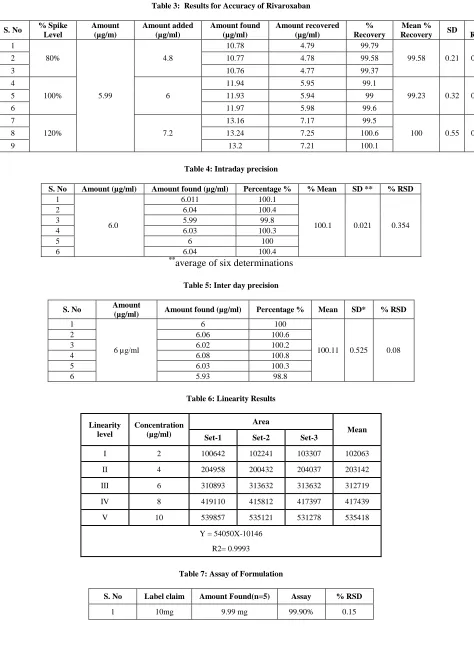
The chromatographic conditions for the estimation of Rivaraxoban were discussed in Table 1. Rivaroxaban standard drug solution was injected into HPLC system for six times, and checked for the system suitability parameters like theoretical plates, tailing factor and % RSD of areas for six injections of standard Rivaroxaban drug solution was calculated. The results were shown in the Table 2.
Accuracy
The accuracy of the method was determined by standard addition method. Known amount of standard drug was added to pre analyzed sample of Rivaroxaban in according to 80%, 100% and 120% levels of labelled claim and then subjected to the proposed method. The percentage recovery was calculated and results are presented in Table 3. Satisfactory recoveries ranging from 98% to 102% were obtained by the proposed method. This indicates that the proposed method was accurate.
Precision
Precision of the method was studied by carrying out intraday, inter day analysis and expressed as percentage Relative Standard Deviation. For this purpose 6μg/ml solution was prepared and their peak area of the solutions were measured for six times within the same day and in different days at 250nm results are presented in Table 4 & 5.
Linearity
40
Limit of Detection (LOD) and Limit of Quantization (LOQ)
LOD and LOQ of the drug were calculated using the following equations according to International Conference on Harmonization (ICH) guidelines
LOD = 3.3 × σ/S LOQ = 10 × σ/S
Where σ = the standard deviation of the response and S = the slope of the regression equation.
Robustness
Deliberate variations were made to the optimized HPLC conditions, to evaluate robustness, variations made were, flow rate varied by ±2ml/min, Column oven temperature by ±5oC, wave length varied by ±2nm, mobile phase ratio ±10ml .The results were presented in Table 8.
[image:3.612.118.510.217.645.2]Figure 1: Structure of Rivaroxaban
Figure 2: Linearity Curve of Rivaroxaban
41
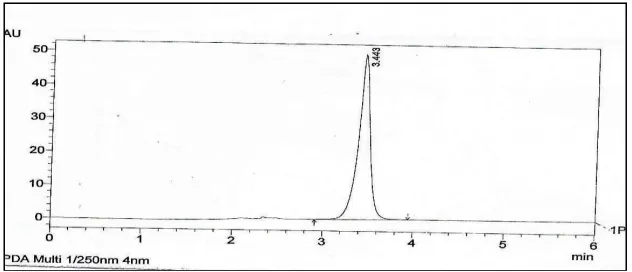
Figure 4: Chromatogram of Rivaroxaban Standard Preparation
[image:4.612.147.480.62.192.2]Figure 5: Chromatogram of Rivaroxaban Sample Preparation
Table 1: Optimized chromatographic conditions
S. No Chromatographic Parameters Chromatographic Conditions
1 Mode of separation Binary elution 2 Mobile phase Acetonitrile : 0.1% GAA (70:30) 3 Column Enable c18-G (4.6×250mm, 5µm)
4 Flow rate 1.0mL/min
5 Detection Wavelength 250nm
6 Injection Volume 20µl
7 Column oven temperature Ambient (300c)
8 Run time 6min
Table 2: System Suitability Testing Parameters Results
S. No System suitability Parameters Results Acceptance Criteria
1 Tailing factor 0.905 NMT 2.0%
2 Theoretical plates 4652 NLT 2000
[image:4.612.149.465.223.359.2]42
Table 3: Results for Accuracy of Rivaroxaban
S. No % Spike Level Amount (µg/m) Amount added (µg/ml) Amount found (µg/ml) Amount recovered (µg/ml) % Recovery Mean % Recovery SD
% RSD 1 80% 5.99 4.8
10.78 4.79 99.79
99.58 0.21 0.21
2 10.77 4.78 99.58
3 10.76 4.77 99.37
4
100% 6
11.94 5.95 99.1
99.23 0.32 0.32
5 11.93 5.94 99
6 11.97 5.98 99.6
7
120% 7.2
13.16 7.17 99.5
100 0.55 0.55
8 13.24 7.25 100.6
9 13.2 7.21 100.1
Table 4: Intraday precision
S. No Amount (µg/ml) Amount found (µg/ml) Percentage % % Mean SD ** % RSD
1
6.0
6.011 100.1
100.1 0.021 0.354
2 6.04 100.4
3 5.99 99.8
4 6.03 100.3
5 6 100
6 6.04 100.4
**average of six determinations
Table 5: Inter day precision
S. No Amount
(µg/ml) Amount found (µg/ml) Percentage % Mean SD* % RSD
1
6 µg/ml
6 100
100.11 0.525 0.08
2 6.06 100.6
3 6.02 100.2
4 6.08 100.8
5 6.03 100.3
6 5.93 98.8
Table 6: Linearity Results
Linearity level Concentration (µg/ml) Area Mean Set-1 Set-2 Set-3
I 2 100642 102241 103307 102063
II 4 204958 200432 204037 203142
III 6 310893 313632 313632 312719
IV 8 419110 415812 417397 417439
V 10 539857 535121 531278 535418
Y = 54050X-10146 R2= 0.9993
Table 7: Assay of Formulation
S. No Label claim Amount Found(n=5) Assay % RSD
43
Table 8: Robustness Results
Parameter Normal Variation Rt Tailing factor Theoretical plates % RSD
Wave length variation 250 248 3.439 0.891 4563 0.122
252 3.45 0.922 4732 0.173
Flow Rate variation 1 0.8 4.336 0.894 4971 0.389
1.2 2.9 0.896 4213 0.139
Column oven Temperature
variation 30˚c
25˚c 3.472 0.904 4734 0.04
35˚c 3.441 0.898 4527 0.183
Mobile phase variation 70:30:00 60:40:00 3.91 0.989 4313 0.134
80:20:00 3.401 0.997 4282 0.164
ACKNOWLEDGEMENT
The authors are sincerely thankful to the management of C.E.S College of Pharmacy, Chinnatekur, Kurnool, Andhra Pradesh, India for providing the facilities to carry out this research work.
REFERENCES
[1] S Roehrig; A Straub; J Pohlmann; T Lampe; J Pernerstorfer; KH Schlemmer; P Reinemer; E Perzborn. J Med
Chem, 2005, 48(19), 5900-5908.
[2] V Shiva Shankar; M Gandhimathi; TK Ravi. IJPAR, 2015, 4(4), 406-410. [3] M Arun; Prajapathi Harsha; A Patel. Int J Pharm, 2015, 5(2), 610-613. [4] PSP Rao; VK Cholleti; VR Reddy. Int J Res Pharm Sci,2015, 5(2), 17-24.
[5] Hetal Jebaliya; Batuk Dabhi; Madhavi Patel; Yashwantsinh Jadeja; Anamik Shah. J Chemical Pharmaceutic Res,2015, 7(10), 65-74.
[6] Manjunatha Devagondanahalli Hadagali. Int J Adv in Pharmac Ana, 2015, 5(3), 65-68. [7] N Rajan; K Aner Basha. J phar res, 2014, 8(11), 1719-1725.
[8] Burla sunitha venkata seshamamba; Peruri veera venkata Satyanarayana; Chandra bala Sekaran. Chem Sci Trans, 2014, 3(4),1546-1554.
[9] Mustafa Çelebier; Tuba Reçber; Engin Koçak; Sacide Altınöz. Braz J Pharm Sci,2013, 49(2). [10] Pinaz A Kasad. Int J PharmTech Res, 2013, 5(3), 1254-1263.
[11] IB Lories; AA Mostafa; Girges. J Chromatogr Sep Tech, 2013, 4(8). [12] PVV Satyanarayana; Alavala Siva Madhavi. IJSID,2012, 2(1), 226-231.
[13] K Chandra sekhar; P Satya vani; A Dhana Lakshmi; Ch LL Devi; Anupama Barik; Narendra Devanaboyina. Research Desk, 2012, 1(1), 24-33