International Journal of Emerging Technology and Advanced Engineering
Website: www.ijetae.com (ISSN 2250-2459, Volume 2, Issue 6, June 2012)
127
Energy Efficiency in Data Centers and IT Industry
Obtaining Efficient performance by Optimum loading and
Harmonics mitigation
Mr. Narendra Zinjad
1, Mrs. S.S. More
2 1Research Scholar, BVDU, Katraj, Pune 2Prof. and Head Dept, of Electrical Engg. BVDU, Katraj, Pune
Abstract - As the trend shifts from paper-based to digital information management, IT & Datacenter have become common and essential to the functioning of business systems. Datacenter is a facility that has various equipment such as servers, data storage devices, network devices etc. Collectively, this equipment processes, stores, and transmits digital information and is known as Information Technology (IT) equipment. The UPS, acting as both a load and a source, transforms this poor quality power to high-quality power, which can then be safely applied to critical loads. Commercial Power containing spikes, sags, and outages would cause data loss and severe damage to IT infrastructure in a Datacenter. An Uninterruptible Power Supply (UPS) is used to protect IT & Datacenter from an unexpected power disruption which would cause data loss resulting in disastrous consequences for the company.
Keywords: Spikes, Loading, SMPS, Voltage fluctuation, Nth harmonics.
I. INTRODUCTION
The Uninterruptible Power Supply is the heart of any critical power infrastructure. The UPS provides the primary protection from harmful power disturbances as well as gives a linkage to stored energy source or alternative power sources during times of outage. Figure:8shows the basic function of a UPS. The UPS, acting as both a load and a source, transforms this poor quality power to high-quality power, which can then be safely applied to critical loads. Commercial Power containing spikes, sags, and outages would cause data loss and severe damage to IT infrastructure in a Datacenter. An Uninterruptible Power Supply (UPS) is used to protect IT & Datacenter from an unexpected power disruption which would cause data loss resulting in disastrous consequences for the company The UPS is one of the most critical pieces of equipment in a Datacenter. Typically, online UPS systems are used in IT & Datacenter. These systems are ideal for environments where electrical isolation is necessary or the equipment in use is highly sensitive to power fluctuations. Traditionally, the selection of UPS systems has focused on system reliability without giving much thought to the system efficiency.
However, with the increase in energy costs and as a consequence of the energy shortage situation, the efficiency of the UPS system has now become a major consideration, while reliability still remains as the topmost criteria. In order to have redundancy level in a Datacenter, the number of UPS systems. is increased. This eventually leads to decrease in the loading of UPS systems.
II. UPSINSTALLATION AND BRIEF PREVIEW
The detailed view of these two Datacenters as shown in Figure 9, the design efficiency ofDatacenter “A” is higher than that of Datacenter “B”. However, the operating efficiency of
Datacenter “A” is lower than that of Datacenter “B” if Datacenter “A” faces only 14% loading andDatacenter “B” faces 58% loading. The Low operating efficiency is due to a low percentage loadon the IT equipment and therefore on the overall infrastructure.
Low operating efficiency is due to the following reasons
Varying load requirements with respect to time
Over-sizing of equipment by design
Installation of multiple equipment to facilitate higher redundancy level
Various techniques are available to optimize the loading of the UPS system and to optimally share the load on all the UPS systems. Modularity is one such method to improve the efficiency of the UPS system. Modularity allows users to size the UPS system as closely with the load as practical (in other words, it allows the UPS to operate as far right on the curve as possible). UPS technologies continue to evolve towards greater electrical efficiency and the newer technologies available will yield greater benefits.
III. CASE STUDY
Company Name: - Persistent System Ltd, Pune, India
International Journal of Emerging Technology and Advanced Engineering
Website: www.ijetae.com (ISSN 2250-2459, Volume 2, Issue 6, June 2012)
128
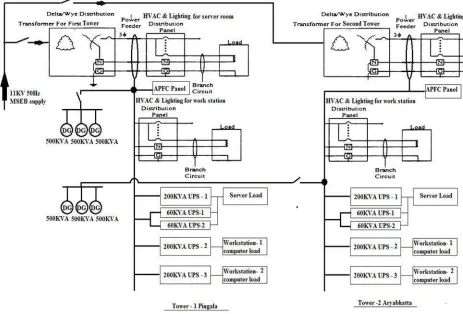
The company is connected to MSEB supply system (Utility mains) under HT-1 Non- continuous Industries tariff category, having two separate transformer feeders for the Tower -1(named as Pingala) and tower – 2 (named as Aryabhatta) respectively. Both the towers are having identical load distribution and UPS systems, Diesel Generator (DG) supply. Each tower is having six floor structures. Each floor is having one server room and work stations/ work hall.
The harmonic study is carried out for both the tower-1& 2 with help of power analyser by connecting it to six different points of the distribution system of each tower. The measurement were taken for peak load and off peak load.The measurement points at power feeders are
1. 11KV/.433KV, 3ph- 4Wire system Transformer
secondary
2. HVAC & lighting feeder for server rooms
[image:2.612.76.539.270.584.2]3. HVAC & lighting feeder forWorkstation/Work hall
Fig 1: Layout of Persistent System
4. Output of 200KVA UPS-1 for server rooms – rack power
5. Output of 200KVA UPS-2 for Workstation/Work hall – computer load
6. Output of 200KVA UPS-3
International Journal of Emerging Technology and Advanced Engineering
Website: www.ijetae.com (ISSN 2250-2459, Volume 2, Issue 6, June 2012)
129
200KVA Uninterrupted Power Supply – 3 in Numbers for Tower -1
1. Power Rating @0.9PF :-200KVA/180KW
2. Maximum Input Current@415V :-377.15A
3. Nominal output current :-275.5A
4.Battery Input Current([email protected]/cell) :-454.4A
5.Neutral Conductor dimension for non-linear load :- 1.6 times the phase conductor size, i.e
140X1.6 mm2 = 224mm2
6. Input iTHD :- ≤7%
7.Output voltage :- 480/277
8.Frequency :- 50Hz
9.Voltage THD :- <3% for linear load
10.Inverter Technology :- IGBT with vector control-DSP technology for real
[image:3.612.66.545.148.366.2]time response to overload power disturbance
Table 1: Figures and parameter of 200kVA UPS system
All three UPS are connected in parallel for redundancy, and to maintain reliability of supply for critical load such as server room.
Connected load of server room is 90KW & connected load for workstation is 211KW.
The server room is where the information is stored and it the critical load any loss of power would be too costly for the organization. Hence this 200VA UPS server is connected in parallel with two more 60KVA UPS. However, 60KVA UPS’s are remains in circuit but does not share load unless the main UPS fails. So, from reliability of supply redundancy is maintained.The output power of UPS supplied to the serve remains same for Peak
load. Reading were taken on working Day
i.e.18/4/2012,Wednesday,1:25:00 PM for 1 Hour.
The project findings:
200KVA UPS for Server
The server room is where the information is stored and it the critical load any loss of power would be too costly for the organization. Hence this 200VA UPS server is connected in parallel with two more 60KVA UPS. However, 60KVA UPS’s are remains in circuit but does not share load unless the main UPS fails. So, fromreliability of supply redundancy is maintained.The output power of UPS supplied to the serve remains same for Peak and Off Peak load.
Reading were taken on 18/4/2012.
The per phase active power is slightly less than the apparent power, R phase loading is around 60% and the other two phases are 40 to 50% loaded. To improve the efficiency of the system the loading of the UPS should be increase.
As shown in above figures the True Pf is less than the displacement PF, indicating the presence of harmonic in all the phases. That is the reason why active power is slightly less than the apparent power.
Voltage per phase is within limit. But, very high amount of neutral current seen to be flowing , which is almost same as the B-phase current and it is because of the presence of harmonic in the system % VTHD is maximu 2% and considered to be less . Current harmonic is higher as the load connected is sinle phase. Also is observed that the Y phase is having less %ITHD due to more loading on it. Whereas other phases which are under loaded are observed to be having higher % of ITHD. So, as the load increases %ITHD seen to be decreasing.
International Journal of Emerging Technology and Advanced Engineering
Website: www.ijetae.com (ISSN 2250-2459, Volume 2, Issue 6, June 2012)
130
Data
Server UPS - PEAK LOAD18/04/2012 1:25:00 PM
Server UPS -OFF PEAK LOAD 21/04/2012
R -
Phase
Y -
Phase
B -
Phase
R
Phase
Y
Phase
B
Phase
Neutral
VrmsAvg[Volts]
228.91
229.23
230.25
228.92
229.37
230.29
IrmsAvg[Amps]
141.68
177.05
122.01
142.87
174.16
119.78
74.66
P(kW)Avg[kW]
30.633
38.34
26.03
30.725
37.59
25.406
PFnd(kW)Avg[kW]
30.692
38.42
26.051
30.769
37.66
25.409
S(kVA)Avg[kVA]
32.42
40.59
28.112
32.71
39.97
27.566
PFAvg[pu]
0.9449
0.9446
0.9259
0.9394
0.9405
VTHDRssAvg[Volts]
3.847
4.584
4.472
3.829
3.512
4.1
ITHDRssAvg[Amps]
40.71
32.72
37.61
40.8
33.86
37.57
68.39
% ITHD
28.73
18.48
30.82
28.55
19.44
31.36
91.60
ICFAvg[]
1.8829
1.6518
1.9608
1.9359
1.7219
2.0168
AKFactAvg[]
1.913
1.4588
2.1995
2.0256
1.5464
2.4105
DPFAvg[pu]
0.9885
0.9635
0.9745
0.982
0.9607
0.971
TOTP(kW)Avg[kW]
95.01
93.71
TOTPFnd(kW)Avg[kW]
95.17
93.83
TOTPFAvg[pu]
0.9385
0.9338
TOTSaritFnd(kVA)Avg[kVA] 101.13
96.7
Table 2: Various parameter of the study day
Fig2: I crest factor and K – factor
1.4 1.5 1.6 1.7 1.8 1.9 2 1 :2 5 :0 0 P M 1 :3 0 :0 0 P M 1 :3 5 :0 0 P M 1 :4 0 :0 0 P M 1 :4 5 :0 0 P M 1 :5 0 :0 0 P M 1 :5 5 :0 0 P M 2 :0 0 :0 0 P M 2 :0 5 :0 0 P M 2 :1 0 :0 0 P M 2 :1 5 :0 0 P M 2 :2 0 :0 0 P M
I - Crest factor
RICFAvg YICFAvg BICFAvg
0 0.5 1 1.5 2 2.5 1 :2 5 :0 0 P M 1 :3 0 :0 0 P M 1 :3 5 :0 0 P M 1 :4 0 :0 0 P M 1 :4 5 :0 0 P M 1 :5 0 :0 0 P M 1 :5 5 :0 0 P M 2 :0 0 :0 0 P M 2 :0 5 :0 0 P M 2 :1 0 :0 0 P M 2 :1 5 :0 0 P M 2 :2 0 :0 0 P M
K- Factor
International Journal of Emerging Technology and Advanced Engineering
Website: www.ijetae.com (ISSN 2250-2459, Volume 2, Issue 6, June 2012)
131
Workstation 2 has the same load pattern as that of work station 1, considering the loading and % VTHD & %ITHD only summary of UPS reading has been mentioned below
and not the detailed analysis as it has been already discussed for workstation-1 UPS.
WORK HALL 2 - PEAK LOAD 18/04/2012 Wed 5:00 PM
OFF PEAK 21/04/2012 Sat 3:00
PM
Data
R -
Phase
Y -
Phase
B -
Phase
Neutr
al
R
Phase
Y
Phase
B
Phase
Neutr
al
VrmsAvg[Volts]
231.38
230.71
231.02
0.630
231.27
230.56
230.93 0.4981
IrmsAvg[Amps]
98.16
100.38
116.98
129.3
46.95
51.99
69.49
64.01
P(kW)Avg[kW]
18.549
18.028
22.819
8.638
9.884
13.93
PFnd(kW)Avg[kW]
18.675
18.176
22.969
8.666
9.908
13.96
S(kVA)Avg[kVA]
22.7
23.167
27.04
10.85
11.99
16.05
PFAvg[pu]
0.8171
0.7782
0.8439
0.795
0.824
0.868
VTHDRssAvg[Volts]
4.939
4.995
4.833
3.139
3.996
3.682
0.444
ITHDRssAvg[Amps]
55.74
62.14
61.7
128.9
26.469
27.985
33.26
63.35
% ITHD
56.78
61.90
52.744
99.72
56.37
53.82
47.86
98.96
ICFAvg[]
2.2947
2.4107
2.2733
2.502
2.456
2.251
AKFactAvg[]
5.104
5.662
4.397
7.918
7.813
4.816
DPFAvg[pu]
1
0.9992
0.9999
0.965
0.979
0.991
TOTP(kW)Avg[kW]
59.4
32.46
TOTPFnd(kW)Avg[kW]
59.82
32.54
TOTPFAvg[pu]
0.8131
0.829
TOTSaritFnd(kVA)Avg[
kVA]
59.84
33.18
Table 3: System parameter on study day
IV. RESULT AND RECOMMENDATIONS
Harmonic Mitigation concept
Harmonic Filter
Harmonic filter comprises of a reactor (L) in series with a capacitor (C)
Such a filter has a unique self series resonance frequency fR at which inductive reactance of
reactor equals capacitive reactance of capacitor. Fr= 1/(2LC)
Below fRthe filter is capacitiveAbove fRthe filter
is inductive
So for 5th harmonic and onwards the series circuit becomes inductive and starts offering higher impedance to higher frequency components.Similarly for 14% reactor: At fundamental frequency XC= 100 ohms
XL= 14 ohms.
For 3rd harmonic XC= 33.33 ohms
XL= 42 ohms.
For 5th harmonic XC= 20 ohms
XL= 70 ohms.
For 7th harmonic XC= 14.28 ohms
XL= 98 ohms.
International Journal of Emerging Technology and Advanced Engineering
Website: www.ijetae.com (ISSN 2250-2459, Volume 2, Issue 6, June 2012)
132
Optimum Loading mitigation:
The UPS is rated at 200kVA. The rated current for the UPS at maximum load is around 290 amperes. As per the studies details the UPS are only being loaded to a maximum of 150 Ampere. Thus the UPS is not optimumly loaded and this provide a scope for making data center a efficient one as explained in the preview section of the paper.
REFERENCES
[1 ] Richard M. Duke and Simon D. Round “Thesteady-state performance of a controlled currentactive filter,” IEEE Trans. Power Electronics,Vol. 8, No. 3, April 1993, pp 140.
[2 ] V.B. Bhavaraju and Prasad N. Enjeti, “Analysisand design of an active power filter forbalancing unbalanced loads,” IEEE Trans.Power Electronics, Vol. 8, No. 4 October 1993,pp 640. [3 ] Fitzgerald, A.E. et al, Electric Machinery, McGraw-Hill Company,
1971.
[4 ] IEEE 519 Recommended Practices and Requirements for Harmonic Control in Electric Power Systems
[5 ] Kerchner, Russel M. And George F. Corcoran, Alternating-Current Circuits, John Wiley & Sons, NY, 1 943.
[6 ] Powerline Harmonic Problems - Causes and Cures, Dranetz Technologies, December 1994.
[7 ] Energy Efficiency Guidelines and Best Practices in Indian