View the article online for updates and enhancements.
Visualization on Colour Based Flow Vector of Thermal Image
for Movement Detection during Interactive Session
Nabilah Ibrahim1, Mohamad Nurazmi Raman, Lina Farhana Mahadi, Wan Nurshazwani Wan Zakaria
Faculty of Electrical and Electronic Engineering,
Universiti Tun Hussein Onn Malaysia, Batu Pahat, Johor MALAYSIA
E-mail: [email protected]
Abstract. Recently thermal imaging is exploited in applications such as motion and face detection. It has drawn attention many researchers to build such technology to improve lifestyle. This work proposed a technique to detect and identify a motion in sequence images for the application in security monitoring system or outdoor surveillance. Conventional system might cause false information with the present of shadow. Thus, methods employed in this work are Canny edge detector method, Lucas Kanade and Horn Shunck algorithms, to overcome the major problem when using thresholding method, which is only intensity or pixel magnitude is considered instead of relationships between the pixels. The results obtained could be observed in flow vector parameter and the segmentation colour based image for the time frame from 1 to 10 seconds. The visualization of both the parameters clarified the movement and changes of pixel intensity between two frames by the supportive colour segmentation, either in smooth or rough motion. Thus, this technique may contribute to others application such as biometrics, military system, and surveillance machine.
1.Introduction
Recent advances in thermal image digital storage and video hardware has led to new applications such as surveillance, driver license application systems, biometrics, and virtual reality. These applications have attract the attention of researchers in motion detection system to be applied in current lifestyle [1]. In applications such as outdoor surveillance, where the background temperature is largely different from humans, thermal imaging can be employed in identifying and tracking people. One of the advantage of thermal imaging the ability to unrecognized shadow or light illumination, which is usually hold up on most systems based on motion detection system. Furthermore, contour of the heat signatures is the main concern in motion tracking because the contour have the physical properties that been used as subject to track down all the movement. The shadow region can cause false information and by avoiding this region it helps to improve the sensitivity of the motion detection. Using this information, thermal images are capable to detect the motion of the targeted person.
In addition to detect motion in thermal image, some may suggest the thresholding method to distinguish the motion subject and the stationary subject. However, the major problem when using thresholding method is that only the intensity is considered instead of relationships between the pixels. Extraneous pixels could easily be included that are not part of the desired region which lead to missing
2
effective edge detector reduces a large amount of data but still keeps most of the important feature of the image [4]. By using Lucas Kanade algorithm, motion detection based on pixel can be used by using the edges created in edge detection process. Pixel in the region of the contour is monitored in every frame to find any movement. Every pixel that move out of the region or going inside of the region in every angle in the picture can be identified as movement.
2.Data Acquisition
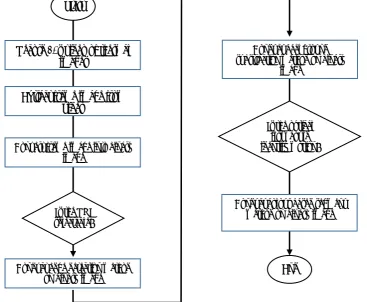
Figure 1 shows the procedure to identify motion in thermal image. Firstly, video of thermal image in AVI format as an input was recorded for 30 seconds during the interactive session among student in a room by using FLUKE VT04 Visual IR Thermometer camera. Figures 2 (a) and (b) show the frame extracted from recorded video and the frame of thermal image, respectively. In this part, a lot of interaction occur between subject and student may contribute to the thermal heat signature. During the recording time, student A who act as subject was move around and interact with other student to create a motion in thermal image. When interaction between the subject and object is surrounding, background and foreground are mixed together. This contour is used as the maximum edge to differentiate one object from another. Besides that, the contour used in Canny edge detection method is to identify the important feature of the image and motion when images in sequence is combine into one frame.
[image:3.595.130.498.420.722.2]
Figure. 1 Steps of motion identification in thermal image Start
Is the ROI selectable?
End Is the optical
flow could identify motion? Record 30s video of thermal
images
Extract frame image from video
Convert frame image into binary image
Conduct edge detection method on binary image
Conduct background substraction method on binary
image
[image:4.595.124.473.114.278.2]
(a) (b)
Figure. 2 a) Output of video after extracted into frames and b) Frame in thermal image
3.Data Analysis
3.1 Canny Edge Detector
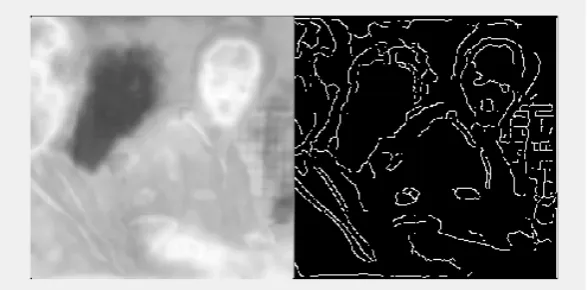
To identify the edges, the threshold plays a huge role where the intensity of the pixel above the minimum threshold are kept as edges and the rest are be removed to avoid false information. Discontinuity of edges are cropped and removed and all smooth and sparse images might have enough intensity that met threshold requirement are kept. Canny edge detector used to smooth the edges while derivative function used to calculate the maxima and minima [5]. It applied the second derivative zero crossing point to consider the strong and weak edges. Two thresholds are used to detect strong edges and weak edges [3]. The intensity image contains an edge only when the edge exists precisely in the colour image. Figures 3(left) and (right) show the grayscale image obtained from the converted thermal image and the applied Canny edge detector image on the grayscale image, respectively. Canny operator is able to detect all borders in the image (right), while the grayscale image (left) is not able to detect any edges.
Figure. 3 Grayscale image and applied canny edge detector image
To obtain smooth edges, each point of pixel is convolve with:
Gx = [−10−10] , Gy =[11−1−1] (1)
Gx = vertical edge response
[image:4.595.151.445.481.626.2]4 M[i,j]= magnitude of the gradient
θ[i,j]= direction of the gradient
3.2 Optical Flow Method
This method called Lucas-Kanade method, identifies the presence of moving object by considering the difference between two consecutive frames and velocity of each movement [6]. By subtracting second image from the first image frame, operator in consecutive frame obtains the desired output. This method is efficient in detecting the intensity of gray level changes between images. As part to achieve the aim of this work, the optical flow is essential to estimate the intensity of object movement. This method was applied on the greyscale image shown in Figure 3 (left). This method divided into 3 parts:
i. Reference or background image. Reference image can be selected as a frame which is
temporally adjacent image from a dynamic sequence. ii. Arithmetic subtraction operation algorithm.
iii. Selection of suitable threshold.
Based on the obtained flow vector, Hornn Schunck algorithm translates the vector into colour based for each flow depending on changes in the value of the block [6]. The Hornn Schunck technique is to estimate the optical movement that presents the constraint of smoothness in resolving the aperture problem. The algorithm segmented the images into colour based on optical flow vector data which each colour represents different vector and magnitude. However, this calculation depends on a differential method figured by utilizing a gradient constraint with a whole picture smoothness to acquire an expected velocity field. The brightness of every pixel is effect along its movement direction in the picture sequences.
4.Results and Discussions
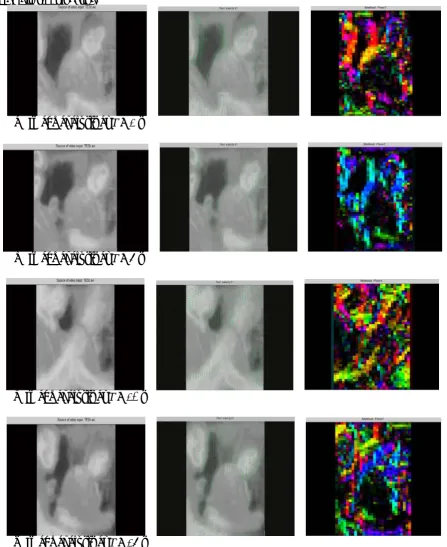
This section shows and discusses the results obtained as represented in figure 5. Figure 5 is the result of flow vector and segmented colour images analysed during the time frame of 1, 5, 10, and 15 seconds. Flow vector images (middle) indicate every movement changes in the image which calculated between the pixels of two time frames. It clearly can be observed that the high magnitude of vector is measured at the edges of image. For the segmented colour image (right), each colour represents different vector and magnitude. Blue colour represents a smooth movement in 8x8 region of neighborhood pixel, while red colour represents movement of pixel outside 8x8 region neighborhood pixel which can be false information because the pixel is moved to another far region from their original place. In other hand, pink and green colours are the optical flow constraint that lead to the unable estimation of the movement in the region. Other color were the optical constraint and aperture problem which has not enough information to recover the optical flow at one point of the image intensity.
Based on figure 4(b) (right) during T = 5s, the image result represented a lot of blue colour that
indicates the tiny movement between two frames where the pixel was move only in 8x8 region pixel. The algorithm minimizes both the optical flow constraint and the magnitude of the variations of the flow field. This can be visualized on the flow vector on image that have a very smooth vector (figure 4(b) (middle). Meanwhile, figure 4(c) (right) during T = 10s, showed a bundle of movement in frame
in figure 4(b) (middle), the vector is rough and long which unable to estimate and allocate the new pixel into right location.
(a) Image analysis at T = 1 s
(b) Image analysis at T = 5 s
(c) Image analysis at T = 10 s
[image:6.595.79.527.134.682.2]
(d) Image analysis at T = 15 s
Figure 4. Result of (left) grayscale image, (middle) flow vector on image, and (right) segmented
6
technology such as surveillance and security monitoring system to improve a healthy lifestyle.
References
[1] TB Moeslund, E Granum 2001 Computer Vision and Image Understanding81 231.
[2] R Medina-Carnicer, A Carmona-Poyato 2010 IEEE Trans Image Process19 165.
[3] Shaveta Malik, Tapas Kumar 2016 Communications on Applied Electronics5 2.
[4] Suhaila Sari, Sri Erna Ervinna Asahrori, Hazli Roslan and Nabilah Ibrahim 2015 ARPN Journal of Engineering and Applied Sciences, 10 8812.
[5] Mat Harun, Noor Hafizzatul ‘Izzah and Ibrahim, Nabilah and Aziz, Nur Shazilah 2015 ARPN Journal of Engineering and Applied Sciences10 8635.
[6]
Mehmet Sezgin, Bulent Sankur 2004 Journal of Electronic Imaging13 146.Acknowledgments