Journal of Chemical and Pharmaceutical Research, 2014, 6(6):2443-2449
Research Article
ISSN : 0975-7384
CODEN(USA) : JCPRC5
Delphi method-based nest postgame operating efficiency evaluation
system research
Wei Wang
Zhejiang Industry Polytechnic College, Shaoxing, Zhejiang, China
_____________________________________________________________________________________________
ABSTRACT
After Olympic Games, big constructed stadium utilization rate is quite low. Establish stadium postgame operating efficiency evaluation system, and research on how to increase stadium operating efficiency is very important. The paper takes nest as an example, uses Delphi method to establish nest operating efficiency evaluation system, and provides corresponding construction. Firstly by Delphi method, it discusses on nest postgame operating efficiency influential first grade evaluation indicators. It gets social efficiency indicator influence is the largest. Utilize analytic hierarchy process to test the result, it finds that result has reliability. And then, use Delphi method, combines with first grade indicator weights, it defines total weight of nest postgame operating efficiency second grade evaluation indicators, results can refer to Table 9 in the paper. It gets that staff quality is most important, while environment quality and management system are the secondary ones, weights are respectively 0.0826, 、
0.0817、0.0817. To sum up, for nest management, it puts forward suggestions as promoting nest brand, improving
staff quality and so on.
Key words: Operating efficiency, evaluation system, Delphi method, analytic hierarchy process, indicator weight
_____________________________________________________________________________________________
INTRODUCTION
World Olympic Games of 2008 was hosted in Beijing, China. It not only implemented our country hundred years’ Olympics dream, but also the event hosting had great effects on our country economic, cultural and other aspects. In order to welcome the incoming Beijing Olympic Games, our country established and reconstructed lots of stadiums. These stadiums not only glowed brighter during the game, but also brought into huge economic efficiency to our country after the game [1-3].
Nest was a huge sports field that jointly fulfilled by Herzog, De Meuron and Chinese architect Li Xing-Gang in 2001 [4-6]. Nest belonged to special sports architecture, main structure design working life was 100 years, fire resistance rating was first grade, earthquake fortification intensity was eight degree, underground construction waterproofing grade was first grade, steel structure total dosage was 4.2 ten thousand ton [7-10]. Nest was formal started establishing since Dec. 24th, 2003, it was expected to be fulfilled on March, 2008, project total construction cost was 22.67 hundred million Yuan [10-12].
earnings to conform to investment after the game, how to give its own sustainable development force into play, improve management mode, optimize operating level under rapidly economic development environment has become the key to nest postgame operation. The key to the problem is to measure nest self “development degree”, discriminate its “coordination degree” with external factors. By adjusting, it finds out nest economic evaluation system, optimize corresponding aspects’ operating level to improve nest overall operating levels.
OPERATING EFFICIENCY EVALUATION INDICATOR SYSTEM ESTABLISHMENT
According to nest operational features, it is known that nest operating efficiency is related to multiple aspects factors. To establish nest operating efficiency evaluation indicator system, it needs to find out different factors impacts degrees on operating efficiency. It is similar to Delphi method. Delphi method is using experienced experts opinions by widely consulting to predict one subject or one project future development method. The method is relative simple, and saves expense.
Delphi method
Firstly, it should find out research objects evaluation indicators. Then define every expert evaluation on different indicators, according to expert evaluation, it gets every indicator weight. Assume it totally has n pieces of factors, m experts to participate in scoring, and then expert scores on every kind of indicators are as Table 1 shows.
Table1: Different indicator relative importance scores
Indicator 1 2 3
K
j
K
n
1
C
11C
12C
13K
C
1jK
C
1n2
C
21C
22C
23K
C
2jK
C
2n3
C
31C
32C
33K
C
3jK
C
3nK
K
K
K
K
K
K
K
i
C
i1C
i2C
i3K
ijC
K
in
C
K
K
K
K
K
K
K
K
m
C
m1C
m2C
m3K
mjC
K
C
mnAccording to above Table 1, it can get experts’ different indicators scores arithmetic average value is:
∑
= = mii ij j
j C
m M
1 1
(1)
Then every indicator full score limit is:
j j j
m m K
1 1 =
(2)
First grade evaluation indicator weight defining
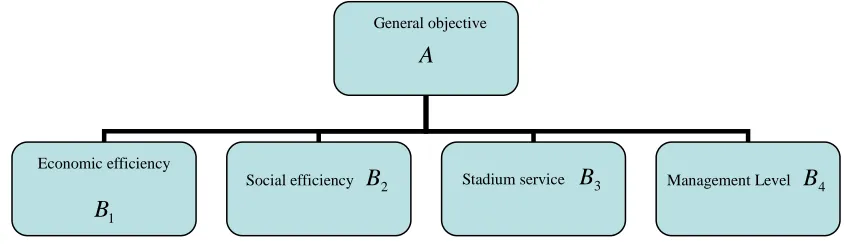
Figure 1: First grade classification
Make classification of every kind of indicators factors according to operating efficiency impact degree size. Every indicator can divide into five grades according to emphasis from big to small: very important, important, normal, less important, much less important. To every grade emphasis to score that are respectively: 5、4、3、2、1.Expert
[image:3.595.93.523.75.201.2]scoring status on every kind and indicators are as Table 2 shows.
Table 2: First grade indicator importance experts’ scores
First grade indicator Very important(5) Important(4) Normal(3) Less important(2) Much less important(1)
Economic efficiency 11 9
Social efficiency 14 5 1
Stadium service 9 9 1 1
Management level 8 10 1 1
[image:3.595.101.512.305.385.2]Utilize Delphi method to score above each indicator importance degree. Input above Table 2 data into formula (1) and formula (2), respectively can get each indicator score average value, and full score limit. Therefore it can get each indicator importance. Each first grade indicator importance score is as Table 3 shows:
Table 3: First grade indicator importance score
First grade indicator Average value Full score limit
Economic efficiency 4.55 0.55
Social efficiency 4.65 0.70
Stadium service 4.30 0.45
Management level 4.25 0.40
According to above Table 3, it is not hard to analyze that nest social efficiency indicator occupies most important proportions in operating efficiency evaluation system, and economic efficiency is the secondary one. Delphi method accords to experts’ scores, it has certain subjectivity. For above results, we utilize analytic hierarchy process to test the model. By testing whether the two results are consistent or not and further define whether it can utilize Delphi method to judge indicator importance.
At first construct judgment matrix:
Hierarchical structure reflects relations among each element, but criterion layer’s each criterion weight covers the targets measurement is not always the same. The paper adopts establishing paired comparison matrix method on
factor
B
to carry out paired comparison. Which is taking two factorsB
iandB
jevery time, withm
ijrepresentingi
B
and
B
jaffectA
ratios, whole comparison result use matrixC
=
( )
m
ij n×nto express, it calledC
asA
−
B
paired comparison judgment matrix, it is called judgment matrix for short. According to experts’ paired score comparisonamong
B
1,B
2,B
3,B
4, it can get judgment matrixC
:General objective
A
Economic efficiency
1
B
7 2 3 (3)
With the help of Matlab calculation, it can get:
=
0.08 0.15 0.54 0.23
v
Hierarchical single arrangement and consistency test:
Judgment matrix
C
corresponds to maximum feature valueλ
max feature vectorv
, it is the priority weight of samehierarchy corresponding elements that is relative important to last hierarchy some element after normalization, and the process is called hierarchical single arrangement.
Consistency indicator:
1 − − =
n n
CI λ
(4)
WhenCI =0,
C
is consistency matrix, the largerCI
is, the more seriously inconsistency extentC
would be. [image:4.595.88.517.390.431.2]Random consistency indicator
RI
values as Table 4 shows:Table 4: Random consistency indicator
RI
n
1 2 3 4 5 6 7 8 9 10 11RI
0 0 0.58 0.90 1.12 1.24 1.32 1.41 1.45 1.49 1.51For n≥3 paired comparison matrix
C
, it is called its consistency indicator and same order (refers ton
is thesame) random consistency indicator
RI
ratio as consistency ratioCR
, when:1 . 0
< =
RI CI CR
(5)
It is thought that
C
inconsistency extent is within permissible range, it can use its feature vector as weight vector.Use Matlab calculating each matrix maximum feature value as
λ
max=
4
=
n
, thereforeCR
is surely less than0.1, therefore comparison matrix
C
meet consistency test. Sov
can be taken as weight vector. That isai=0.23, 54. 0 =
i
b , ci =0.15, di =0.08. That according to each indicator important from big to small, they are successive:
social efficiency, economic efficiency, stadium service, management level. It is consistent to Delphi method result. So it can use Delphi method to solve the problem.
Second grade evaluation indicator weight defining
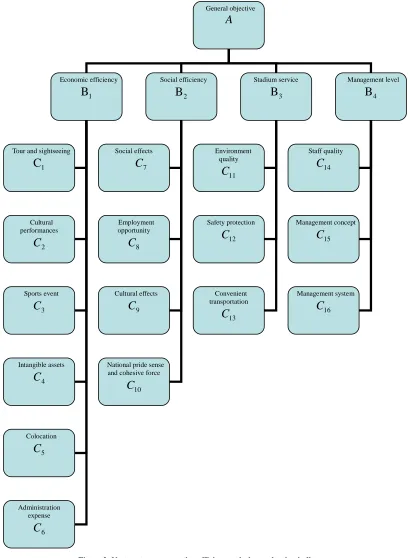
Figure 2: Nest postgame operating efficiency relative evaluation indicators
Similar to above, it continues to use Delphi method to make importance judgment on second and third grade indicators. Investigation experts score second grade indicators under social efficiency, as Table 5 shows:
Table 5: Under social efficiency second grade indicators’ scores
Second grade indicator Very important(5) Important(4) Normal(3) Less important(2) Much less important(1)
Social effects 13 6 1
Employment opportunity 4 11 5
General objective
A
Economic efficiency 1
B
Stadium service 3
B
Management level 4
B
Social efficiency2
B
Tour and sightseeing 1
C
Cultural performances
2
C
Sports event 3
C
Social effects
C
7Employment opportunity
8
C
Cultural effects 9
C
National pride sense and cohesive force
10
C
Environment quality
11
C
Safety protection 12
C
Convenient transportation
13
C
Staff quality 14
C
Management concept 15
C
Management system 16
C
Colocation 5
C
Intangible assets4
C
Administration expense
[image:5.595.73.537.707.757.2]Social effects 4.60 0.01
Employment opportunity 3.95 0.20
Cultural effects 4.30 0.40
National pride sense and cohesive force 4.10 0.30
According to above Table 6 each indicator importance data result, it can get each second grade indicator to first grade indicator importance degree. Single layer grade weight calculation:
∑
=
=
ni i i
i
f
f
w
1
/
(6)
Among them,
f
i represents all experts to indicators scores average value, n represents number of experts.According to Table 3, input experts scores into formula (6), then it can get under general objective every kind of first grade indicators single layer weight, as Table 7 shows:
Table 7: Under general indicator first grade indicator single layer weight
Indicator Economic efficiency Social efficiency Stadium service Management level
Weight 0.2563 0.2614 0.2422 0.2394
Second grade indicator total weight value is:
ij i
Bj
w
w
w
=
⋅
(7)
[image:6.595.173.439.126.205.2]Among them,
w
i represents first grade thei
indicator weight,w
ij represents under first grade thei
indicator, thej
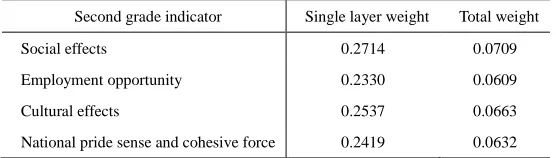
second grade indicator weight. According to Table 6 and Table 7 data, it can get under social efficiency second grade indicator single layer weight, and total weight as Table 8 shows:Table 8: Under social efficiency second grade indicator single layer weight and total weight
Second grade indicator Single layer weight Total weight
Social effects 0.2714 0.0709
Employment opportunity 0.2330 0.0609
Cultural effects 0.2537 0.0663
National pride sense and cohesive force 0.2419 0.0632
According to Table 8, then it can define second grade indicator importance. When single layer weight is important, it shows the factor has larger importance to first grade indicators, when weight is small, it shows the indicator has relative weaker importance to first grade indicators. When total weight is important, it shows the factor in nest operating efficiency evaluation is relative more important. When total weight is smaller, it shows the indicator relative importance in nest operating efficiency evaluation is smaller.
[image:6.595.168.446.531.610.2]Table 9: All evaluation indicator weights
First grade indicator Total
weight Second grade indicator
Single layer weight
Total
weight Second grade indicator
Single layer weight
Total weight
Economic efficiency 0.2563
Tour and sightseeing 0.1650 0.0423 Intangible assets 0.1750 0.0449
Cultural performances 0.1571 0.0403 Colocation 0.1610 0.0413
Sports event 0.1889 0.0484 Administration expense 0.1531 0.0392
Social efficiency 0.2614 Social effects 0.2714 0.0709 Cultural effects 0.2537 0.0663 Employment opportunity 0.2330 0.0609 National pride sense and cohesive force 0.2419 0.0632
Stadium efficiency 0.2422 Environment quality 0.3372 0.0817 Convenient transportation 0.3142 0.0761 Safety protection 0.3487 0.0845
Management level 0.2394 Staff quality 0.3452 0.0826 Management system 0.3413 0.0817 Management concept 0.3135 0.0751
By consulting relative information, it is clear that above each indicator weight has no big difference with information, so research result has certain reliability. According to above table each grade evaluation indicator weight, it can get different evaluation indicators importance to nest operating efficiency. According to importance and weights, the solved weighting sum is nest postgame operating efficiency score.
CONCLUSION
According to experts scores status, it is not difficult to see that all experts think social efficiency such indicator is more important. According to Table 9 result, social efficiency total weight is 0.2614.And economic efficiency weight is 0.2563, it is slightly lower than social efficiency. Other stadium efficiency weight is 0.2422, importance is lower than economic efficiency. And management level weight is the lowest as 0.2394, importance is also the lowest.
According to Table 9 each layer indicator factor weight, by comparing, it is clear that nest safety protection work is most important for nest operating efficiency grading, others contain overall management, environment quality, traffic management and others, all are very important. And under economic efficiency second grade evaluation indicator weight is not big; its importance to nest postgame operating efficiency evaluation is lower. Therefore, when people utilize nest to carry out effective operating, compare to its profits status, they more focus on nest social efficiency, management level and other aspects.
In order to increase nest profits status, we put forward following suggestions: increase nest postgame advertisement, as cultural advertisement, advertising and so on. Try to build nest into communicative carrier to upgrade city publicity and abstract foreign investments. Put emphasis on nest self quality cultivation. Organize relative famous events or cultural transmission events. Not only build nest into high level stadium, but also build it into international cultural exchanging high class platform. So as to improve nest attendance, bring pressure to foreign organizers, and meanwhile improve nest brand. Enhance nest internal staff quality; staff quality is best reflection of brand. In addition, better staff quality is easily to leave deeper impression to investors. It is beneficial to nest permanent development.
REFERENCES
[1] HUANG Xiao-mao, ZENG Wan-zhou. Sci-Tech Information Development & Economy, 2007, 17(21), 137-138. [2] ZHOU Liang-jun, CHEN Xiao-ying and ZHOU Xi-kuan. Sports Science Research, 2007, 28(4), 48-51. [3] CAI Li-bin, JIA Jun-gang. Journal of Huazhong University of Science and Technology, 2007, 21(5), 67-70. [4] HUANG Lu, FU Xiao-chun. Journal of Capital College of Physical Education, 2005, 17(6), 12-13. [5] Guo Hong - bo, Zhu Yong. Fujian Sports Science and Technology, 2013, (3), 3-5.
[6] REN Chunxiang, ZHANG Jie. Sports & Science, 2004, 25(3), 14-17. [7] Ye Chaozhong. Journal of Anhui Sports Science, 2002, 23(2), 30-32.
[8] LU Geng-hua, LIU Xin-min. Journal of Xi'an Institute of Physical Education, 2006, 23(5), 44-46.
[9] ZHOU Liang-jun, ZHOU Xi-uan. Journal of Guangzhou Physical Education Institute, 2006, 26(5), 13-16. [10] HUANG Hai-yan, ZHANG Lin, LI Nan-zhu. China Sport Science, 2007, 27(2), 17-25.
[11] DONG Jie. Sports & Science, 2012, 33(3), 42-51.