Journal of Chemical and Pharmaceutical Research, 2014, 6(5):1302-1309
Research Article
ISSN : 0975-7384
CODEN(USA) : JCPRC5
In vitro antioxidant activity and phytochemical analysis of ethanolic
extract of Lentinus connatus
L. Sushila Devi
1, Mayukh Chakraborty
2, Chandrima Chakraborty
3, S. K. Borthakur
1and
N. Irabanta Singh
4*1
Botany Department, Gauhati University, Guwahati
2
Department of Biotechnology, St. Xavier’s College, Kolkata
3
Department of Botany, University of Calcutta, Kolkata
4
Centre of Advanced Study in Life Sciences, Manipur University, Canchipur, Imphal
_____________________________________________________________________________________________ABSTRACT
The study was conducted with ethanolic extract of edible mushroom, Lentinus connatus, which was tested for total phenol, flavonoid, β-carotene, lycopene and ascorbic acid and in vitro antioxidant activity in terms of superoxide anion and DPPH radical scavenging activity. Some other biochemical assays including chelating effect of ferrous ion, reducing power and total antioxidant capacity assay were conducted with varying concentrations. The data showed that EC50 values were between 1 – 2 mg /ml except superoxide and DPPH radical scavenging tests. Phenol
was present in the highest amount followed by other bioactive components (flavonoids, ascorbic acid, β carotene and lycopene in the respective order). The results obtained reveal that L. connatus can be a potential source of natural antioxidant which may be used to treat various oxidative stress related diseases.
Key words: edible mushroom, Lentinus conatus, free radical, flavonoids, phenols.
_____________________________________________________________________________________________
INTRODUCTION
Under different patho-physiological conditions, the balance between the generation and elimination of reactive oxygen species (ROS) is broken. As a result a wide range of essential biomolecules are damaged by this ROS mediated oxidative stress. This uncontrolled generation of free radicals leads to the development of several health disorders such as cancer, diabetes, neurodegenerative and inflammatory disorders [1]. Recent research on human nutrition and biochemistry revealed an increasing interest is developing to identify antioxidant ingredients derived from food ingredients that could delay or prevent the oxidation of cellular components. Although the synthetic antioxidants are effective and cheap compared to the natural ones, their applications are restricted due to potential risk to health [2]. Therefore, new interest has developed in search of natural antioxidants from natural resources.
[12] and microbial diseases [13-16]. Here, we report the antioxidant properties of Lentinus connatus based on in
vitro antioxidant assay systems.
EXPERIMENTAL SECTION
Ethanolic extract of the sample was prepared [17]. The sample was dried, powdered and extracted with ethanol at 25ºC for 2 days. After filtration, the residue was then re-extracted with ethanol, as described above. The supernatant was concentrated under reduced pressure in a rotary evaporator. Then, this ethanolic extract of Lentinus connatus was stored at 4ºC until further analysis. The percentage yield extracts were calculated based on dry weight as:- Yield (%) = (W1 × 100)/ W2
Where W1 = weight of extract after solvent evaporation; W2 = Weight of the minced mushroom.
Determination of total phenolic content
The method for determination was that of given by Singleton and Rossi (1965) [18].To the sample extract (100 µl), 1 ml of 1N Folin–Ciocalteu reagent was added. After 4 min, a saturated sodium carbonate solution (approximately 35 g/100ml, 1 ml) was added to it. The absorbance of the reaction mixture was measured at 725 nm after incubation for 1 hr 30 min at room temperature. Gallic acid was used as a standard, and the results were expressed as milligram gallic acid equivalent (mg GAE)/g of extract.
Determination of flavonoids
100 µl of the sample extract was added to 80% ethanol containing 0.1 ml of 10% aluminium nitrate and 0.1 ml of 1M Potassium acetate. The mixture was incubated at room temperature for 40 min and its absorbance was measured at 415 nm park et al. (1997) [19]. Quercetin was used as standard.
Determination of β-carotene and lycopene
For β-carotene and lycopene determination, 100 µl of the sample extract was vigorously shaken with 10 ml of an acetone–hexane mixture (4:6) for 1 min and filtered through Whatman No. 4 filter paper followingNagata and Yamashita et al. (1992) [20]. The absorbance of the filtrate was measured at 453, 505, and 663 nm. β-carotene and lycopene content were calculated following equations: lycopene (mg / 100 ml) = 0.0458×A663 + 0.372×A505 -0.0806×A453; β-carotene (mg/ 100 ml) = 0.216×A663 0.304×A505 + 0.452×A453. The results are expressed as mg of carotenoid/g of extract.
Ascorbic acid content determination
Ascorbic acid content was determined following Rekha et al, 2012 [21] with a little modification. Standard ascorbic acid (100 µg /ml) was taken in a conical flask and made up to 10 ml by 0.6% oxalic acid. It was titrated with a dye, 2, 6-dichlorophenol indophenol. The amount of dye consumed (V1 ml) is equivalent to the amount of ascorbic acid. The sample (w µg/ml) was similarly titrated with the dye (V2 ml). The amount of ascorbic acid was calculated using the following formula,
Ascorbic acid (µg /mg) = [{(10 µg /V1ml) × V2 ml} × w µg] × 1000
Reducing power
Reducing power of the sample was determined following Oyaizu 1986 [22]. Varied concentrations of the sample (0.5 - 2 mg/ml) were added to 2.5 ml of 0.2 M Phosphate buffer (pH 6.6) and 2.5 ml of 1% potassium ferricyanate. 2.5 ml of 10% trichloro acetic acid was added to the mixture after an incubation of 20 min at 50˚C. It was then centrifuged for 10 min at 12000 rpm. 2.5 ml of the supernatant was mixed with distilled water and 0.5 ml of 0.1% ferric chloride. Its absorbance of the reaction mixture was interpreted as an increase in reducing power of the sample. Antioxidant has ability of donation of electron and causes conversion of the oxidation form of iron (Fe+3) in ferric chloride to ferrous (Fe+2). The resulting Perl`s Prussian blue is measured at 700 nm and higher absorbance indicates higher reducing power.
Chelating ability
absorption value of reaction mixture at 562 nm could be used to estimate the metal chelating activity of antioxidant [23].
To measure the ferrous ion chelating ability of the sample the method proposed by Dinish et al. 1995 [23] was followed with little modification. The sample (0.5 – 2 mg/ml) was mixed with 2 mM FeCl2 (0.5 ml) to which 5 mM ferrozine was added. The mixture was shaken vigorously and left to stand at room temperature for 10 min. The absorbance was measured at 562 nm. The decrease in absorbance indicated an increase in the ferrous ion chelating ability of the sample. The following formula was used for determination of the percentage inhibition of ferrozoin Fe+2, complex formation.
Scavenging effect (%) = {(α0-α1)/α0} × 100
where α0 and α1 were the absorbance of control and in presence of sample.
Super oxide radical scavenging activity (SOD)
The riboflavin – light – nitroblue tetrazolium (NBT) system suggested by Martinez et al (2001) [24] was used to study the super oxide radical scavenging activity of the sample. This method was followed with minor modification. 3 ml of reaction mixture was prepared containing 50 mM sodium phosphate buffer (pH 7.8) 13 mM methionine and ethanolic extracts of various concentrations, 75 µM NBT, 100 µM EDTA and 2 µM riboflavin. One set of the reaction mixture was kept exposed to light for 10 min to activate the NBT and absorbance of each mixture was measured at 560 nm against identical mixtures from another set kept in the dark for same duration. BHA (butylated hydroxyl anisole) was used as standard. The degree of scavenging was calculated as follows:-
Scavenging effect (%) = {(α0-α1)/α0} × 100
where α0 and α1 were the absorbance of control and in presence of sample.
DPPH radical scavenging assay
The model of scavenging DPPH radical is a widely used method to evaluate antioxidant activities in a relatively short time compared with other methods. Effect of antioxidants on DPPH scavenging was thought to result from their hydrogen donating ability. Upon reduction, solution of DPPH fades from purple to yellow. Thus, a lower absorbance at 517 nm indicates a higher radical scavenging activity of extract. The DPPH radical scavenging ability of the sample extract was measured following Shimada et al. 1992 [25]. 2 ml of reaction mixture was prepared using different concentrations of sample (1 - 2.5 mg/ml) and methanol solution of DPPH (0.004 %) (w/v). The absorbance was read against a methanol blank at 517 nm after 30 min incubation at room temperature in dark. The degree of scavenging was calculated by the following equation
Scavenging effect (%) = {(α0-α1) / α0} × 100
where α0 and α1 were the absorbance of control and in presence of sample.
Determination of total antioxidant capacity (TAC)
The TAC was determined on the basis of reduction of Mo (VI) to Mo (V) by the antioxidant compound and the formation of green phosphate / Mo (V) complex at acidic pH. Total antioxidant capacity of the sample was investigated and compared against ascorbic acid. The TAC of the sample was determined by the assay prescribed by Preito et al 1999 [26] with modifications. A reaction mixture was prepared consisting of 0.3 ml of reagent solution (0.6 M H2SO4, 28 mM Na2SO4, 4 mM NH4Mo). Absorbance was measured at 695 nm after heating tubes at 95˚C for 90 min. Ascorbic Acid was used to draw a standard curve and TAC was expressed as the equivalent of Ascorbic Acid.
Statistical analysis
RESULTS AND DISCUSSION
Extractive value and phytochemicals
The extract was brown in colour and had an extractive value of 5.58%. Phenol was present in the highest amount i.e. 17.9 ± 0.73 µg/mg of the sample. Flavonoid (1.93 ± 0.11 µg/mg) and ascorbic acid (1.636 + 0.26 µg/mg) were present in moderate amounts whereas β carotene (0.013 ± 0.002 µg/mg) and lycopene (0.0095 ± 0.0012 µg/mg) were also present in trace amounts. Phenolic compounds are powerful chain breaking antioxidants as they possess scavenging ability due to their hydroxyl groups.
Ascorbic acid is reported to interact directly with radicals such as superoxideand hydroxyl radicalin plasma, thus preventing damages of the RBC membranes.
Reducing power
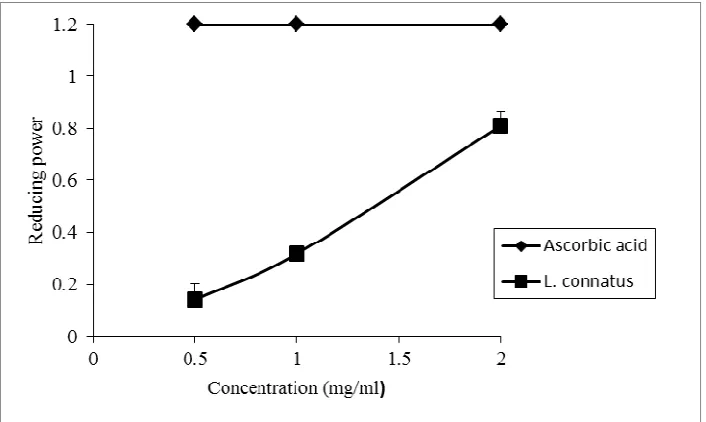
Reducing power of a compound indicates its potential antioxidant activity. The reducers (i.e., antioxidants) reduces Fe3+/ferricyanide complex to ferrous form. The yellow colour of the test solution is changed in to various shades of green and blue, depending on the reducing power of the sample is found to be a potential reducing agent, having an EC50 value of 1.27 mg/ml (Fig 1). From previously reported studies, Hypsizigus marmoreus [27], Calocybe gambosa [28], Tricholoma giganteum [29], Russula. albonigra [2] Amanita vaginata [30] have reducing ability lesser than L.
[image:4.595.123.476.329.540.2]connatus. Thus the sample has excellent reducing ability.
Fig 1: Reducing Ability of ethanolic extract of Lentinus connatius.
(Ascorbic Acid was used as the standard. Results are mean ± standard devialtion of three separate experiments).
Chelating ability
Development of potential chelating agents from natural mushrooms thus provides an effective way to protect human beings from free radical damage. The ability to deactivate and or chelate Fe2+ is the main mechanism of the ferrous ion chelating activity which helps in promotion of Fenton reaction and hydroperoxide decomposition. Iron toxicity is related to higher risk of free radical damage and cancer. Chelation therapy normally reduces iron related free radical damage and decreases life risk in case of cardiovascular diseases. At 0.5 - 2 mg/ml, the chelating ability of L.
connatus extract is in between 35.14% - 77.7%. The ferrous ion chelating ability of L. connatus was effective and
the EC50 value was found to be 0.56 mg/ml (Fig 3) which was much higher than that of Pleurotus flabelatus [31] . In the previous studies, investigators showed that the EC50 value of the ethanolic extract for Russula albonigra [2],
Amanita vaginata [30] and Hypsizigus marmoreus [27] were much higher than that of the sample of our study. So, L. connatus shows high interference by forming ferrous and ferrozine complex and can be considered as a good
Fig 2: Chelating ability of ethanolic extract of Lentinus connatus
(Ascorbic Acid was used as the standard. Results are mean ± standard deviation of three separate experiments).
Super oxide radical scavenging activity (SOD)
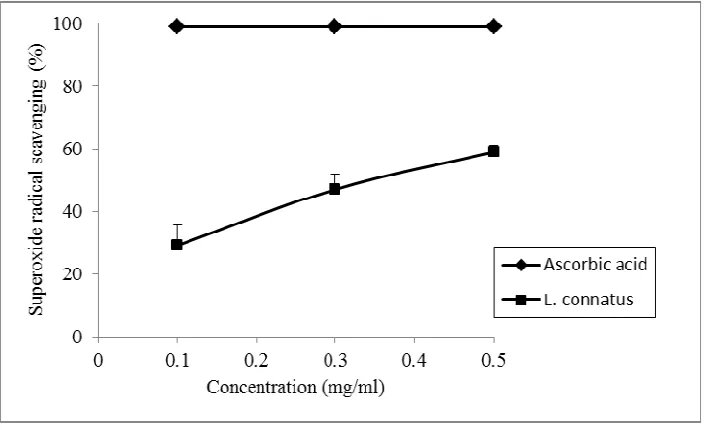
Addition of one electron to molecular oxygen forms the superoxide anion radical (O2.-) and such occurs mostly within the mitochondria of a cell. It is considered as primary ROS as it is a relatively weak oxidant but it can generate secondary ROS such as peroxynitrate (ONOO·), peroxyl radicle (LOO·), singlet oxygen, hydroxyl radical (OH·) and hydrogen peroxide.
Fig 3: Superoxide radical scavenging activity of ethanolic extract of Lentinus connatus
(Ascorbic acid was used as the standard. Results are mean ± standard deviation of three separate experiments).
[image:5.595.123.475.422.637.2]with previous studies, the EC50 value of the sample was higher than that of Tricholoma giganteum [29], Russula
albonigra [2].
DPPH radical scavenging activity
DPPH is a stable free radical that shows a characteristic absorbance at 517 nm, which decreases significantly when exposed to radical scavengers by providing hydrogen atom or electron to be a stable diamagnetic molecule. Ethanolic fraction of L. Connatus has an EC50 value of 2.367 mg/ml (Fig 4). The 0.5-2.5 mg/ml concentration of ethanolic extract of L. Connatus shows the DPPH radical scavenging activity of 13.1-53.88%. The DPPH radical scavenging activity from different studies can be comparatively written as Pleurotus flabellatus [31] > Amanita
vaginata [30] > Russula albonigra [2]. So, it is clear that the ethanolic extract of the sample has significant DPPH
[image:6.595.149.450.238.448.2]radical scavenging activity.
Fig 4: DPPH Scavenging activity of ethanolic extract of Lentinus connatus
(Results are mean ± standard devialtion of three separate experiments).
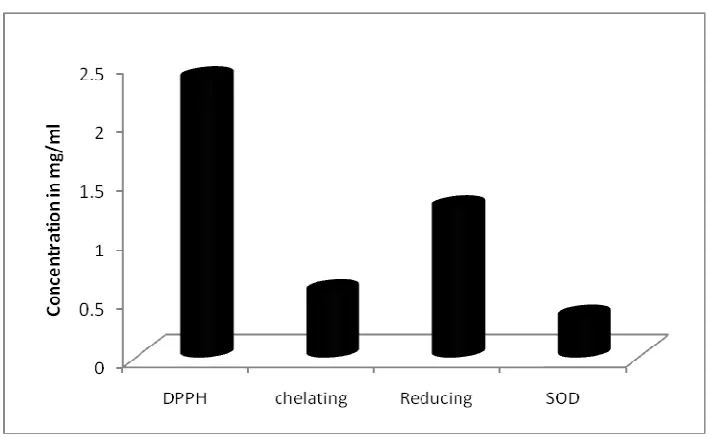
Fig 5: Comparative EC50 values of Lentinus conatus
[image:6.595.121.477.481.700.2]Total Antioxidant Capacity
The TAC of the extract was estimated using ascorbic acid as the standard.The TAC of the ethanolic extract of the sample can be attributed to the presence of phenol acid content and its chemical compositions. The TAC value of the ethanolic extract of L.connatus was found to be 115±65 µg/mg .
EC50 values
EC50 value is the effective concentration at which 50% free radical can be scavenged by the sample. The lower EC50 value signifies higher antioxidant activities. Figure 5 represents all EC50 values of Lentinus connatus derived from four different antioxidant methods.
CONCLUSION
Thus, from the present study the ethanolic extract of Lentinus connatus was found to be an effective antioxidant in different in vitro assays including Ferrous iron chelating, ferric iron reducing, DPPH free radical scavenging and total antioxidant activity, having a good amount of phenolics, flavonoids and ascorbic acid .
Acknowledgement
The corresponding author (Prof. N. Irabanta Singh) wish to thank Department of Biotechnology, Government of India for funding a co-ordinated project “Developing a digital database on Bioresources of N.E. India” (BT/29/NE/2011 dt 28 Nov. 2011) during this tenure the work was conducted.
REFERENCES
[1]S Khatua; S Paul; K Acharya, Res. J. Pharm. Tech., 2013, 6(5), 496-505.
[2]A Dasgupta; D Ray; A Chatterjee; A Roy; K Acharya, J. Chem. Pharm. Res., 2014, 6(3), 1366-1372.
[3]3. S T Chang; JA Buswelt, World J. Microbial. Biotech., 1996, 12, 473-476.
[4]G Biswas; S Chatterjee; K Acharya, Dig. J. Nanomater. Bios., 2012,7, 185-191.
[5]S Chatterjee; G Biswas; S Chandra; G K Saha; K Acharya, Bioproc. Biosys. Eng., 2013, 36, 101-107.
[6]G Biswas; K Acharya, Int. J. Pharm. Pharm. Sci., 2013, 5 (Suppl 1), 391-394.
[7]A Chatterjee; S Khatua; S Chatterjee; S Paloi; S Mukherjee; A Mukherjee; K Acharya; S K Bandyopadhyay,
Glycoconjugate J., 2013, 30, 759-768.
[8]S Chatterjee; A Dey; R Datta; S Dey; K Acharya, Int. J. PharmTech. Res., 2011, 3, 2162-2168.
[9] G Biswas; S Sarkar; K Acharya, Dig. J. Nanomater. Biosys. Eng., 2012, 6, 637-641.
[10]K Acharya; S Chatterjee; G Biswas; A Chatterjee; G K Saha, Int. J. Pharm. Pharm. Sci., 2012, 4(3), 285-288.
[11]S Chatterjee; R Datta; A Dey; P Pradhan; K Acharya, Res. J. Pharm. Tech., 2012, 5(8), 1034-1038.
[12]G Biswas; S Rana; S Sarkar; K Acharya, Pharmacologyonline, 2011, 2, 808-817.
[13]S Giri; G Biswas; P Pradhan; SC Mandal; K Acharya, Int. J. PharmTech. Res., 2012, 4(4), 1554-1560.
[14]TK Lai; G Biswas; S Chatterjee; A Dutta; C Pal; J Banerji; M Bhuvanesh; JH Reibenspies; K Acharya, Chem.
Biodivers., 2012, 9, 1517-1524.
[15]M Rai; S Sen; K Acharya, Int. J. PharmTech. Res., 2013, 5(3), 949-956.
[16]S Mallick; A Dutta; S Dey; J Ghosh; D Mukherjee; S S Sultana; S Mandal; S Paloi; S Katua; K Acharya; C Pal,
Exp. Parasitol., 2014, 138, 9-17.
[17]K Acharya; P Yonzone; M Rai; R Acharya, Indian J. Exp. Biol., 2005, 43:926-929.
[18]VL Singleton; Jr JA Rossi, Am. J. Enol. Viticult., 1965, 16, 144-158.
[19]YK Park; MH Koo; M Ikegaki; JL Contado, Arq. Biol. Tecnol., 1997, 40, 97-106. [20]M Nagata; I Yamashita, Nippon Shokuhin Kogyo Gakkaishi, 1992, 39, 925-928.
[21]C Rekha; G Poornima; M Manasa; V Abhipsa; DJ Pavithra; KHT Vijay; KTR Prashith, Chem. Sci. Trans.,
2012, 1(2), 303-310.
[22]M Oyaizu, Jpn. J. Nutr., 1986, 44, 307-315.
[23]TCP Dinis; VMC Mudaira; LM Alnicida, Arch. Biochem. Biophys., 1994, 315, 161-169. [24]AC Martinez; EL Marcelo; AO Marco; M Moacyr, Plant Sci., 2001, 160, 505-515.
[25]K Shimada; K Fujikawa; K Yahara; T Nakamura, J. Agric. Food Chem., 1992; 40, 945-948. [26]P Prieto; M Pineda; M Aguilar, Anal. Biochem., 1999, 269, 337-341.
[27]Y-L Lee; M-T Yen; J-L Mau, Food Chem., 2007, 104, 1-9.
[29]S Chatterjee; G K Saha; K Acharya, Pharmacologyonline, 2011, 3, 88-97. [30]S Paloi; K Acharya, Asian J. Pharm. Clin. Res., 2014, 7, 214-217.