Status of Human Development in the District of Birbhum
at Block Level
Debasish Roy
Rabindra Bharati University
*Corresponding author: [email protected]
Copyright © 2013 Horizon Research Publishing All rights reserved.
Abstract
Birbhum district originates in the chhotanagpu plateau region of Jharkhand and is slope across the district in a west-east direction. Here the percentage of Hindu population is 64.5%, percentage of Muslim population is 35.1% and others consist of 0.40%. The methodology is mainly based on United Nations Development Programme HDR framework. 7 blocks are in less developed category, 12 blocks are in medium developed category.Keywords
Human Development1. Introduction
The human development perspective explicitly recognizes expansion of people’s choices and freedom as the basic purpose of development. Ever since the publication of the first Human Development Report (HDR) by the United Nations Development Programme (UNDP) in 1990, the human development perspective has been strengthening its influence on the policy makers and development administrators, and on the way they view development. The present paper tries to look at the approach of Human Development Index in the blocks of Birbhum district of West Bengal. It tries to identify the regions, measure and analyze the Human Development Index of Birbhum district of West Bengal. The agro-climatic conditions of the Birbhum District are not favourable for diversified agricultural production. In most of the blocks irrigation facilities are very poor, health care facilities are not favourable, and suffering from poor infrastructure development. There is a considerable migration of younger population of other districts/ states in search of alternative occupations.
Birbhum district is centrally located in West Bengal (23°33'N to 24°35'N and 87°10'S to 88°2'S). Birbhum is one of the 19 districts of West Bengal sharing 5.12 percent of the land area of the state but 3.76 percent of its total population, indicating a relatively lower density of population per square kilometer in the district (663) vis-a-vis the state (903). The district is characterized by an undulating topography caused by the Chhotanagpur Plateau that passes through the Western
borders of the district. The land terrain slopes down towards the east and merges with the alluvial plains of the Ganga. The district borders the states of Jharkhand and Bihar on the West, and lies at the eastern end of the Chhotanagpur Plateau. The district is triangular in shape with the rivers Ajoy forming the base of the triangle. The river forms the boundary between Birbhum and Bardhaman districts. Another important river is Mayurakshi, on which a river valley project that includes the Tilpara Barrage provides irrigation for about 6,00,000 acres. The comparatively fertile eastern portion, constituting the north-eastern Rarh region, merges with the Gangetic plain. Important geographical features in Birbhum are the Khoai, the red soil, with palm trees visible from a long distance and protected forest areas on the western side. Birbhum has some mineral reserves that are relatively unimportant in the national context but in west Birbhum. Summer temperatures can be over 40oC and in winter it can be about 10oC. The region receives a rainfall of around 1300mm per year, mostly concentrated in the monsoon. The dry plateau feature makes the land in the west less fertile compared to the plains in the east. Situated near the main railway
2. Methodology
The study is based on data from secondary sources. Census of India (2001, 1991), Human Development Report (Birbhum) and Districts Statistical Handbook of Birbhum (2009) provide most of the data required for the study.
The parameters for calculating the Human Development Index for Birbhum district is slightly different from the HDI propounded by UN. The parameters used by UN in calculation of HDI are not available at block level. Here HDI is prepared with the available block level statistical data. The parameters are following:
Dimension 1:-Health Index
Indicators:-I.Health Centre Density/10Sq. km, II Number of beds/1000 populations,III.Number of doctors/1000 populations,IV.Number of familywelfare centers/1000 populations.
four indicators.
Dimention 2:- Knowledge
Indicators: -I. Total literacy Index is calculated-Actual percentage/100, II.Combind Enrolment Index(Number of students in Primary,Middle and High School)
EAI=2/3(Total literacy Index+1/3 combind enrolment index) .(Actual-Minimum)÷(Maximum-Minimum) formula is used for the calculation.(HDR,2006)
Dimention 3: - Standerd of Living
Indicators: I.Per capita small savings,II.% of electrified mouzas,III.Surface Road Density,IV.%of mouzas with drinking water.Dimention Index: - Standerd of livingIndex(SLI)=Grand Index made by the four indicators.(Actual-Minimum)÷(Maximum-Minimum)
formula is used for the calculation.(HDR,2006)
The HDI is the simple arithmetical average of these three indexes.
HDI= (Health Index + Education Index + Standard of Living Index) /3
To work out the dimension index of individual parameters the following formula has been used:
Dimension Index = (Actual value – Minimum value) / (Maximum value- Minimum value).
3. Result
Health Index
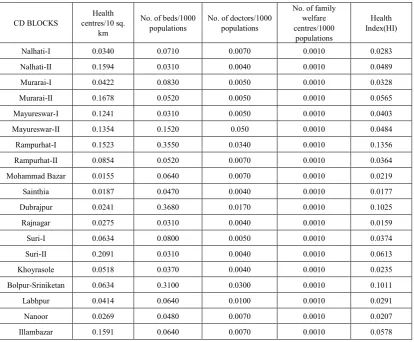
Life expectancy at birth is the main parameters to measure the health condition of the region. But in the block level no such data is available. So here Health Index is calculated from four realistic indicators of the district.(Table.1)
1. Health Care Density: - Health care facility means government hospitals, Health centres, Sub-centres and Private clinics. Poor density of these institutions forced to count them per 10 sq. km basis.
Health Centre Density/ 10 sq. km = (No. of health centers/Area) × 10
2.No. of Beds in Hospitals: - The availability of beds per thousand population is calculated as Availability of beds= (No. of beds/ Total population) × 1000.
3. Availability of doctors: - The availability of doctors per 1000 population is calculated as Availability of Doctors= (No. of Doctors/ Total population) × 1000
[image:2.595.115.530.384.726.2]4. Family Welfare Centre: - It is calculated as Achievement in Family welfare= (No. of welfare centers /Total population)×1000.
Table 1. Table for health index
CD BLOCKS centres/10 sq. Health km
No. of beds/1000
populations No. of doctors/1000 populations
No. of family welfare centres/1000
populations
Health Index(HI)
Nalhati-I 0.0340 0.0710 0.0070 0.0010 0.0283
Nalhati-II 0.1594 0.0310 0.0040 0.0010 0.0489
Murarai-I 0.0422 0.0830 0.0050 0.0010 0.0328
Murarai-II 0.1678 0.0520 0.0050 0.0010 0.0565
Mayureswar-I 0.1241 0.0310 0.0050 0.0010 0.0403
Mayureswar-II 0.1354 0.1520 0.050 0.0010 0.0484
Rampurhat-I 0.1523 0.3550 0.0340 0.0010 0.1356
Rampurhat-II 0.0854 0.0520 0.0070 0.0010 0.0364
Mohammad Bazar 0.0155 0.0640 0.0070 0.0010 0.0219
Sainthia 0.0187 0.0470 0.0040 0.0010 0.0177
Dubrajpur 0.0241 0.3680 0.0170 0.0010 0.1025
Rajnagar 0.0275 0.0310 0.0040 0.0010 0.0159
Suri-I 0.0634 0.0800 0.0050 0.0010 0.0374
Suri-II 0.2091 0.0310 0.0040 0.0010 0.0613
Khoyrasole 0.0518 0.0370 0.0040 0.0010 0.0235
Bolpur-Sriniketan 0.0634 0.3100 0.0300 0.0010 0.1011
Labhpur 0.0414 0.0640 0.0100 0.0010 0.0291
Nanoor 0.0269 0.0480 0.0070 0.0010 0.0207
Illambazar 0.1591 0.0640 0.0070 0.0010 0.0578
Health Index for all 19 C.D. Blocks of Birbhum District is determined by average the above mentioned four parameters. Health Index= ¼(Health Care Density+ Availability of Beds in Hospitals+ Availability of Doctors+ Family welfare centers).
Combined Health Index determined for different blocks of Birbhum district is very poor. The blocks of Birbhum District can be divided into three categories: -
1. Less developed Blocks: - Blocks with index value below 0.10 are ‘less developed.’ There are Nalhati-I, Nalhati-II, Murarai-I, Murarai-II, Mayureswar-I, Mayureswar-II, Rampurhat-II, Mohammad Bazar, Sainthia, Rajnagar, Suri-I, Suri-II, Khoyrasole, Labhpur, Nanoor, Illambazar.
2. Moderately Developed Blocks: - Blocks with index value between 0.01-0.12 are ‘Moderately Developed Blocks.’ There is Bolpur-Sriniketan, Dubrajpur.
3.Developed Blocks: - Blocks with index value 0.12- are ‘developed.’ Only Rampurhat-I lies in this group.
Educational Attainment Index
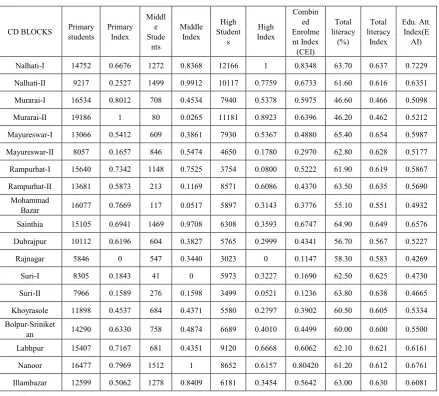
Educational attainment index measures the relative achievement in both adult literacy and combined primary, secondary and tertiary gross enrolment of any region (Handbook of Human Development, 2009). Thus the educational attainment index (EAI) is calculated as
EAI= 2/3 (Total literacy index) + 1/3 (combined enrolment index).(Table.2)
Total Literacy Index: - To prepare the literacy index, actual percentage of different blocks are divided by 100% hypothetically zero is taken as lowest and 100 as the highest possible percentage.
1.Total Literacy Index= Actual percentage/100%
2.Combined Enrolment Index:’ – Enrolment index of each standard (primary, middle and high) are prepared by the formula.
Dimension Index= (Actual value- minimum value) / (maximum value- minimum value).
Combined Enrolment Index (CEI) is an average of this three parameters.
[image:3.595.85.525.355.751.2]CEI= (primary index+middle index+high index)/3
Table 2. Table for Educational Attainment Index
CD BLOCKS Primary students Primary Index Middl
e Stude
nts
Middle Index
High Student
s
High Index
Combin ed Enrolme nt Index
(CEI)
Total literacy
(%)
Total literacy
Index
Edu. Att. Index(E
AI)
Nalhati-I 14752 0.6676 1272 0.8368 12166 1 0.8348 63.70 0.637 0.7229
Nalhati-II 9217 0.2527 1499 0.9912 10117 0.7759 0.6733 61.60 0.616 0.6351
Murarai-I 16534 0.8012 708 0.4534 7940 0.5378 0.5975 46.60 0.466 0.5098
Murarai-II 19186 1 80 0.0265 11181 0.8923 0.6396 46.20 0.462 0.5212
Mayureswar-I 13066 0.5412 609 0.3861 7930 0.5367 0.4880 65.40 0.654 0.5987
Mayureswar-II 8057 0.1657 846 0.5474 4650 0.1780 0.2970 62.80 0.628 0.5177
Rampurhat-I 15640 0.7342 1148 0.7525 3754 0.0800 0.5222 61.90 0.619 0.5867
Rampurhat-II 13681 0.5873 213 0.1169 8571 0.6086 0.4370 63.50 0.635 0.5690
Mohammad
Bazar 16077 0.7669 117 0.0517 5897 0.3143 0.3776 55.10 0.551 0.4932
Sainthia 15105 0.6941 1469 0.9708 6308 0.3593 0.6747 64.90 0.649 0.6576
Dubrajpur 10112 0.6196 604 0.3827 5765 0.2999 0.4341 56.70 0.567 0.5227
Rajnagar 5846 0 547 0.3440 3023 0 0.1147 58.30 0.583 0.4269
Suri-I 8305 0.1843 41 0 5973 0.3227 0.1690 62.50 0.625 0.4730
Suri-II 7966 0.1589 276 0.1598 3499 0.0521 0.1236 63.80 0.638 0.4665
Khoyrasole 11898 0.4537 684 0.4371 5580 0.2797 0.3902 60.50 0.605 0.5334
Bolpur-Sriniket
an 14290 0.6330 758 0.4874 6689 0.4010 0.4499 60.00 0.600 0.5500
Labhpur 15407 0.7167 681 0.4351 9120 0.6668 0.6062 62.10 0.621 0.6161
Nanoor 16477 0.7969 1512 1 8652 0.6157 0.80420 61.20 0.612 0.6761
Illambazar 12599 0.5062 1278 0.8409 6181 0.3454 0.5642 63.00 0.630 0.6081
The Educational Attainment Index of Birbhum district is divided into three categories-
1.Lees Developed Blocks: - Blocks with index value below 0.50 are ‘less developed.’ They are Mohammad bazaar, Rajnagar, Suri-I, Suri-II.
2.Moderately Developed Blocks: - Blocks with index value between 0.50-0.60 are ‘moderately developed.’ They are Murarai-I, Murarai-II, Mayureswar-I, Mayureswar-II, Rampurhat-I, Rampurhat-II, Dubrajpur, Khoyrasole and Bolpur- Sriniketan.
3.Developed Blocks: - Blocks with index value above 0.60 are ‘developed.’ They are Nalhati-I, Nalhati-II, Sainthia, Labhpur, Nanoor and Illambazar.
Standard of Living Index
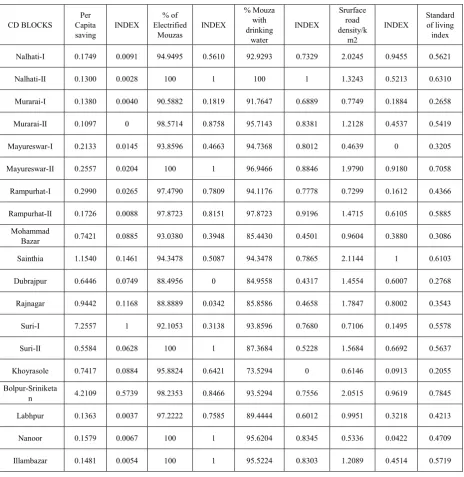
Per Capita Purchasing Power (PPP),computed from the gross domestic product(GDP) are usually taken as the measure of economic attainment of the people. But at block level,such deta is unavailable. So the standard of living is calculated given pareameter.
Standard of living index =(index of per capita saving+index of the percentage of electrified mouzas+index opf surface road density per sq.km.+index of the percentage of mouzas with drinking water)/4.(Table.3)
1. Per capita small savings:- total small saving of each block is divided by its total population to obtain per capita small savings.
Per capita small saving index =( Actual value- minimum
value )/(maximum value-minimum value). 2. Percentage of electrified mouzas:-
Percentage of electrified mouzas = (mouzas electrified/total number of mouzas) × 100
Index= (Actual value –minimum value)/ (maximum value-minimum value).
3. Surface road density:- Road density is calculated by dividing total length of surface roads in each block by the area of that block.
Road density= road length/area
Index= (Actual value-minimum value)/ (maximum value-minimum value).
4. Percentage of mouzas with drinking water:-
Percentage of mouzas with drinking water= (mouzas with drinking water/Total no. of mouzas) × 100
Index = (Actual value- minimum value)/ (maximum value – minimum value).
1.Lees Developed Blocks: - Blocks with index value below 0.50 are ‘less developed.’ They are Murarai-I, Mayursewar-I, Rampurhat-I, Mohammad Bazar, Dubrajpur, Rajnagar, Khoyrasole, Labhpur and Nanoor.
2.Moderately Developed Blocks: - Blocks with index value between 0.50-0.60 are ‘moderately developed.’ They are Nalhati-I, Murarai-II, Rampurhat-II, Suri-I, Suri-II and Illambazar.
Table 3. Table for Standard of Living Index (SLI)
CD BLOCKS Capita Per
saving INDEX
% of Electrified
Mouzas INDEX
% Mouza with drinking
water
INDEX
Srurface road density/k
m2
INDEX Standard of living index
Nalhati-I 0.1749 0.0091 94.9495 0.5610 92.9293 0.7329 2.0245 0.9455 0.5621
Nalhati-II 0.1300 0.0028 100 1 100 1 1.3243 0.5213 0.6310
Murarai-I 0.1380 0.0040 90.5882 0.1819 91.7647 0.6889 0.7749 0.1884 0.2658
Murarai-II 0.1097 0 98.5714 0.8758 95.7143 0.8381 1.2128 0.4537 0.5419
Mayureswar-I 0.2133 0.0145 93.8596 0.4663 94.7368 0.8012 0.4639 0 0.3205
Mayureswar-II 0.2557 0.0204 100 1 96.9466 0.8846 1.9790 0.9180 0.7058
Rampurhat-I 0.2990 0.0265 97.4790 0.7809 94.1176 0.7778 0.7299 0.1612 0.4366
Rampurhat-II 0.1726 0.0088 97.8723 0.8151 97.8723 0.9196 1.4715 0.6105 0.5885
Mohammad
Bazar 0.7421 0.0885 93.0380 0.3948 85.4430 0.4501 0.9604 0.3880 0.3086
Sainthia 1.1540 0.1461 94.3478 0.5087 94.3478 0.7865 2.1144 1 0.6103
Dubrajpur 0.6446 0.0749 88.4956 0 84.9558 0.4317 1.4554 0.6007 0.2768
Rajnagar 0.9442 0.1168 88.8889 0.0342 85.8586 0.4658 1.7847 0.8002 0.3543
Suri-I 7.2557 1 92.1053 0.3138 93.8596 0.7680 0.7106 0.1495 0.5578
Suri-II 0.5584 0.0628 100 1 87.3684 0.5228 1.5684 0.6692 0.5637
Khoyrasole 0.7417 0.0884 95.8824 0.6421 73.5294 0 0.6146 0.0913 0.2055
Bolpur-Sriniketa
n 4.2109 0.5739 98.2353 0.8466 93.5294 0.7556 2.0515 0.9619 0.7845
Labhpur 0.1363 0.0037 97.2222 0.7585 89.4444 0.6012 0.9951 0.3218 0.4213
Nanoor 0.1579 0.0067 100 1 95.6204 0.8345 0.5336 0.0422 0.4709
Illambazar 0.1481 0.0054 100 1 95.5224 0.8303 1.2089 0.4514 0.5719
Human Development Index of Birbhum
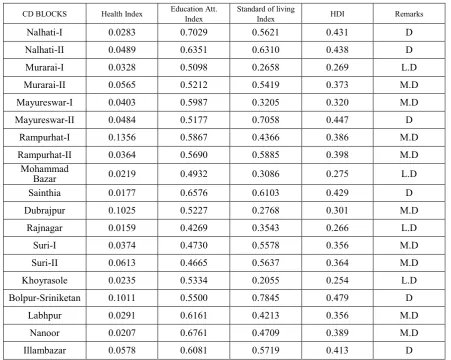
Human Development Index for 19 blocks of Birbhum district calculated by given formula is
[image:6.595.84.536.152.512.2]Human Development Index (HDI) = 1/3 (Health Index+Educational Attainment Index+Standard of Living Index).(Table.4)
Table 4. Table for Human Development Index (HDI)
CD BLOCKS Health Index Education Att. Index Standard of living Index HDI Remarks
Nalhati-I 0.0283 0.7029 0.5621 0.431 D
Nalhati-II 0.0489 0.6351 0.6310 0.438 D
Murarai-I 0.0328 0.5098 0.2658 0.269 L.D
Murarai-II 0.0565 0.5212 0.5419 0.373 M.D
Mayureswar-I 0.0403 0.5987 0.3205 0.320 M.D
Mayureswar-II 0.0484 0.5177 0.7058 0.447 D
Rampurhat-I 0.1356 0.5867 0.4366 0.386 M.D
Rampurhat-II 0.0364 0.5690 0.5885 0.398 M.D
Mohammad
Bazar 0.0219 0.4932 0.3086 0.275 L.D
Sainthia 0.0177 0.6576 0.6103 0.429 D
Dubrajpur 0.1025 0.5227 0.2768 0.301 M.D
Rajnagar 0.0159 0.4269 0.3543 0.266 L.D
Suri-I 0.0374 0.4730 0.5578 0.356 M.D
Suri-II 0.0613 0.4665 0.5637 0.364 M.D
Khoyrasole 0.0235 0.5334 0.2055 0.254 L.D
Bolpur-Sriniketan 0.1011 0.5500 0.7845 0.479 D
Labhpur 0.0291 0.6161 0.4213 0.356 M.D
Nanoor 0.0207 0.6761 0.4709 0.389 M.D
Illambazar 0.0578 0.6081 0.5719 0.413 D
D= Developed, L.D= Less Developed, M.D= Moderately Developed Source: - Computed by the author
4. Discussion
The blocks of Birbhum district can be classified into three categories according to the level of Human Development.
1. Lees Developed Blocks: - blocks with index value below 0.30 considered as ‘less developed.’ There are four blocks in this category. These are Mohammad Bazar, Rajnagar and Khoyrasole. These blocks are backward in all three parameters. Of all blocks Khoyrasole HDI value (0.254) is lowest.
2.Moderately Developed Blocks: - blocks with index value between 0.30-0.40 are considered as ‘mederately developed.’ There are nine blocks in this category. These blocks are Murarai-II, Mayureswar-I, Rampuirhat-I, Rampurhat-II, Dubrajpur, Suri-I, Suri-II, Labhpur and Nanoor. These blocks are stated as moderately developed.
3.Developed Blocks: - Bolcks with index value above 0.40 are considered ‘developed.’ There are six blocks in this
category. These are Nalhati-I, Nalhati-II, Mayureswar-II,
Sainthia, Bolpur-Sriniketan and Illambazar.Bolpur-Sriniketan is the most developed block
with the HDI value of 0.479. Education status and standard of living is very good here in Bolpur-Sriniketan. On the other hand Nalhati-I is very good in educational status.
The study made above show that the Human Development Index of most of the blocks in Birbhum is low. Some district geographical and socio-economic factors are responsible for such low HDI. They are as follows:
1. Most of the blocks suffer from the problem of soil erosion.
2. The agro-climatic conditions of the most blocks are not favourable.
3. Almost all such SC/ST families live below the poverty line.
Suggested measure for increasing in the Human Development Index:
1. Educate the mother of the children.
2. Improve the health consciousness of the people. 3. Giving importance on small and cottage industries. 4. Motivate the people to use scientific method on agriculture and pastrolism.
5. Conclusion
In this article we have tried to calculate the Human Development Index at block level of Birbhum district. Birbhum is one of the 19 district of West Bengal sharing 5.12% of the land area of the state but 3.76% of its total population. Adult literacy plays the most important role here. The HDI values calculated here may contain several sort comings due to non availability of relevant data. Health index of Birbhum is moderately but educational status is good. Rural area of the district standard of living is poor. Block Bolpur-Sriniketan is very good for standard of living.
REFERENCES
[1] Anand, Sudhir and Sen, Amarta (1994) “Human Development Index; methodology and measurement” parr, Fakuda et. AI, Reading in Human Development. Second Edition, 2005. Oxford University Press.
[2] District Human Development Report (Birbhum), 2009 [3] District census handbook, Birbhum 2001.
[4] District statistical handbook, 2009; Bureau of Applied Economics and Statistics, Government of West Bengal. [5] Madhumanjari Chakravorty ‘Status of Human Development
in the district of Murshidabad’, ILEE, vol. 33(2), December, 2010.