Abstract-- One of the disturbances experienced by the power system is increase in loading condition, which often led the system to no longer remains in secure operating region. When the power system is exposed to any kind of time delay and inaccessibility of control scheme, system may become inconsistent leading to uncontrolled condition. Under this condition, the main purpose of the operator is to execute control actions to get the system back into the secure operating regions. Flexible AC transmission system (FACTS) device is one of the devices, which can be inserting to control power system stability improvement. This paper describes the optimal placement and sizing of TCSC using on Particle Swarm Optimization (PSO) method. The objective function for this study is to minimize the transmission loss, increase the voltage profile, while considering the cost of installation. Effect of weight coefficient and effect of population size during the optimization process towards obtaining the solution is also explored. To validate the proposed techniques, simulations are performed on an IEEE 30-bus system.
Index Terms—particle swarm optimization, thyristor controlled series compensator, transmission loss, cost of installation, FACTS device.
I. INTRODUCTION
echanisms of power system operations become more complex due to the increasing load demands which led to increased pressure on the transmission line and high risk of faulted lines [1]. Therefore, the power system operation in a less safe or even loss of stability following the unexpected congestion and voltage violations need to be considered. Additionally, new transmission lines could be considered as one solution to require more stable and secure operations can be practiced by the power systems. However, it is a more expensive and time-consuming which is due to economical, government, and environmental limitations. One of the alternatives to address this challenge is using the Flexible AC Transmission System (FACTS). The IEEE PES Task Force of the FACTS working group clarified FACTS device as an alternating current transmission system combining the power electronic-based and other static controllers to enhance controllability and increased the power transfer capability [2].
Siti Amely Jumaat is with Faculty of Electrical and Electronics Engineering, Universiti Tun Hussein Onn Malaysia, 86400 Parit Raja, Batu Pahat, Johor, Malaysia (e-mail: [email protected]).
Ismail Musirin is with the Faculty of Electrical Engineering, Universiti Teknologi MARA, 40450 Shah Alam, Selangor, Malaysia (e-mail: [email protected]).
The main objectives to apply the FACTS device increase the power transfer potential of transmission system and to keep power flow over designed routes. The advantages of FACTS device have been informed to be increasing system transmission capacity, power flow, control versatility and quickness [5]. It is also determined that its installation has enhanced transmission system management, enlarged dynamic, transient grid stability and empowering environment [6]. FACTS devices require critical advantages for improved transmission system management, increased transmission system reliability and availability, raised dynamic and transient grid and empowering environmental benefits [7].
In this paper, PSO method is proposed to optimize the location and sizing of FACTS device for minimization of the transmission loss in power system. The TCSC is chosen as the device permits the modifications of transmission line reactance. Computer simulations were conducted on the IEEE 30 bus system. The effect of weight coefficient and effect of population size on loss minimization is also investigated.
II. TCSCMODELLINGANDFORMULATION The Thyristor Controlled Series Compensator (TCSC) is a capacitive reactance compensator which consists of a series capacitor bank shunted by a thyristor-controlled reactor in order to provide a smoothly variable series capacitive reactance [2]. The TCSC can be connected in series with the line conductors to compensate for the inductive reactance of the line. Also, it can be operating in capacitive or inductive mode. The reactance of the TCSC (XTCSC) depends on its
compensation ratio (TCSC) and the reactance of the line (XL)
where it is located. The impedance of a line (ZL) connected
with the TCSC is then changed by the value of XTCSC. TCSC
provides capacitive reactance to decrease reactance of the line when rTCSC<0 or it can increase the reactance of the line by
adding inductive reactance if rTCSC>0. The operating range of rTCSC is between -0.7XL and 0.2XL [8].The TCSC is modeled
shown in Figure 1.
Fig. 1. TCSC Model
Siti Amely Jumaat, Ismail Musirin, Muhammad Murtadha Othman, and Hazlie Mokhlis,
Particle Swarm Optimization Techniques for
Optimal Location and Sizing of Thyristor
Controlled Series Capacitor
A. Cost of Installation
The cost of installation of TCSC device has been given by equation (1):
(1) 1000
× ×
= A
TCSC C IC
Where
CTCSC = the cost of TCSC device [US$/KVar]
The installation of TCSC device can be calculated using the cost function given by (2) and (3):
(2) 153.75 0.713
- +
=0.001A2 A TCSC
C
(3) | 1 Q -2 |Q
A=
Where
A = operating range of TCSC in [MVar]
Q1 = reactive power flow through the branch before TCSC installation.
Q2 = reactive power flow through the branch after TCSC installation.
III. PARTICLESWARMOPTIMIZATION
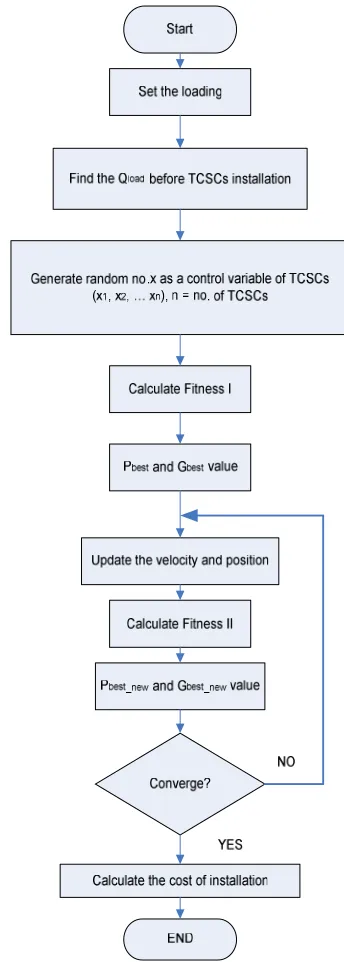
[image:2.612.358.530.75.556.2]Particle Swarm Optimization (PSO) algorithm is advanced by Kennedy and Eberhart in 1995 founded on the social activity of animal swarms (e.g. bird blocks and fish schools) [3] and its deals with problems in which a best answer can be appeared for as a point or surface in the n-dimensional space. PSO denotes a system that is initialized with a population of random results [4]. The PSO provides a populations-based search procedure in which individuals called particle and changes their positions. In PSO, the population is named “swarm” and the individual in the swarm is named “particle." Each particle is represented by its position and velocity and is referred to as a potential solution in n-dimensional search space of the problem. The particle has memory, and every particle keeps track of its earlier best position and the comparable fitness value.
Fig. 2. Flowchart of Particle Swarm Optimization (PSO) algorithm for TCSC parameters.
The earlier best value is titled pbestand it is combined to a specific particle. Gbestis the best value of all the particles’ pbests in the swarm. Velocity of each particle can be modified by (4) [4, 10, 12]:
( )
4 )( 2 2
) (
1 1
1
k i s i best G rand c
k i s i best P rand c
v w k i v
− ×
× +
− ×
where
vik+1 : velocity of particle i at iterations. w : weight function.
c1 andc2 : weight coefficient
rand1 and rand2 : random number between 0 and 1 si k : current position of particle i at iteration k. Pbest : best position of particle i th up to the current
iteration
Gbest : best overall position found by the particles up to the current iteration.
Weight function is given by (5) [6, 9, 10, 14]:
. (5) max
min max
max iter iter
w w
w
w ×
− −
=
where
w max : maximum weight equal to 0.9
wmin : minimum weight equal to 0.4 itermax : maximum iteration number, and
iter : current iteration number The new position can be modified (6)
. (6) 1 k i v k i s 1 k i
s + = + +
The first benefit of swarm intelligence techniques is that they are excellently resistant to the local optimal problem. Additionally, PSO is employed usually because it is ordinary in concept, it is easy to implement; it is dominant, and it is a flexible mechanism to enhance global and local exploration abilities. From [13], the principal merits of PSO are ease in concept implementation, computationally efficient, and validity to control parameters. Figure 2 illustrates the flow chart for PSO algorithm in implementing TCSC installation.
IV. RESULTSANDDISCUSSION
In order to verify its feasibility, the PSO is applied to optimal placement and sizing of TCSC on the IEEE-30 bus system. The busdata and the linedata of the IEEE-30-bus system are given in [6]. The parameters of the optimization algorithms for this research are listed in Table I.
A. Transmission Loss Minimization using TCSC Installation Result for transmission loss minimization at buses 26, and 29 are tabulated in Table II and III. The results for the location and sizing of TCSC to achieve the loss minimization at several loading conditions can be referred to the same table. For example, at loading condition is 20MVar the transmission loss has been decreased from 20.3393MW to 19.8915MW.
TABLEI
PARAMETEROFOPTIMIZATIONSTECHNIQUE USINGPARTICLESWARMOPTIMIZATION
(PSO)
Parameters Value
Population Size 10,20,30,50 Inertial Weight, w 0.4 and 0.9 Weight coefficient, c1 =c2 1, 2, 3
Number of iteration 50
Rand 1 0 to 1
Rand 2 0 to 1
In order to get this, the location of TCSC is line 35 and the sizing of TCSC is -0.5474p.u. The cost of installation at this scenario is US$330,590. From the Table II it is observed that the value of transmission losses decreased and the cost of installation increased accordingly as the reactive power loading is increased. Figure 3 illustrates the voltage profile at bus 26 when the load at this bus is gradually increased.
TABLEII
TRANSMISSIONLOSSMINIMIZATIONLOADVARIATIONATBUS26 Loading
Cond. Qd26 (MVar)
Loss (MW) TCSC location
TCSC sizing
I_C (US$) without
TCSC
with TCSC
5 17.7175 17.6098 2 -0.0385
407,410 10 18.2785 18.0485 2 -0.0277
516,480 15 19.0625 18.8599 34 -0.4192
242,420 20 20.3393 19.8915 35 -0.5474
330,590 25 22.6325 21.2691 34 -0.3053
794,300 30 26.5184 22.6478 34 -0.4584
[image:3.612.346.531.48.135.2]2,057,400
[image:3.612.297.568.138.590.2]power loading is raised. Figure 4 illustrates the voltage profile at bus 29 when the load at this bus is gradually increased.
TABLEIII
TRANSMISSIONLOSSMINIMIZATIONLOADVARIATIONATBUS 29
Loading Cond.
Q29 (MVar)
Loss (MW) TCSC location
TCSC
sizing I_C (US$) without
TCSC
with TCSC
5 17.7284 17.6253 2 -0.3300
345,810 10 18.1682 17.9937 13 -0.1835
257,510 15 18.6839 18.5098 36 -0.3224
456,800 20 19.4699 19.0105 36 -0.3445
686,310 25 20.8433 19.8095 36 -0.3638
1,065,200 30 22.7158 20.6413 36 -0.3912
[image:4.612.338.540.48.97.2]1,706,900
Fig. 4. Results for Voltage Profile Improvement Load variation at Bus 29 B. Effect of weight coefficient, c1=c2
The results for effect of weight coefficient, c1 and c2 to
transmission loss minimization are tabulated in Table IV and V. In this case the value for c1 and c2 are adjusted between 1
[image:4.612.47.304.141.486.2]and 3.
TABLE IV
RESULTS FOR THE EFFECT OF WEIGHT COEFFICIENT PERFORMED LOAD VARIATION AT
BUS 26
Weight Coefficient
(c1 and c2)
Transmission Loss for several Loading Conditions at Bus 26 Qd26=10
(MVar)
Qd26=20 (MVar)
Qd26=30 (MVar)
1 18.0947 19.8922 22.6369
2 18.0419 19.5888 22.9680
3 18.0485 19.8915 22.6478
Table IV tabulates the effect of c1 and c2 to transmission losses
when loading variation is subjected to bus 26. From the table, it is studied that the transmission loss raised consequently as the reactive power loading is increased. Large value of c1 and
c2 gives the lowest transmission loss minimization in the
system, and vice versa. For example, at Qd26=20MVar with
[image:4.612.341.534.287.432.2]installation of TCSC, the losses value is 19.8922MW when the weight coefficient =1, while the transmission losses value is 19.5888MW when weight coefficient = 2. This indicates that higher value of the weight coefficients leads to better appearance. The same scenarios can also be practical at different loading conditions, From the results it is found that the large value of the weight coefficients has a relevant impact in completing process using the PSO method.
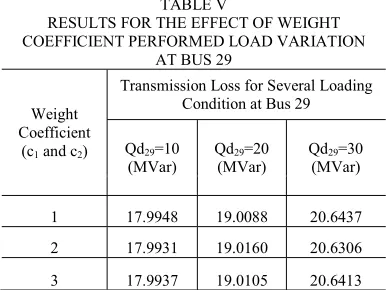
TABLE V
RESULTS FOR THE EFFECT OF WEIGHT COEFFICIENT PERFORMED LOAD VARIATION
AT BUS 29
Weight Coefficient
(c1 and c2)
Transmission Loss for Several Loading Condition at Bus 29 Qd29=10
(MVar)
Qd29=20 (MVar)
Qd29=30 (MVar) 1 17.9948 19.0088 20.6437 2 17.9931 19.0160 20.6306 3 17.9937 19.0105 20.6413
The effect of weight coefficient to transmission loss minimization to bus 29 is tabulated in Table V. Similar phenomenon is observed as those for bus 26. For instance, at Qd29 = 30MVar with installation of TCSC, the losses value is
20.6437MW when the weight coefficient is 1, while the transmission losses value is 20.6306MW when the weight coefficient is 2.
C. Effect of population size
The results of effect of population size to transmission loss minimization are tabulated in Table VI and VII. Table VI tabulated the impact of population size to transmission loss when the reactive power loading variation is subjected to bus 26. From the table, it is studied that the transmission loss raised therefore as the reactive power loading is increased. Large population size gives the lowest transmission loss minimization in the power system, and vice versa. For instance, at Qd26 =10MVar with installation of TCSC, the
[image:4.612.75.275.638.739.2]impact in presenting optimization process using the PSO method.
TABLE VI
RESULTS FOR THE EFFECT OF SIZE PERFORMED LOAD VARIATION AT BUS 26
Population Size
Transmission Loss Value at Bus-26 for several Loading Condition Qd26=10
(MVar)
Qd26=20 (MVar)
Qd26=30 (MVar) 10 18.0566 19.8499 23.6266 20 18.0485 19.8915 22.6478 30 18.0406 19.4515 23.1217 50 18.0348 19.8083 22.0547
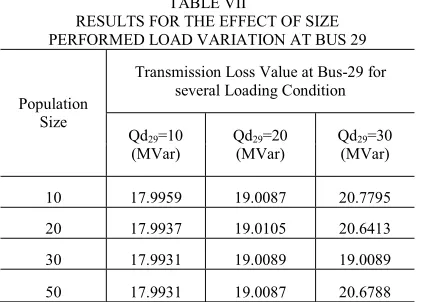
The effect of population size to transmission loss minimization to bus 29 is listed in Table VII. For example, at Qd29 = 20MVar with installation of TCSC the losses value is
19.0089MW for population size of 30, Besides that, with installation of TCSC the losses value is 19.0087MW and the population size is increased to 50. As of the table, it is determined that the optimal transmission loss can be seen as the population size of 50. Table VI and VII: 50 is population size as the mainly suitable to perform the best performance in transmission loss minimization optimized using PSO.
TABLE VII
RESULTS FOR THE EFFECT OF SIZE PERFORMED LOAD VARIATION AT BUS 29
Population Size
Transmission Loss Value at Bus-29 for several Loading Condition Qd29=10
(MVar)
Qd29=20 (MVar)
Qd29=30 (MVar) 10 17.9959 19.0087 20.7795 20 17.9937 19.0105 20.6413 30 17.9931 19.0089 19.0089 50 17.9931 19.0087 20.6788
V. CONCLUSION
In this paper, the PSO approach is effectively and successfully implemented to choose optimal location and sizing of TCSC to minimize the transmission loss, increase the voltage profile and calculate the cost of installation. Tests are presented on the IEEE 30-bus system. Results shows that the implementations of PSO have reduce the transmission loss and increase the voltage profile of the system. For the future work, other technique such as Evolutionary Programming (EP), Artificial Immune System (AIS), and Evolutionary-PSO (EPSO) can be included together to complete the similar mission.
VI. REFERENCES
[1] G.I.Rashed, H.I.Shaheen, X.Z. Duan, S.J.Cheng, “Evolutionary Optimization Technique for Optimal Location and Parameter Setting of TCSC under Single Line Contingency”, Applied Mathematics and Computation 205 (2008), pp 133-147.
[2] Narain G. Hingori, Laszlo Gyugy, “Understanding FACTS Concepts and Technology of Flexible AC Transmission Systems, IEEE Press, 2000.
[3] K. Y. Lee and F.F. Yang, “Optimal Reactive Power Planning using Evolutionary Algorithms: A Comparative Study for Evolutionary Programming, Evolutionary Strategy, Genetic Algorithm, and Linear Programming”, IEEE Transactions on Power System, Vol. 13, No. 1, 1998, pp. 101-108.
[4] Y.H.Song, and A.T.John, “Flexible Transmission System (FACTS)”,
IEE Power and Energy Series 30, 1999.
[5] Saravanan. M, Slochanal. S.M.R, Venkatesh. P, Abraham, P.S, “Applications of PSO Technique for Optimal Location of FACTS Devices Considering System Loadability and Cost of Installation,” in Proc 2005 7th International Power Engineering Conference (IPEC). Pp.716 - 721 Vol. 2 2005
[6] Phashant Kumar Towari, and Tog Raj Sood, “Optimal Location of FACTS Devices in Power System Using Genetic Algorithm,” in Proc.
IEEE World Congress on Nature and Biologically Inspired Computing (NaBIC 2009), 2009.
[7] P. Pezzini, O.G. Bellmunt, and A. S. Andrue, “Optimization Techniques to improve energy efficiency in power system,” InternationalJournal Renewable and Sustainable Energy 2011, 2028-2041.
[8] S. Auchariyamet, and S.Sirismrannukul, “Optimal Reactive Power Planning with FACTS Devices by Particle Swarm Optimization”, In Proc. 8th International conference on Advances in Power System
Control, Operation and Management (APSCOM 2009), 2009, pp. 1 – 6. 2009.
[9] Saravanan. M, Slochanal. S.M.R, Venkatesh. P, Abraham, P.S, “Applications of PSO Technique for Optimal Location of FACTS Devices Considering System Load ability and Cost of Installation,” in Proc 2005 7th International Power Engineering Conference (IPEC). Pp. 716 - 721 Vol. 2 2005
[10]G.I.Rashed, H.I.Shaheen, S.J.Cheng, “Optimal Locations and Parameters Settings of Multiple TSCSs for Increasing Power System Loadability Based on GA and PSO techniques, in Proc 2007 Third IEEE International Conference on Natural Computation (ICNC 2007), 2007. [11]M.R. AlRashid, M.E. El-Hawary, “Applications of computational
intelligence techniques for solving the revived optimal power flow problem”, Electric Power Systems Research 79(2009) 694-702. [12]Sundareswaran. K, Hariharan. B, Parasseri. F.P, Antony. D.S, and
Subair, B, “Optimal Placement of Static Var Compensators (SVC’s) Using Particle Swarm Optimization,” in Proc 2010, International Conference on Power, Control and Embedded Systems (ICPCES), 2010, pp. 1 – 4, 2010.
[13]S. Auchariyamet, and S.Sirismrannukul, “Optimal Reactive Power Planning with FACTS Devices by Particle Swarm Optimization”, In Proc. 8th International conference on Advances in Power System
Control, Operation and Management (APSCOM 2009), 2009, pp. 1 – 6. 2009
[14]Nor Rul Hasma Abdullah, Ismail Musirin, Muhammad Murtadha Othman, “Static VAR Compensator for Minimizing Transmission Loss and Installation Cost Calculation,” Australian Journal of Basic and Applied Sciences, 4(4): 646-657, 2010.
VII. BIOGRAPHIES
[image:5.612.66.277.376.527.2]Associate Professor Dr. Ismail Musirin obtained Diploma of Electrical Power Engineering in 1987, Bachelor of Electrical Engineering (Hons) in 1990; both from Universiti Teknologi Malaysia, MSc in Pulsed Power Technology in 1992 from University of Strathclyde, United Kingdom and PhD in Electrical Engineering from Universiti Teknologi MARA, Malaysia in 2004. His research interest includes power system stability, optimization techniques, distributed generator and artificial intelligence. He is also a member of IEEE, IEEE Power Engineering Society and Artificial Immune System Society (ARTIST).
Dr. Muhammad Murtadha bin Othman received his B.Eng. (Hons) from Staffordshire University, England in 1998; M.Sc from Universiti Putra Malaysia in 2000 and PhD from Universiti Kebangsaan Malaysia in 2006. He currently lectures at the Universiti Teknologi MARA, Malaysia. His area of research interests are artificial intelligence, transfer capability assessment and reliability studies in deregulated power system.