Twitter sentiment analysis: The case of mobile network outage
16th November 2012
Christopher Hackett, Aleksej Heinze and Gordon Fletcher
INTRODUCTION
This study conducted by FastWebMedia and Salford Business School looks at how the sentiment of tweets for UK mobile phone operators changed during and after a business critical technology failure. In July 2012 O2
experienced an extensive mobile network outage affecting a significant proportion of customers (The
Guardian, www.guardian.co.uk/business/2012/oct/13/o2-mobile-service-outage - accessed on 13 November
2012).
KEY FINDINGS
● Competitor analysis from the Twitter platform allows unique fast insight into the perceptions of a
brand and its competitors.
● Vocal customers using Twitter is the generalised voice of customers. This is particularly the case in
industries where high Twitter adoption is already evident - for example in mobile
telecommunications.
● Organisations should not dismiss vocal complaints or frustrated customers as ‘one offs’ that are not
representative of overall customer opinion.
● Both extreme and general views derived from tweets offer a reliable insight into prevailing customer
opinion.
● Users directing tweets at a specific Twitter account will continue to express strong views for a longer
period of time than those who are merely mentioning the brand. This can produce misleading perspectives on the overall public opinion about a brand after a significant event.
● The window of opportunity available for an organisation to formulate a response to negative events
is small and should be measured in hours rather than days.
● The principle that “there is no such thing as bad publicity” can work positively for small scale
incidents if they are managed well and recovered quickly.
METHODOLOGY
We used the Twitter search API to retrieve tweets containing specific operator names over the previous 6 days.Taking into account market share and operators’ official presence on Twitter we compared 4 mobile
phone brands; O2, Orange, T-Mobile & Vodafone.
For each tweet we captured the visible text, the search term used and the date the tweet was sent. The API permits 1500 tweets to be retrieved per search request and no private tweets will be returned. A further
consideration is that the data returned from the API is not guaranteed to be an exhaustive result list of the
query but what Twitter algorithmically considers the most relevant.
We captured tweets based on 3 types of search terms or keywords:
Brand – Only the brand was used to search for tweets
Brand with mobile – The brand name and the word ‘mobile’ was searched for in tweets
Once retrieved each tweet was scored on a scale from -2 to 2 by the number of occurrences of positive and
negative English words. These scores were then aggregated into two overall ratios which took into account all
non-neutral tweets (general views) and only those which scored >= 2 or <= -2. These latter scores represent extremely positive and extremely negative opinion respectively.
KEY DATES
To have a useful interpretation of the data it is important to consider the timeline of events surrounding the
incident.
11th July (AM) Normal Service
(PM) Issue begins 12th July (AM) Issue is on-going
(PM) Fully resolved
13th July Normal Service - The official response from @o2 goes viral 14th July Normal Service
15th July Normal Service
ANALYSIS
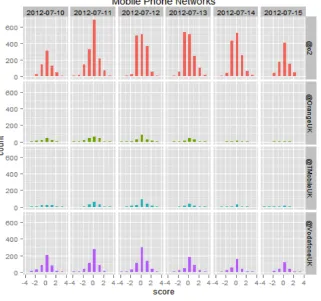
Before starting our investigation we first looked at the overall presence that O2 has through the Twitter network (Figure 1). The official UK account has by far the most followers of any UK mobile operator included
in this study. We also observed that the day before the network incident, which represents an index of
‘normal’ activity, more Twitter users mention the account @o2 than other networks (Figure 2). From this we can infer that O2 has a significant presence and activity on Twitter.
Account Followers Tweets
@o2 116,088 97,185
@VodafoneUK 50,292 132,664
@TMobileUK 13,391 3,859
@OrangeUK 8,436 8,436
Figure 1: Official mobile network twitter accounts
DATA - OFFICIAL TWITTER PRESENCE
On the first day of the outage - 11th July 2012 there was a significant increase in direct tweets with negative
sentiment mentioning the o2 brand (Figure 2 second column and first row). For direct mentions to the @o2
account this negative sentiment is sustained for a further three days until after the 14th July. A more rapid decrease is observed in the negative mentions for the terms ‘o2’ and ‘o2 mobile’. Four days after the start of
the incident the overall profile of o2 on the social network had returned to the levels previously observed
mirroring of increased activity among competing brands presents a range of possible explanation with the
most likely being that customers of unaffected networks were seeking confirmation of their own continued
service integrity as a response to popular media reporting of the O2 situation.
This suggests that the window of opportunity that is available to an organisation to respond to negative news
and incidents is narrow. A circumstance that necessitates those with responsibility for the social media activities of an organisation to have both the tools to monitor their presence on social media platforms and
the flexibility and authority to produce an appropriate response - including the potential option of producing
no public statement.
There is a further observation that allies but follows the narrow window of opportunity presented to a brand.
Comparing the neutral mentions of o2 before and after the incident to other competitors shows the overall number of neutral mentions for o2 has increased by nearly 100 mentions per day. At the same time
-post-incident - the number of mentions for competitors has decreased. This suggests that the cliche, “there is
no such thing as bad publicity” remains true at least for smaller scale incidents if these are managed and
recovered quickly. Observations over this short period suggests that o2 benefited from the incident by ultimately gaining a greater volume of neutral voice at the conclusion of the incident period. Further
confirmation of this observation will highlight the importance for brands to have incident recovery plans that
include addressing online communities such as Twitter in order to build their ‘official’ presence.
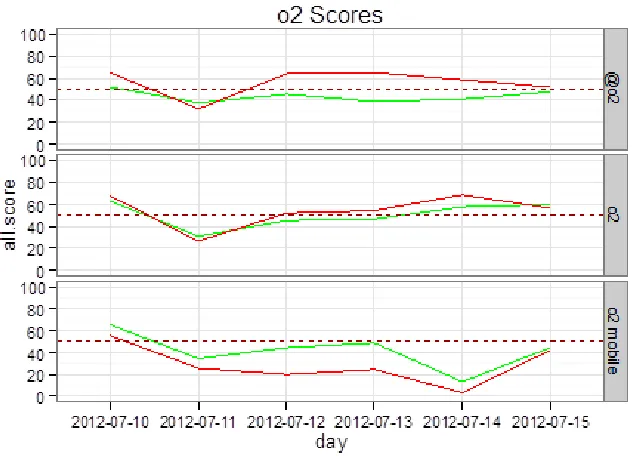
Overall sentiment scores (Figure 3) shows that despite separating the overall brand scores into normal views
(any non-neutral tweet sentiment score) and extreme only views (tweet sentiment score >=2 or <=-2) these both typically follow the same overall trend. This indicates vocal users as reliable sources of insight into overall
popular sentiment towards a brand. An attitude of dismissing complaints by the loudest angry or frustrated
[image:3.595.85.406.459.760.2]customers as ‘one offs’ may therefore ultimately prove to be counterproductive.
neutrality, -2 represents extremely negative and 2 represents extremely positive.
[image:4.595.83.400.108.337.2]–––– ‘Normal’ views (any non-neutral tweet sentiment score) –––– Extreme only views (tweet sentiment score >=2 or <=-2)
Figure 3: Extreme and ‘normal’ sentiment scores for O2
NARROW VS BROAD SENTIMENT ANALYSIS
To this point we have focused on the main indicators that best demonstrate the shifting sentiments of a brand
during a critical incident - in this case tweets directed to the official Twitter presence of each brand.
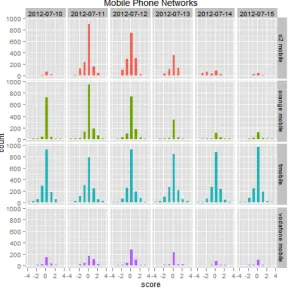
Examination and analysis of a wider range of related search terms proved to add only minor benefit to the analysis (Figure 4). The pattern of events that can be identified generally echo that offered by the brand itself.
Only two differences between the official Twitter presence and keyword analysis can be identified. The
volume of search is higher when examining the keywords but this use of keywords appears to introduce a
range of other circumstances and noise to the analysis. For example, the volume and consistently high level of activity around TMobile and the high entry activity for Orange cannot be explained solely in the context of
the O2 outage incident. These additional factors may well be significant for a sustained and longer term
analysis and understanding of a brand but this itself precludes formulating an incident response. Broad keyword analysis in the ‘brand + mobile’ example also fails to reveal the comparative post-incident shift in
Figure 4: Data for six days for four brands searched by “brand + mobile” keyword
DATA (BRAND)
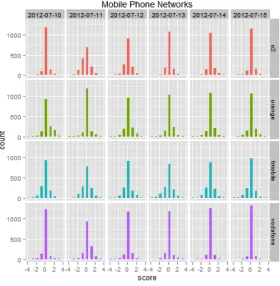
Figure 5 shows brand keywords and shows that overall there are smaller variations in sentiment compared to
direct mentions. Nevertheless, we can identify a shift from negative/neutral to neutral/positive over 4 days. It
is also worth noting that even networks that have fewer followers such as Orange and T-Mobile have approximately 1000 messages suggesting that each brand’s active online communities are almost equal in
Figure 5: Data for six days for four brands based on “brand” keyword
CONTACT INFORMATION
FAST WEB MEDIA LTD
Joana Ferreira
Digital Marketing Executive
[email protected] +44 (0) 845 07 39393
4th Floor Digital World Centre
Media City Salford Quays
Manchester
M50 3UB
www.fastwebmedia.com
ACKNOWLEDGEMENT