International Journal of Emerging Technology and Advanced Engineering
Website: www.ijetae.com (ISSN 2250-2459, ISO 9001:2008 Certified Journal, Volume 6, Issue 11, November 2016)
114
A Review on Process Capability Indices Used For Prediction of
Process Control and Quality to Improve Rate of Productivity
Sachin B. Patil
1, Dr. Bhimlesh Kumar
2,
Dr. Rahul Lodha
31Research Scholar, 3Professor, Mewar University, Chittorgarh, Rajasthan, India. 2Professor, J. T. Mahajan C. O. E. Faizpur, Jalgaon, Maharashtra, India.
Abstract--Achievement in the worldwide market relies on upon quality. Organizations that deliver great reliably will succeed; the individuals who don't will at last fall flat.
The process engineers does the employment reasonable for enhancements in processes. Presently a days, it is required to keep up any assembling process inside specific limits. The variation in process will brings about failure of rate of production which specifically impacts on cost connected with manufacturing. The failure of process will straight forwardly or by implication impacts on budgetary development of organization.
The process failure will likewise bring about failure of material with planned measurements, additionally support is one of the issue conveyed with hardware. Hence it is required to keep up the process inside certain specifying limits. This can be accomplished by process capacity indices.
The present paper shows the basic statistical tools used to improve the process capability indices and to improve the quality of products.
Keywords-- Quality, Manufacturing Process, Process Capability Indices, Specification Limits, statistical Tools, etc.
I. INTRODUCTION
A)Problem Identification
Prior to the entry of large scale manufacturing, skilled workers dealt with each part of their items. They planned a thing, delivered its parts, and collected them. They by and by promoted their items and managed specifically with their clients. [1]
In the event that an issue came up, the skilled worker could modify the product to keep its repeat or lose those clients who were unhappy with it. They needed to adjust the cost of production, the simplicity of resulting operations, and client guidelines as they saw fit. Subsequently, they had a decent comprehension of the overall picture. [2]
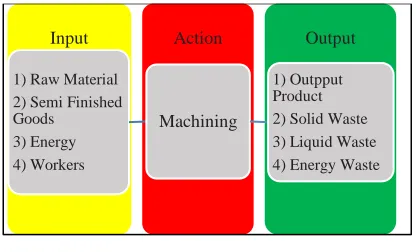
The vast majority think about a procedure as a machine or assignment, however it is more complexion than that. A process is the whole arrangement of machines, crude materials, individuals, methodology, environment, and estimations, used to make a product. Figure 1 shows this idea. [3]
We can characterize a process to suit your requirements. In the event that your advantage is the creation of plastic containers, you can characterize the procedure as the basin, machine and the plastic. On the other hand you can extend the definition to incorporate all production in the plant and outside elements that effect plant operations. [4]
A process has information sources, activities, and yields. Every info has a source or provider and every yield has a client or a client. [5]
[image:1.612.342.550.344.470.2]
Figure 1 Block Diagram of Process
A process is helpless before its information sources. In the event that the info changes, the change reflected in the yield. The most widely recognized approach to manage this is to change certain contributions to make up for undesirable changes in others. Be that as it may, since every variable can shift extraordinarily, this technique is tedious and costly. [6]
B)Statistical Process Control
It is difficult to investigate or test quality into an product; the product should be assembled right the first run through. This infers the manufacturing process must be steady and that all people required with the procedure (counting administrators, engineers, quality-affirmation work force, and administration) should persistently look to enhance prepare execution and lessen changeability in key parameters. On-line statistical process control (SPC) is an essential apparatus for accomplishing this goal. Control charts are the least difficult kind of on-line statistical process-control technique.
Output Action
Input
1) Raw Material
2) Semi Finished Goods
3) Energy 4) Workers
Machining
International Journal of Emerging Technology and Advanced Engineering
Website: www.ijetae.com (ISSN 2250-2459, ISO 9001:2008 Certified Journal, Volume 6, Issue 11, November 2016)
115
The fundamental SPC systems, focusing basically on the kind of control graph proposed by Walter A. Shewhart and called the Shewhart control graph. [5]C) Statistical Quality Control
There are two general parts of wellness for utilize: quality of design and quality of conformance. All products and ventures are delivered in different evaluations or levels of quality. These varieties in evaluations or levels of quality are deliberate, and, subsequently, the suitable specialized term is nature of plan. For instance, all vehicles have as their fundamental goal giving safe transportation to the purchaser. Be that as it may, cars contrast as for size, arrangements, appearance, and execution. These distinctions are the aftereffect of deliberate plan contrasts among the sorts of cars. These plan contrasts incorporate the sorts of materials utilized as a part of development, particulars on the segments, dependability acquired through designing improvement of motors and drive trains, and different adornments or hardware.
The quality of conformance is the means by which well the product fits in with the particulars required by the plan. Quality of conformance is impacted by various components, including the decision of manufacturing process, the training and supervision of the workforce, the sorts of process controls, tests, and examination exercises that are utilized, the degree to which these systems are taken after, and the inspiration of the workforce to accomplish quality. [4, 5]
Tragically, this definition has gotten to be related more with the conformance part of quality than with design. This is partially because of the absence of formal instruction most architects and designers get in quality building strategy. This likewise prompts to a great deal less concentrate on the client and all the more a "conformance-to-details" way to deal with quality, paying little heed to whether the item, notwithstanding when delivered to measures, was really "fit-foruse" by the client. Additionally, there is still a far reaching conviction that quality is an issue that can be managed exclusively in manufacturing, or that the main way quality can be enhanced is by "gold-plating" the product. [7]
II. LITERATURE REVIEW
The proposed Six-Sigma is a change methodology for accomplishing consumer loyalty by decreasing variety and in this manner creating items and administrations better, quicker and less expensive. He shows a Six-Sigma venture of a car plant delineating how the DMAIC procedure and factual methods were connected to determine the issue of assembling procedure capacity.
This venture has considerably profited the association by lessening the variety of bore size of wrench case, accomplishing zero dismissal and enhancing the on time conveyance. By utilizing proper subjective and quantitative instruments in various periods of the DMAIC procedure, the basic yield, key process sources of info and main drivers were distinguished, investigated and approved. This venture technique can be utilized as a part of general to diminish handle variety for whatever other assembling forms also, which will help in enhancing consumer loyalty. [1]
This paper will bear some significance with scholarly specialists and commonsense directors. It portrays the support and choice of the venture, how the devices and strategies of DMAIC strategy were utilized in the diverse stages and how the change activities were actualized. This venture procedure can be utilized to explain any procedure issue bringing about enhancing business comes about lastly enhance consumer loyalty. Be that as it may, individuals can alter the point by point substance and devices as per the hierarchical condition, choice of factors for examination and accessibility of information. [1, 2]
Process Capability can be assessed through the calculations of different process capability proportions and files. The fundamental three ability records usually utilized as a part of assembling enterprises are Cp, Cpk, Cpm and Cpmk. Prepare capacity files are planned to give single number appraisal of the capacity of a process to meet particular specific limits on quality attributes of intrigue. Along these lines, it recognizes the open doors for enhancing quality and efficiency. The level of noteworthiness on process capacity investigation has been expanded impressively over a decade ago, however the writing discoveries uncover the significance of comprehension the ideas, approaches and basic presumptions while its usage in manufacturing process. The target of this paper is to lead process capability examination for exhausting operation by comprehension the ideas, systems and making basic suppositions. [2]
International Journal of Emerging Technology and Advanced Engineering
Website: www.ijetae.com (ISSN 2250-2459, ISO 9001:2008 Certified Journal, Volume 6, Issue 11, November 2016)
116
Handle limit list, sigma levels, absconds per million open doors (DPMO) assurance in the measure stage utilizing a Histogram.Amid Analyze stage, Cause and Effect chart are set up to decide their probability for the main driver of aluminum expulsion imperfect items. The recommended arrangements are introduced in the enhance stage. In the Control stage, all instruments are connected in the Measure stage are rehashed to decide the change level. [3]
The process and machine capability lists were measured to decide the process and machine adequacy for modern application. As far as possible were acquired from the given ostensible size of the shaft, utilizing the essential basic hole system and 90 test shafts were turned on the machine to particular for differing axle speed and feed rate of the machine. Three (3) tests were haphazardly chosen for the turning procedure of a blend of the axle speed and feed rate as a subgroup estimate for an aggregate subgroup of thirty (30). The distances across (speaking to the quality attributes) were utilized to produce control outlines and process capability histogram for the process. The process is inside statistical control yet discovered unequipped for getting together to particular on the grounds that the capacity index (Cp) measured was under 1 and the machine ability for mechanical application is not sufficient. [4]
An estimation control frameworks guarantees that measuring gear and estimation procedures are fit for their proposed utilize and it’s imperative in accomplishing items quality goal. Handle capacity files are expected to give a solitary number appraisal of the consistency of an assembling procedure in respect to the building detail restrains on quality attributes.
In this paper, an endeavor has been made to highlight the approach of factual resilience breaking points and its appropriateness for evaluating the procedure ability. A contextual investigation directed at Kiran Machine Tool Jalgaon. The control valve chamber head OP-20 influenced by different cutting parameters, for example, speed of machine; encourage rate and profundity of cut and so forth. The procedure for typical conditions are in measurable control yet there is a degree for streamlining of process expenses by enhancing the, ability files (about equivalent to 1.67). As process ability lists enhance, it gives the immediate impact on the generation rate and less scrap. Improvement of Process Costs through Process Capability Measurement. Handle Capability estimation is an indivisible part for the accomplishment of an association. [5]
III. STATISTICAL PROCESS CONTROL TECHNIQUES
Statistical process control does not claim to take care of every last issue whether specialized or not but rather it does give and understanding and a heading with which the greater part of the issues can be comprehended. It gives an alternate edge to see the issue and subsequently proposes an answer. There are number of systems which recognize puts in the process where capacity studies are required. There are number of apparatuses for comprehension statistical process control out of them the most helpful fundamental components in Statistical Process Control are explained below:
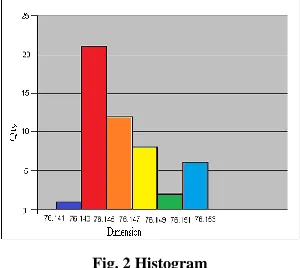
3.1 Histogram
[image:3.612.369.519.374.508.2]This is graphical representation of information table. In this chart the sides of the section speak to the upper and lower cell limits and statures are relative to the frequencies of events inside the cells. In drawing a histogram it is accepted that the recurrence is focused at the mid estimation of class or cell. [8]
Fig. 2 Histogram
Administrators without a comprehension of variety and its inescapability are in an unfavorable position to viably deal with the procedure around them. Gathering information on procedures and sorting out the information suitably are initial phases in conveying acknowledgment to the nearness and kind of variety. It's a straightforward and helpful device for graphically speaking to variety in a given arrangement of information is Histogram.
3.2 Standard Deviation
International Journal of Emerging Technology and Advanced Engineering
Website: www.ijetae.com (ISSN 2250-2459, ISO 9001:2008 Certified Journal, Volume 6, Issue 11, November 2016)
117
3.3 Control ChartsControl chart is one important aid or statistical device used for the study and control of the repetitive process. Dr. W. A. Shewhart developed a control chart and it is based up on the fact that variability does exist in all the repetitive process. A control chart is a statistical tool used to distinguish between variation in a process resulting from common causes and variation resulting from special causes. It presents a graphic display of process stability or instability over time. Every process has variation. Some variation may be the result of causes, which are not normally present in the process. This could be special cause variation. Some variation is simply the result of numerous, ever-present differences in the process. This is common cause variation. Control charts differentiate between these two types of variation.
One objective of utilizing a control chart is to accomplish and keep up process dependability. Handle solidness is characterized as a state in which a process has shown a specific level of consistency in the past and anticipated that would keep on doing so later on. This consistency is portrayed by a flood of information falling inside control limits in view of give or take 3 standard deviations (3 sigma) of the centerline.
3.3.1Type of Control Charts
1) Variable Chart: For quality attributes, which can be spoken to by factor, is in numbers like statures, weights, and temperature. etc. In this type of data are required of
variable type e.g.
X
-chart and R-chart.2)
X
-Chart:X
chart shows the centering of the process,i.e. it shows the variations in the average of sample.
X
-charts denote the average values of variable. The normal qualities have a tendency to be the control estimation about which most of alternate estimations are assembled. In the event that the example of variety is typical.3) R-Chart: R-Chart demonstrates the consistency or consistency of the procedure. It demonstrates varieties in the scope of tests. Run gives the contrasts amongst most extreme and least values inside every example.
4) C-Chart: The c-charts are also known as the control charts for defects per unit. Hypothetically these graphs are utilized as a part of circumstances where the open doors for imperfections to happen in a thing are substantial. At the end of the day, these graphs are utilized to control the quantity of deformity in the thing. The c-graphs depends on the Poisson dissemination. The Poisson conveyance is normally used to portray the quantity of landings per era.
5) U-Chart: At the point when the unit of control is not steady starting with one control then onto the next, the quantity of blemished item see amid various checks can't be looked at. At the point when the unit of control is not steady, we utilize this control graph for the quantity of imperfections.
6) P-Chart: p chart measures the proportion of defective product in a batch, lot or shipment of product. The p chart is also called the fraction defective chart. [9]
IV. STATISTICAL QUALITY CONTROL TECHNIQUES
Like process control strategies there are some measurable quality control systems. This will supportive to introduce the procedure is in control and assembling same nature of merchandise. The quality measures how the procedure can fabricate same number of items inside certain predetermined breaking point. A decent quality proposes the better the control on process. The different Quality Techniques are clarified roars:
4.1 Stem And Leaf Plot
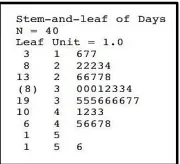
[image:4.612.400.490.570.652.2]Suppose that the data are represented by x1, x2, xn and that each number xi consists of at least two digits. To construct a stem-and-leaf plot, we divide each number xi into two parts: a stem, consisting of one or more of the leading digits; and a leaf, consisting of the remaining digits. For example, if the data consist of percent defective information between 0 and 100 on lots of semiconductor wafers, then we can divide the value 76 into the stem 7 and the leaf 6. In general, we should choose relatively few stems in comparison with the number of observations. It is usually best to choose between 5 and 20 stems. Once a set of stems has been chosen, they are listed along the left-hand margin of the display, and beside each stem all leaves corresponding to the observed data values are listed in the order in which they are encountered in the data set. The figure 3 shows typical stem and leaf plot. [10]
Figure 3 Typical Stem and Leaf Chart for Health Insurance Problems
4.2 Quality Histogram
International Journal of Emerging Technology and Advanced Engineering
Website: www.ijetae.com (ISSN 2250-2459, ISO 9001:2008 Certified Journal, Volume 6, Issue 11, November 2016)
118
To build a histogram for constant information, we should isolate the scope of the information into interims, which are typically called class interims, cells, or receptacles. In the event that conceivable, the canisters ought to be of equivalent width to upgrade the visual data in the histogram. Some judgment must be utilized as a part of selecting the quantity of canisters so that a sensible show can be created. The quantity of containers relies on upon the quantity of perceptions and the measure of dissipate or scattering in the information. A histogram that utilizations either excessively few or an excessive number of containers won't be instructive. We for the most part find that somewhere around 5 and 20 containers is tasteful much of the time and that the quantity of receptacles ought to increment with n. picking the quantity of canisters roughly equivalent to the square foundation of the quantity of perceptions frequently functions admirably practically speaking.Once the quantity of receptacles and the lower and upper limit of every container has been resolved, the information are sorted into the canisters and a check is mentioned of the quantity of objective facts in every container. To build the histogram, utilize the flat hub to speak to the estimation scale for the information and the vertical scale to speak to the checks, or frequencies. In some cases the frequencies in every receptacle are partitioned by the aggregate number of perceptions (n), and after that the vertical size of the histogram speaks to relative frequencies. Rectangles are drawn over every canister and the tallness of every rectangle is corresponding to recurrence (or relative recurrence). Most measurements bundles develop histograms. [10]
4.3 The Box Plot
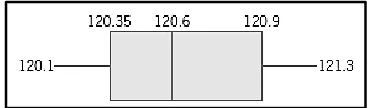
The stem-and-leaf show and the histogram give a visual impression about an information set, though the example normal and standard deviation give quantitative data about particular elements of the information. The crate plot is a graphical show that all the while shows a few critical elements of the information, for example, area or focal inclination, spread or fluctuation, takeoff from symmetry, and ID of perceptions that lie uncommonly a long way from the main part of the information (these perceptions are frequently called "exceptions").
A box plot shows the three quartiles, the base, and the most extreme of the information on a rectangular box, adjusted either evenly or vertically. The box encases the interquartile run with the left (or lower) line at the main quartile Q1 and the privilege (or upper) line at the third quartile Q3.
[image:5.612.351.537.255.309.2]A line is drawn through the container at the second quartile (which is the fiftieth percentile or the middle) A line at either end reaches out to the extraordinary qualities. These lines are generally called hairs. A few boxes allude to the box plot as the crate and hair plot. In some PC programs, the bristles just broaden a separation of 1.5 (Q3 − Q1) from the closures of the container, at most, and perceptions past these breaking points are hailed as potential anomalies. This variety of the fundamental method is known as a modified box plot. [9, 10]
Figure 4 The Box Plot showing Mean Dimension and Variations
V. CONCLUSION
This paper will bear some significance with scholastic analysts and viable administrators. It portrays the defense and choice of the procedure, how the instruments and strategies of process philosophy were utilized in the diverse stages and how the change activities were actualized. This process procedure can be utilized to unravel any process issue bringing about enhancing business comes about lastly enhance consumer loyalty. Be that as it may, individuals can alter the point by point substance and devices as indicated by the authoritative condition, determination of factors for investigation and accessibility of information.
The review work demonstrates the successful devices for dissecting process to control. DMAIC (Design, Manufacture, Analyze, Implement and Control) philosophy will in view of these instruments. The apparatuses spoke to here are most helpful in manufacturing and modern area to enhance rate of productivity. In this manner sparing in time, works, material and hardware. That will at last decrease production cost. It is also conclude that process capability is one of the perfect techniques to improve the financial growth of organization.
REFERENCES
[1] Sanjit Ray, Prasun Das, “Improve Machining Process Capability By
using Six-Sigma”, International Journal For Quality Research, Vol.5, Issue 2, 2011, Pp. 109-122.
[2] Yerriswamy Wooluru, Swamy D.R., P. Nagesh, “The Process
Capability Analysis - A Tool For Process Performance Measures And Metrics - A Case Study”, International Journal for Quality Research, vol. 8, Issue 3, pp. 399-416.
[3] Ketan, H., Nassir, M., “Aluminum Hot Extrusion Process Capability
International Journal of Emerging Technology and Advanced Engineering
Website: www.ijetae.com (ISSN 2250-2459, ISO 9001:2008 Certified Journal, Volume 6, Issue 11, November 2016)
119
[4] Andrew A. Erameh, “Process Capability Analysis of a Centre Lathe
Turning Process”, journal of Engineering, 2016, vol. 8, pp. 79-85.
[5] Shri. Bhushan Nimbaji Saner, “Statistical Analysis of Process
Capabilities to Reduce Cost - A Case Study At Kiran Machine Tool Jalgaon. (M.s.)”, Global Journal For Research Analysis, Volume-4, Issue-9, Sept-2015, pp. 82-85
[6] Victor E. Cane, “Process Capability Indices”, Journal of Quality
Technology, vol. 18, Issue 1, 1986, pp. 41-52.
[7] Matti Mottonen, Pekka Belt, Janne Harkonen, Harri Haapasalo and
Pekka Kess, “Manufacturing Process Capability and Specification Limits”, The Open Industrial and Manufacturing Engineering Journal, vol. 1, 2008, pp. 29-36.
[8] Lingzhi Zhong, “Application of the Doppler weather radar in real-time quality control of hourly gauge precipitation in eastern China”, Atmospheric Research, 172–173 (2016), pp. 109–118
[9] Beata Mrugalska, “Quality control methods for product reliability
and safety”, Procedia Manufacturing, vol. 3, 2015, pp. 2730-2737.
[10] John S. Oakland, “Statistical Process Control”, Fifth Edition,