Development of a Micro-simulation Model to
Evaluate Shuttle-lane Roadwork Operations
Mohammed Tawfik Alterawi
School of Computing, Science and Engineering
University of Salford
Manchester, UK
i
List of Figures ... x
Acknowledgements ... xiii
Declaration... xiv
Dedication ... xv
Abbreviations ... xvi
Symbols ... xviii
Abstract ... xxi
Chapter One: Introduction ... 1
1.1 Background ... 1
1.2 Roadworks in an urban environment ... 1
1.3 Problem statement ... 2
1.4 Aims and objectives ... 3
1.5 Thesis outline ... 4
Chapter Two: Literature Review ... 7
2.1 Introduction ... 7
2.2 Shuttle-lane site layout ... 7
2.3 Stream definition ... 8
2.4 Types of traffic control ... 8
2.4.1 No specified priority (Give and Take) ... 9
2.4.2 Signed priority control ... 9
2.4.3 Traffic signals control ... 10
2.4.4 Control by manually operated Stop/Go Signs ... 16
2.4.5 Flag transfer method ... 16
2.4.6 Pilot car method ... 17
2.5 Traffic control selection criteria ... 18
2.6 Effects of roadworks ... 22
2.6.1 Restricted height or width ... 22
2.6.2 Reduction in speed ... 22
2.6.3 Reduction in visibility ... 22
2.6.4 Interference with non-motorised road users ... 23
ii
2.6.8 Environmental effect ... 25
2.6.9 Safety effect ... 25
2.7 Traffic flow modelling ... 31
2.7.1 Fundamentals of traffic flow theory ... 31
2.7.2 Definitions of different types of models ... 32
2.7.3 Existing shuttle-lane mathematical models and their limitations ... 34
2.7.4 Existing analytical software packages and their limitations ... 36
2.7.5 Existing simulation models and their limitations... 38
2.8 Summary ... 42
Chapter Three: Data Collection and Description ... 43
3.1 Introduction ... 43
3.2 Data collection techniques ... 43
3.3 Site selection ... 45
3.3.1 Category 1: Historical shuttle-lane roadworks sites ... 45
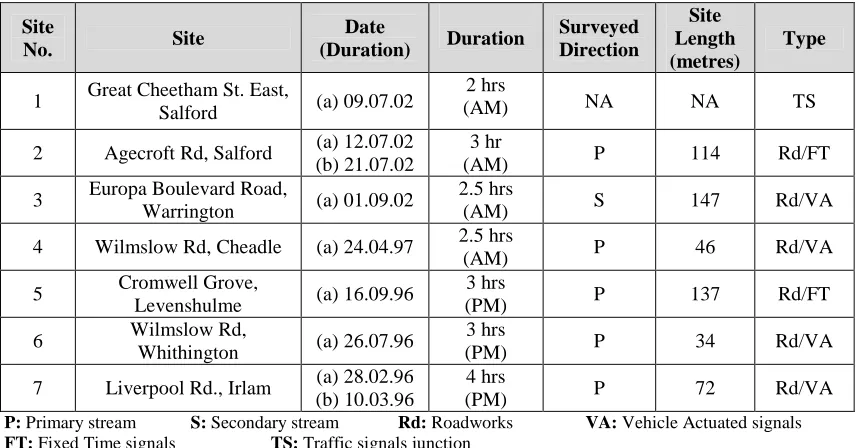
3.3.2 Category 2: Current shuttle-lane roadworks sites (full surveys) ... 45
3.3.3 Category 3: Current shuttle-lane roadworks sites (partial surveys) ... 46
3.3.4 Category 4: Current post-removal of shuttle-lane roadworks sites ... 47
3.3.5 Category 5: Typical signalised junctions sites ... 47
3.3.6 Category 6: other data (Individual Vehicle Data-IVD) ... 48
3.4 Description of collected data ... 48
3.4.1 Flow level, profile and composition ... 48
3.4.2 Throughput ... 49
3.4.3 Time headway ... 49
3.4.4 Move-up Time (MUT) ... 50
3.4.5 Move-up Delay (MUD) ... 50
3.4.6 Drivers’ behaviour ... 50
3.4.7 Roadworks sites characteristics ... 51
3.4.8 Signals settings... 51
iii
4.2 Data extraction ... 52
4.3 Accuracy of observed data ... 52
4.4 Flow level and profile ... 54
4.5 Arrival headway ... 55
4.5.1 Arrival headway distribution ... 55
4.5.2 Headway models using real data... 56
4.6 Following headway ... 58
4.6.1 Following headway distribution ... 59
4.6.2 Close following behaviour “tailgating” ... 63
4.7 Move-up time (MUT)... 65
4.7.1 Existing shuttle-lane roadworks data ... 65
4.7.2 Comparison with historical data ... 67
4.8 Move-up delay (MUD)... 68
4.9 Vehicle length ... 70
4.10 Signals settings ... 74
4.10.1 Signals settings... 74
4.10.2 VA detection failure ... 76
4.11 Drivers’ compliance ... 76
4.11.1 Category 1: Dilemma Zone (DZ) ... 77
4.11.2 Category 2: Dilemma zone follower ... 78
4.11.3 Category 3: Group violations ... 80
4.11.4 Category 4: Single violation ... 81
4.11.5 Summary of observed red light violations ... 82
4.12 Signage ... 84
4.13 Summary ... 87
Chapter Five: Limitations of The S-Paramics Micro-Simulation Model... 88
5.1 Introduction ... 88
5.2 Development of the S-Paramics model ... 88
5.3 Statistical tests ... 89
5.3.1 Root Mean Square Error Percentage (RMSEP) ... 90
iv
Chapter Six: SIMSUR Model Specification and Development... 94
6.1 Introduction ... 94
6.2 SIMSUR model structure ... 94
6.3 Drivers’ and vehicles’ characteristics ... 95
6.3.1 Perception reaction time ... 96
6.3.2 Move-up delay ... 97
6.3.3 Vehicle type and length ... 98
6.3.4 Desired Speed ... 98
6.3.5 Buffer space ... 99
6.3.6 Arrival headway distribution ... 99
6.3.7 Acceleration and deceleration rates ... 99
6.4 Car-following model structure ... 100
6.4.1 Introduction ... 100
6.4.2 Acceleration from vehicle capability (ACC1) ... 101
6.4.3 Acceleration from comfortable conditions (ACC2) ... 101
6.4.4 Acceleration from stopping distance conditions (ACC3)... 101
6.4.5 Acceleration from slow moving conditions (ACC4) ... 102
6.4.6 Acceleration from stationary conditions (ACC5) ... 102
6.4.7 Acceleration for stopping at traffic signals (ACC6) ... 102
6.4.8 Selection criteria of the final acceleration rate (ACC) ... 103
6.5 Modelling of shuttle-lane roadworks ... 104
6.5.1 Introduction ... 104
6.5.2 Drivers’ compliance with temporary traffic signals ... 105
6.6 Modelling of shuttle-lane traffic signals ... 109
6.6.1 Introduction ... 109
6.6.2 Fixed time signals (FT) ... 109
6.6.3 Vehicle actuated signals (VA) ... 109
6.7 Other model characteristics ... 110
6.8 Model output ... 111
6.9 Model capabilities ... 111
v
7.2 Statistical tests ... 115
7.2.1 Root Mean Square Error (RMSE)... 115
7.2.2 Coefficient of correlation (r) ... 116
7.2.3 Theil's Inequality Coefficient (U) ... 116
7.2.4 Bias proportion (Um) ... 117
7.2.5 Variance proportion (Us) ... 117
7.3 Model verification process ... 117
7.4 Model calibration process ... 120
7.4.1 Calibration of the car-following model... 120
7.4.2 Calibration of the shuttle-lane model ... 122
7.4.3 Calibration of the simulation model ... 123
7.5 Model validation process ... 134
7.5.1 Fixed Time signals (FT)... 134
7.5.2 Vehicle Actuated signals (VA) ... 141
7.6 Summary ... 148
Chapter Eight: SIMSUR Model Application ... 149
8.1 Introduction ... 149
8.2 The effect of site length on system capacity and delays ... 149
8.2.1 Effect on system capacity ... 150
8.2.2 Effect on delays... 151
8.3 The effect of drivers’ non-compliance on system capacity ... 151
8.4 The effect of HGVs percentage on system capacity ... 152
8.5 The effect of directional split on system capacity ... 153
8.6 Estimation of maximum system throughput ... 154
8.7 Improved shuttle-lane roadworks operation ... 155
8.7.1 Signals settings... 156
8.7.2 Detection range ... 157
8.7.3 Reduction of dilemma zone effect ... 158
8.7.4 Reduction of tailgating behaviour ... 160
vi
9.2 Recommendations and further research ... 166
References ... 168
References from the web ... 182
APPENDIX A: Shuttle-lane roadworks sites plans ... 183
APPENDIX B: Data analysis ... 217
vii
Table 2.1: Unobstructed width for different single carriageway roadworks types (Department
for Transport, 2009) ... 7
Table 2.2: Various shuttle-lane roadworks control methods in different countries ... 9
Table 2.3: All-Red timing for different site length (Department for Transport, 2009) ... 11
Table 2.4: Maximum green time for different site length (Department for Transport, 2009) 11 Table 2.5: Advantages and disadvantages of shuttle-lane control methods ... 18
Table 2.6: Desirable maximum length of single-lane operation (Queensland Goverment, 2010) ... 19
Table 2.7: Critical site length vs. two-way flow for Stop/Go operation method (Department for Transport, 2009) ... 19
Table 2.8: Traffic control selection criteria for shutle-lane roadworks in different countries . 21 Table 2.9: List of the main shuttle-lane roadworks mathematical models ... 35
Table 2.10: List of shuttle-lane roadworks software packages ... 37
Table 2.11: List of the main shuttle-lane roadworks simulation models ... 40
Table 3.1: Summary of site list and collected data (historical sites) ... 45
Table 3.2: Summary of site list and collected data (current sites) ... 46
Table 3.3: Summary of partially surveyed sites... 47
Table 3.4: Summary of studied parameters through site categories ... 49
Table 4.1: MUD mean (µ) and sd (σ) by different observers (in seconds) ... 53
Table 4.2: Arrival headway mean (µ) and sd (σ) by different observers (in seconds) ... 54
Table 4.3: Summary of arrival flow for each site ... 55
Table 4.4: Summary of statistics for arrival headway distribution fitting ... 58
Table 4.5: Summary of some previous studies examined following behaviour ... 59
Table 4.6: Summary of statistics for following headway for each site ... 60
Table 4.7: Summary of statistics for time headway with lognormal distribution fitting ... 61
Table 4.8: Summary of statistics for time headway comparison between BAR and ACR ... 62
Table 4.9: Summary of close following behaviour for all sites, streams and location ... 65
Table 4.10: Move-up time for shuttle-lane roadworks ... 66
Table 4.11: Summary of statistics for MUT with lognormal distribution fitting ... 67
Table 4.12: Summary of MUT mean value (µ) in seconds for current and historical sites ... 68
Table 4.13: Move-up delay for various studies ... 69
viii
Table 4.17: HGVs classification based on urban roads ... 72
Table 4.18: HGVs length statistical summary based on UK urban roadworks sites ... 73
Table 4.19: Summary of signals settings for each site... 76
Table 4.20: Categories of observed amber crossing/red light violations at temporary traffic signals... 77
Table 4.21: Amber crossing/red light violation for Category 1 (DZ) ... 78
Table 4.22: Amber crossing/red light violation for Category 2 (DZ followers) ... 80
Table 4.23: Frequency of DZ and DZ follower (Category 1 and Category 2) ... 80
Table 4.24: Red light violation for Category 4 (single violation)... 82
Table 4.25: Amber crossing/red light violation by category ... 83
Table 4.26: Comparison of red light violations (typical signals vs. roadworks) ... 84
Table 4.27: List of sign for shuttle-lane roadworks ... 85
Table 4.28: Signs and distances for historical roadworks sites ... 86
Table 4.29: Signs and distances for current roadworks sites ... 86
Table 5.1: S-Paramics model statistics - flow and throughput (Site 16a) ... 91
Table 5.2: S-Paramics model statistics - headway (Site 16a) ... 91
Table 5.3: S-Paramics model statistics - queues (Site 16a) ... 93
Table 6.1: Summary of previous studies on drivers’ reaction time ... 96
Table 6.2: Maximum acceleration rates (m/sec2) for cars and HGVs (ITE, 1999) ... 100
Table 7.1: List of sites used for model calibration / validation stage ... 114
Table 7.2: Data used in model input/output or calibration/validation stage ... 115
Table 7.3: Performance of the car-following model in the selected traffic micro-simulation models (Panwai and Dia, 2005) ... 121
Table 7.4: Summary of observed and calibrated RACL for all sites ... 123
Table 7.5: Summary of time headway results for different cases for Site 16a ... 124
Table 7.6: Model calibration statistics-flow for various shift values (Site 16a) ... 125
Table 7.7: Model input parameters (Site 16a) ... 126
Table 7.8: Model calibration statistics-flow and throughput (Site 16a) ... 127
Table 7.9: Model calibration results – time headway (Site 16a) ... 128
Table 7.10: Model calibration statistics – signals compliance (Site 16a) ... 128
Table 7.11: Model calibration statistics – total MUT (Site 16a) ... 129
ix
Table 7.15: Model calibration results-headway (Site 12) ... 132
Table 7.16: Model calibration statistics-compliance (Site 12) ... 132
Table 7.17: Model calibration statistics – total MUT (Site 12) ... 133
Table 7.18: Model calibration statistics-queues (Site 12) ... 134
Table 7.19: Model input parameters (Site 16b) ... 135
Table 7.20: Model input parameters (Site 19) ... 135
Table 7.21: Model validation statistics-flow and throughput (Site 16b) ... 136
Table 7.22: Model validation statistics-flow and throughput (Site 19) ... 137
Table 7.23: Model validation results-headway (Site 16b) ... 138
Table 7.24: Model validation results-headway (Site 19) ... 138
Table 7.25: Model validation statistics-compliance (Site 16b) ... 139
Table 7.26: Model validation statistics-compliance (Site 19) ... 139
Table 7.27: Model validation statistics – total MUT (Site 16b) ... 139
Table 7.28: Model validation statistics – total MUT (Site 19) ... 140
Table 7.29: Model validation statistics-queues (Site 16b) ... 141
Table 7.30: Model validation statistics-queues (Site 19) ... 141
Table 7.31: Model input parameters (Site 17) ... 142
Table 7.32: Model input parameters (Site 18) ... 142
Table 7.33: Model validation statistics-flow and throughput (Site 17) ... 143
Table 7.34: Model validation statistics-flow and throughput (Site 18) ... 143
Table 7.35: Model validation results-headway (Site 17) ... 145
Table 7.36: Model validation results-headway (Site 18) ... 145
Table 7.37: Model validation statistics-compliance (Site 17) ... 146
Table 7.38: Model validation statistics-compliance (Site 18) ... 146
Table 7.39: Model validation statistics – total MUT (Site 17) ... 146
Table 7.40: Model validation statistics – total MUT (Site 18) ... 146
Table 7.41: Model validation statistics-queues (Site 17) ... 148
x
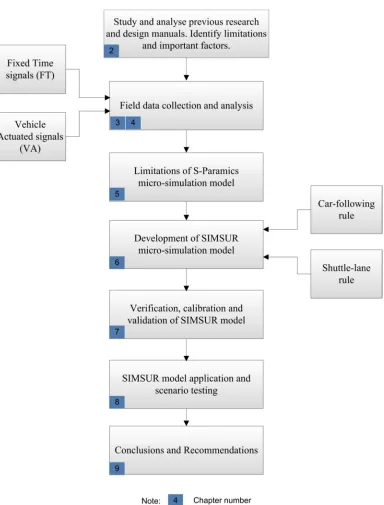
Figure 1.1: Flow chart of the current research study ... 6
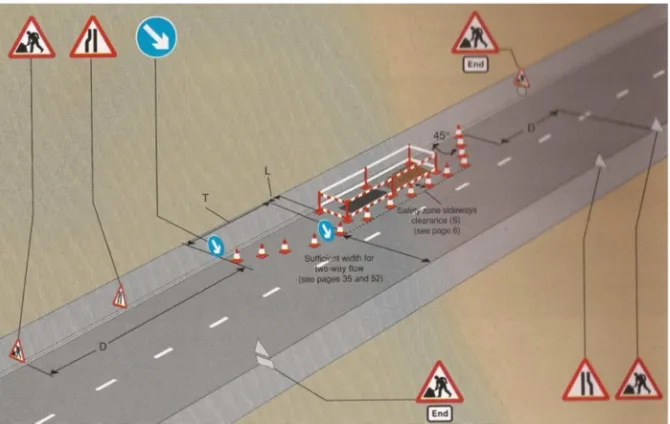
Figure 2.1: Typical site layout of shuttle-lane operation on single carriageway (Department for Transport, 2011) ... 7
Figure 2.2: Illustration of primary and secondary streams ... 8
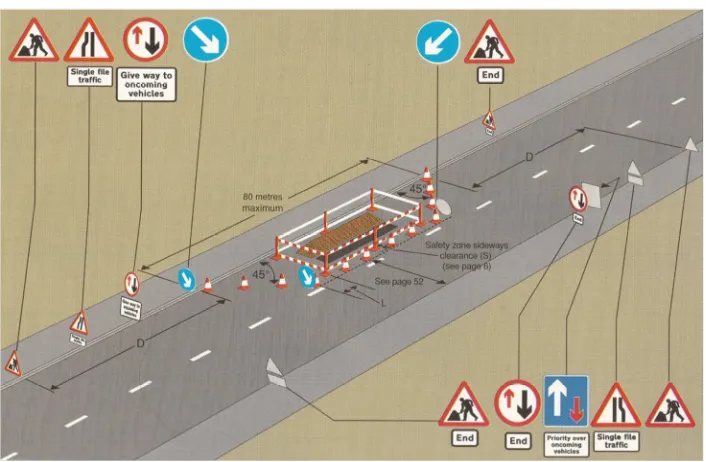
Figure 2.3: Typical site layout for shuttle-lane roadworks operated by priority signs (Department for Transport, 2011) ... 10
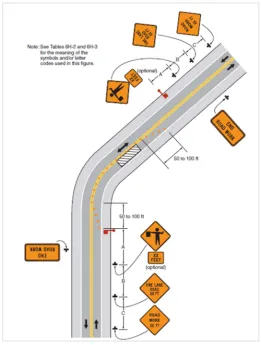
Figure 2.4: Typical site layout for shuttle-lane roadworks operated by portable traffic signals (Department for Transport, 2011) ... 12
Figure 2.5: All-red timing for different site length ... 12
Figure 2.6: Temporary traffic signals phase sequence ... 15
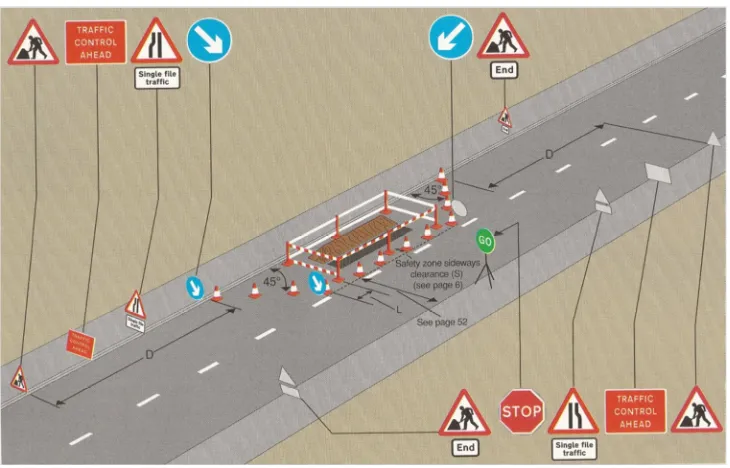
Figure 2.7: Typical site layout for shuttle-lane roadworks operated by Stop/Go boards (Department for Transport, 2011) ... 16
Figure 2.8: Typical site layout for shuttle-lane roadworks operated by flag transfer method (Federal Highway Administration, 2009) ... 17
Figure 2.9: Relationship between site length and maximum capacity (Summersgill, 1981) .. 24
Figure 2.10: Dilemma zone at shuttle-lane roadworks ... 30
Figure 2.11: General layout of speed-density, flow-density and speed-flow relationships (Mannering and Washburn, 2012) ... 32
Figure 3.1: Schematic of the location of video cameras ... 44
Figure 3.2: Map of site locations (categories 2 to 5) ... 47
Figure 3.3: Illustration of time headway ... 50
Figure 4.1: Correlation between different observers in measuring MUD ... 53
Figure 4.2: Correlation between different observers in measuring arrival headway ... 54
Figure 4.3: Observed and predicted arrival headway cumulative distribution for Site 11 using lognormal distribution ... 57
Figure 4.4: Observed and predicted arrival headway cumulative distribution for Site 16 using lognormal distribution ... 57
Figure 4.5: Observed and predicted arrival headway cumulative distribution for Site 19 using shifted negative exponential distribution ... 57
xi
Figure 4.8: Move-up time for various studies compared with shuttle-lane roadworks ... 67
Figure 4.9: Distribution of move-up delay for shuttle-lane roadworks ... 70
Figure 4.10: Cumulative frequency MUD for shuttle-lane roadworks ... 71
Figure 4.11: Frequency car length distribution based on UK motorway (M25 and M42) ... 73
Figure 4.12: Cumulative car length distribution based on UK motorway (M25 and M42) .... 73
Figure 4.13: Frequency distribution for HGVs length based on urban roadworks sites... 74
Figure 4.14: Cumulative distribution for HGVs length based on urban roadworks sites ... 74
Figure 4.15: Distribution of DZ and DZ follower (Category 1 and Category 2) ... 81
Figure 4.16: Amber crossing/red light violation by category ... 83
Figure 5.1: Shuttle-lane roadworks using S-Paramics ... 89
Figure 5.2: S-Paramics model vs. observed flow (Site 16a) ... 91
Figure 6.1: General structure of SIMSUR simulation model ... 95
Figure 6.2: Distribution of drivers’ reaction time for alerted and surprised conditions (Johansson and Rumer, 1971) ... 97
Figure 6.3: Method of obtaining vehicle type and length ... 98
Figure 6.4: Definition of buffer space ... 99
Figure 6.5: Car-following sub-model structure ... 104
Figure 6.6: Shuttle-lane roadworks sub-model structure (green/amber crossing) ... 106
Figure 6.7: Shuttle-lane roadworks sub-model structure (red violations) ... 108
Figure 6.8: Vehicle Actuated (VA) sequence for temporary traffic signals ... 110
Figure 7.1: Micro-simulation model verification, calibration and validation stages (May, 1990) ... 114
Figure 7.2: Typical screenshot from the simulation model ... 118
Figure 7.3: An example of model verification for desired speed distribution ... 118
Figure 7.4: An example of model verification for vehicle length distribution (HGVs) ... 119
Figure 7.5: Sample of vehicle trajectories and the effect of traffic signals ... 120
Figure 7.6: Comparison between SIMSUR simulation model and observed distance between the follower and the leader ... 122
Figure 7.7: Arrival flow profile for different shift values (Site 16a) ... 125
Figure 7.8: Model calibration – observed vs. modelled flow data (Site 16a) ... 127
Figure 7.9: Model calibration – MUT for each vehicle (Site 16a) ... 129
xii
Figure 7.13: Model validation – observed vs. modelled flow data (Site 19) ... 136
Figure 7.14: Model validation – MUT for each vehicle (Site 16b) ... 140
Figure 7.15: Model validation – MUT for each vehicle (Site 19) ... 140
Figure 7.16: Model validation – observed vs. modelled flow data (Site 17) ... 143
Figure 7.17: Model validation-observed vs. modelled flow data (Site 18) ... 144
Figure 7.18: Model validation – MUT for each vehicle (Site 17) ... 147
xiii
I would like to thank my supervisor Dr. Saad Yousif for his support and guidance throughout this study. I am grateful for his encouragement which gave me the confidence to complete my work.
xiv
Parts of the current PhD research have resulted in the following publications, conferences and presentations.
* Alterawi, M. (2012). The Use of Road Narrowing “Throttle” as traffic calming: Modelling junction operation. SPARC Conference. University of Salford, UK.
Alterawi, M. and Yousif, S. (2012). Utilising Micro-simulation in Testing Traffic Calming Management Scenarios. Dean’s Annual Research Showcase. Poster and abstract. University of Salford, UK.
Alterawi, M. (2012). A critical review of urban roadworks using shuttle-lane operations. CSE Conference. University of Salford, UK.
Alterawi, M. (2012). Utilising Paramics in testing traffic calming management scenarios. Paramics workshop. Manchester, UK.
Alterawi, M.,Yousif, S. and Henson, R. (2013). Modelling road narrowing using S-Paramics. 45th Annual UTSG Conference. University of Oxford, UK.
Yousif, S., Alterawi, M. and Henson, R. (2013). Effect of road narrowing on junction capacity using microsimulation. ASCE, Journal of Transportation Engineering, 139(6), pp.574-584.
Alterawi, M. (2013). Site observations of aggressive drivers’ behaviour at urban roadworks. SPARC Conference. University of Salford, UK.
Yousif, S., Alterawi, M, Henson, R. (2014). Red light running and close following behaviour at urban shuttle-lane roadworks. Accident Analysis and Prevention, 66 (1), pp.147-157.
Alterawi, M. and Yousif, S. (2013). Site Observations of Aggressive Drivers’ Behaviour at Urban Roadworks – A case study from Greater Manchester. Dean’s Annual Research Showcase. Poster and abstract. University of Salford, UK.
Alterawi, M. and Yousif, S. (2014). Micro-simulation model for shuttle-lane roadworks operated by temporary traffic signals. Paper accepted for publication in the IEEE Transactions on Intelligent Transportation Systems Journal (in press).
xv
To God, who is indeed the Beneficent and the Merciful To my father for his support
To my wife and my children for their help, support and courage To my sisters and brothers
xvi ACR: After Crossing Roadworks AGV: Automatic Guided Vehicles AH: Arrival Headway
BAR: Before Approaching Roadworks CCTV: Closed Circuit Television
CORSIM: CORnell microSIMulation Model DfT: Department for Transport
DZ: Dilemma Zone
FHWA: Federal Highway Administration (USA) FORTRAN: FORmula TRANslating System
FT: Fixed Time signals operation GEH: Geoffrey E. Havers statistical test HA: Highways Agency
HCM: Highway Capacity Manual HGVs: Heavy Goods Vehicles ITS: Intelligent Transport System kph: Kilometre per hour
K-S: Kolmogorov-Smirnov LOS: Level Of Service
MOVA: Microprocessor Optimised Vehicle Actuation MUD: Move Up Delay
MUT: Move Up Time
MUTCD: Manual on Uniform Traffic Control Devices MVD: Microwave Vehicle Detector
Paramics: PARAllel MICroscopic Simulation QUADRO: QUeues and Delays at ROadworks
QUEWZ: Queue and User cost Evaluation of Work Zone RAND: RANDom number generated by the program RMSE: Root Mean Square Error
RMSEP: Root Mean Square Error Percentage
xvii TH: Time Headway in seconds
TS: Traffic Signals junction
TTI: Texas Transport Institute (USA) VA: Vehicle Actuated signals operation VISSIM: VlSual SIMulation
vph: Vehicle per hour
xviii
µ: The mean of the distribution
σ: The standard deviation of the distribution
∆t: Scanning time in seconds
α: Level of significance
δ: The perception reaction time of the driver (seconds)
τ : The length of the clearing period (Amber plus all-red period) (seconds) ACC: Final calculated acceleration/deceleration rate of the vehicle (m/sec2) ACC1: Maximum acceleration rate of the vehicle (m/sec2)
ACC2: Acceleration rate required to reach desired speed (m/sec2)
ACC3: Acceleration rate required to meet the non-collision criteria (m/sec2) ACC4: Acceleration rate for slow moving vehicle (m/sec2)
ACC5: Acceleration rate for moving from stationary (m/sec2) ACC6: Acceleration rate for stopping at traffic signals (m/sec2) Amb: Amber time in seconds
AmbP: Amber time for Primary stream in seconds AmbS: Amber time for Secondary stream in seconds AR: All-Red time in seconds
ARP: All-Red time for Primary stream in seconds ARS: All-Red time for Secondary stream in seconds Bs: Buffer Space in metres
C: Number of Cycles
CT: Cycle Time in seconds
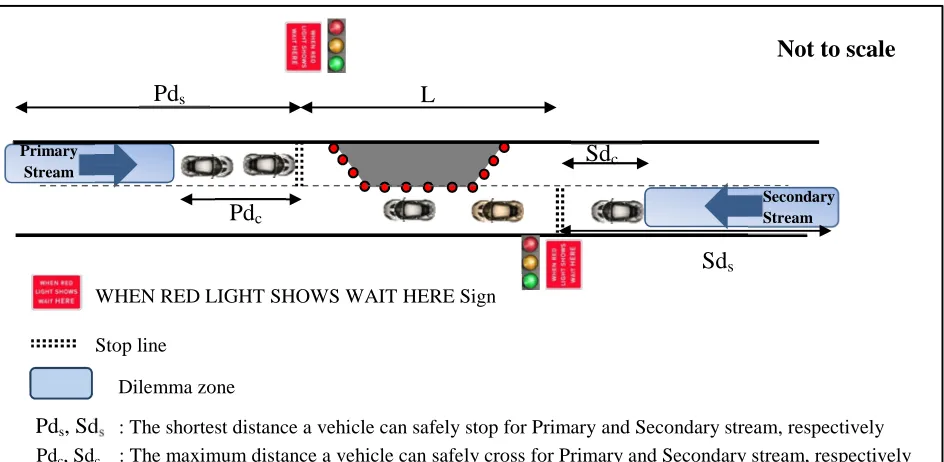
dc: The maximum distance a vehicle can safely cross (metres)
Dcr: Critical difference in the cumulative distributions between two samples Dmax: Maximum difference in the cumulative distributions between two samples DS: Design Standards
dS: The shortest distance a vehicle can safely stop (metres)
Ds(n): The difference between the current position of vehicle n and the stop line in metres
xix LV : Vehicle length in metres
m: The mean of the lognormal distribution
MaxDL: Maximum deceleration rate of the leading vehicle (m/sec2) MaxDF: Maximum deceleration rate of the following vehicle (m/sec2)
N: Sample size
NPosn: New position of vehicle (n) in metres NSpn: New speed of vehicle (n) in km/hr
P: Primary stream
PosF: Position of the follower vehicle PosL: Position of the leader vehicle
Posn: Old position of vehicle (n) in metres q: Traffic flow in vehicle/hr
r: Coefficient of correlation RA: Red Amber time in seconds
RACF: Random number generated from Amber Crossing for Follower RACL: Random number generated from Amber Crossing for Leader RAmbP: Red Amber time for Primary stream in seconds
RAmbS: Red Amber time for Secondary stream in seconds RL: Random number generated for vehicle length
RRGC: Random number generated from Red Group Crossing RRSC: Random number generated from Red Single Crossing Rt: The reaction time of the vehicle in seconds
Rtype: Random number generated for vehicle type
S: Secondary stream
s: Standard deviation of the lognormal distribution SpF: Speed of the follower vehicle in km/hr
SpL: Speed of the leader vehicle in km/hr Spn: Old speed of vehicle (n) in km/hr StpL: Stop line location
T: Total simulation time in seconds
t: Time in seconds
xx
V: Number of Vehicles
v: Traffic speed in km/hr
ν85: The 85th percentile speed of vehicles or the speed limit (m/s)
ν15: The 15th percentile speed of vehicles (m/s) xi: The observed flow at time interval i
, : The mean and the standard deviation for the actual observed data yi: The simulated flow at time interval i
xxi
ABSTRACT
This thesis focuses on the development of a micro-simulation model for urban shuttle-lane roadworks. The aim of this research is to study the effectiveness of shuttle-lane roadworks traffic management controls (i.e. operated by temporary traffic signals) on capacity, delays and safety.
SIMSUR (SIMulation of Shuttle-lane Urban Roadworks) micro-simulation model is based on car-following and shuttle-lane rules, considers the various decisions undertaken when approaching temporary traffic signals at urban shuttle-lane roadworks (i.e. tailgating, crossing through amber or even violating the red light). Data from six different sources were collected (from 23 different sites with over 54 hours of traffic data video recordings). This includes data from visited roadworks sites, Individual Vehicle Data (IVD) from UK motorways and data from typical signalised junctions.
Temporary traffic signals operation modes, including Fixed Time (FT) and Vehicle Actuated (VA) signals, have been integrated within the developed micro-simulation model. The developed model has been verified, calibrated and validated using real traffic data.
1
CHAPTER ONE:
INTRODUCTION
1.1
Background
Roadworks have become an unavoidable aspect of the road network due to the continuous requirement for road surface maintenance and the need for utility companies to perform their tasks (i.e. water, gas and electricity companies). When roadworks take place in any urban road network, they cause an obstruction to traffic, which in turn increases the risk of accidents and delays/congestion and reduces capacity and vehicle speed, which could lead to extra costs for road users. These issues have led to an investigation into the main factors influencing roadworks operations, with the aim of reducing their effects as much as possible.
In the United States, the Federal Highway Administration (2004) estimated that work zones cause around 10% of overall congestion. It was reported by Tang (2008) that the Texas Transportation Institute report (2007) stated that the cost of congestion in the United States in 2005 alone was $78 billion. In the United Kingdom, it was estimated that the congestion caused by roadworks in London alone costs around £750 million/year (London First, 2012). Furthermore, in the United States in 2006, 1,010 people were killed and around 40,000 injuries were caused because of traffic accidents in work zones (Tang, 2008).
Transportation agencies are under pressure to reduce congestion and accident levels at roadworks. In the United States, the government has started applying incentive/disincentive (I/D) fees to roadworks contractors in an attempt to reduce the duration of the roadworks and therefore try reducing congestion and accident levels. It was indicated that 35 states in the USA are using I/D methods. Lane rental has also been introduced to add daily costs to contractors to speed up the roadworks to reduce duration (Herbsman et al., 1995; Benekohal et al., 2003 and Tang, 2008). In the United Kingdom, the lane rental scheme was introduced
in 2011 and implemented in 2012 in the City of London.
1.2
Roadworks in an urban environment
2
When applying shuttle-lane operations, appropriate types of control are required. These types of control should achieve the following goals:
1- Minimise delays for road users and disperse queues effectively; 2- Safety for road users (drivers, pedestrians and workers).
Designing shuttle-lane roadworks and the traffic control selection method are very complex issues as various factors need to be taken into account. These factors are (but not limited to) site length, presence of pedestrians and cyclists movements, junction proximity and type of operation, proximity to a railway crossing, public transport routes, level and directional split of existing flow, etc.
According to Mahoney et al. (2007), alternating one-way operation (shuttle-lane) has the following advantages and disadvantages:
Advantages:
Low agency cost compared with other methods;
Several variations available (various control methods can be implemented). Disadvantages:
Requires the stopping of traffic; Reduces capacity.
1.3
Problem statement
Shuttle-lane roadworks government design guidelines of several countries (i.e. United Kingdom, United States, France and Australia) have been collected and studied. Various differences were found within these guidelines such as recommended site lengths and maximum allowed flow levels for each method of traffic operation. Important factors were not taken into account when selecting or designing each traffic control method.
3
Analytical models use inadequate capacity models, because there are several roadworks features such as the presence of flaggers, ITSs and Vehicles Actuated (VA) traffic signals which are not reflected in these models (Edara and Cottrell, 2007; Tang, 2008; Ramezani et al., 2011). Previous studies showed that the accuracy of some software programs in
estimating roadworks delay and queue length are inadequate (Schnell et al., 2002; Benekohal et al., 2003 and Lee et al., 2008).
Simulation models were generally designed for under-saturated conditions where traffic does not exceed the site capacity. Simulation packages have various limitations such as omitting vehicles, various parameters are imbedded within the program code that the users do not have access to and the required level of complicated steps to ensure correct behaviour of such a system as is the case from real traffic situations. The models also do not take into account the aggressive nature of drivers’ behaviour (i.e. tailgating and red light violations).
Considering the limitations of the existing simulation, mathematical and analytical models in estimating site capacity, queue length and delay, a new micro-simulation model needed to be developed to take into account:
Accurate estimation of shuttle-lane roadworks capacity, delays and queues under various traffic control conditions;
The ability to replicate aggressive drivers’ behaviour such as tailgating (close-following), amber crossing and red light violations.
The effect of various parameters that affect roadworks performance such as HGVs percentage, directional split, etc.;
The ability to test advanced traffic control techniques such as the latest Vehicle Actuated (VA) signals settings, microwave vehicle detectors with various detection lengths, improved control methods, etc.
1.4
Aims and objectives
4 The objectives of the study are to:
Determine the factors that affect the operation of shuttle-lane roadworks based on previous literature research.
Develop a traffic micro-simulation model (i.e. using S-Paramics and Compaq Visual Fortran) representing shuttle-lane operation. The model should be capable of taking into consideration the limitations of previous models using the existing rules and algorithms and applying the necessary modifications as required.
Use real observed traffic data to build, verify, calibrate and validate the developed model.
Use real traffic data to study the effect of various traffic signals operation methods such as Fixed Time signals (FT) and Vehicle Actuated signals (VA).
Utilise the model to study the effect of various traffic parameters such as traffic composition, flow levels and HGVs percentage on delays and site capacity.
Use the model to test roadway factors such as site length, which affect capacity and delays.
Carry out regression analysis to develop a more comprehensive relationship between those parameters and capacity which can be used in analytical models.
Utilise the model to test new techniques on the methods of operation which could lead to improvement of site operation (maximising capacity and reducing delays) and improving safety.
Utilise the model to test the effect of aggressive drivers’ behaviour such as tailgating and amber crossing/red light violations and propose new techniques to reduce it accordingly.
1.5
Thesis outline
The thesis is divided into nine sections as described below:
5
Chapter two presents the review of literature of shuttle-lane roadworks from previous studies and design manuals.
Chapter three presents the data collection methodology and description of the visited sites during the current and previous available studies.
Chapter four presents the analysis that was performed on the collected data.
Chapter five describes the developed S-Paramics simulation model. It also describes the calibration, validation and limitations of the developed model.
Chapter six describes the newly developed SIMSUR (SIMulation of Shuttle-lane Urban Roadworks) simulation model and explains the adopted car-following and shuttle-lane rules.
Chapter seven explains the verification, calibration and validation of the car-following and shuttle-lane rules and also for the whole of the simulation model using real data from the visited sites and from different sources.
Chapter eight presents the application of the developed model and the improvement achieved in terms of safety and capacity.
Chapter nine presents the conclusions and recommendations for future work.
The structure of the following chapters has been presented to correspond to the development process of the current research as illustrated in Figure 1.1. It can be seen from Figure 1.1 that two main rules (sub-models) have been developed for the current study (i.e. car-following and shuttle-lane rules). The car-following rule governs the longitudinal vehicle behaviour (i.e. the relationship between the leader and the follower) and shuttle-lane rule governs the vehicle behaviour and interaction at the shuttle-lane roadworks operated by temporary traffic signals.
6
7
CHAPTER TWO:
LITERATURE REVIEW
2.1
Introduction
The literature review chapter summarises the various aspects and design standards of shuttle-lane operation and the types of traffic control methods employed. It also summarises studies that have been carried out to test different shuttle-lane roadworks components.
2.2
Shuttle-lane site layout
[image:29.595.131.466.343.555.2]A typical site layout of shuttle-lane operation on single carriageway roads can be seen in Figure 2.1. According to the Department for Transport (2009), shuttle working with traffic control will be implemented if the unobstructed width (the distance between the edge of the cone and the carriageway curb) is within the limits shown in Table 2.1.
Figure 2.1: Typical site layout of shuttle-lane operation on single carriageway (Department for Transport, 2011)
Table 2.1: Unobstructed width for different single carriageway roadworks types (Department for Transport, 2009)
Method of operation Normal traffic including
buses and HGVs Cars and light vehicles only Two-way working 6.75 metres minimum 5.5 metres minimum
Shuttle-lane working with traffic control
3.7 metres maximum
3.25 metres desirable minimum 3.0 metres absolute minimum
3.7 metres maximum
8
2.3
Stream definition
In order to differentiate between the two traffic streams that use the shuttle-lane roadworks site, the following terms have been used (Summersgill, 1981), which are also illustrated in Figure 2.2:
Primary stream: Is the traffic stream which is running in the obstructed path (by the
works);
Secondary stream: Is the traffic stream which is running in the unobstructed path;
Figure 2.2: Illustration of primary and secondary streams
It is important to distinguish between both streams as the drivers in the primary stream (which is obstructed by the work) generally gives priority to the secondary stream regardless if a signed priority control is used or not (Summersgill, 1981). Primary stream vehicles also require extra time to negotiate the layout (enter the running lane), and also when leaving the site back to their original lane.
2.4
Types of traffic control
Shuttle-lane roadworks will create conflict points between both traffic streams (e.g. primary and secondary) which require some form of control. The functions of using traffic control devices in roadworks are as follows (Matson et al., 1955):
To warn drivers about the hazards ahead; Alert drivers of traffic conditions ahead;
Guide drivers by the right instructions in order to minimise the conflicts that could occur.
Traffic control methods that can be used to operate shuttle-lane roadworks, which are obtained from various design manuals are summarised below (Federal Highway Administration, 2009; Queensland Goverment, 2010; Department for Transport, 2009; Makhloufi and Certu, 2003):
Primary Stream
9 1- No specified priority control (Give and Take); 2- Signed priority control;
3- Traffic signals control;
4- Control by manually operated Stop/Go signs; 5- Flag transfer method;
6- Pilot car method/convoy working.
Table 2.2 shows the available control methods for shuttle-lane roadworks in different countries, and each method is described in details in the following sections.
Table 2.2: Various shuttle-lane roadworks control methods in different countries No. Control Method Australia France United
Kingdom
United States 1 No specified priority
2 Signed priority 3 Traffic signal 4 Stop/Go sign 5 Flag transfer 6 Pilot car
2.4.1 No specified priority (Give and Take)
The “Give and Take” is a control method where there is no specified priority for any traffic stream. Both directions (streams) have equal priority and the drivers have to take a decision on the suitability of gaps in order to cross the roadworks site safely. A typical site layout of shuttle-lane roadworks operated by “give and Take” method is shown in Figure 2.1 above.
According to the Department for Transport (2009), the “Give and Take” operation is the natural method for operating shuttle-lane roadworks. The visibility should be good where drivers from each approach should see 50 metres beyond the end of the works. It is also stated that if the work is to be carried out at night, then another alternative to this method should be considered such as temporary traffic signals.
2.4.2 Signed priority control
10
Signed priority control requires a certain amount of visibility based on different speed limits, and it can be employed at night if certain conditions are met, such as street lighting and illuminated traffic signs as stated by the Department for Transport (2009).
According to the Federal Highway Administration (2009), the stop or yield sign can be used on low volume roads (less than 400 vehicles per day) and when visibility is good that the drivers can see the other end of the work zone and also the other direction of traffic.
[image:32.595.122.475.312.543.2]Signed priority method operates in the same way as traffic calming using throttles. According to Yousif et al. (2013), if the sign is placed near a junction, special consideration should be given to various parameters such as the level of traffic, the distance from the junction and also the direction of the priority streams.
Figure 2.3: Typical site layout for shuttle-lane roadworks operated by priority signs (Department for Transport, 2011)
2.4.3 Traffic signals control
Traffic signals control method is where portable or fixed traffic signals are placed in certain locations at the roadworks site to control traffic movements of both streams. The operation of the signals can be based on either Fixed Time signals (FT) or on Vehicle Actuated signals (VA) with the aid of vehicle detection techniques.
11
VA mode to satisfy certain conditions. If the VA operation is not possible, FT operation is the next preferred option. Manual operation should also be allowed (to override the signals settings) in certain circumstances.
According to the Federal Highway Administration (2009), if the temporary traffic signals are located within 0.5 miles of an adjacent signalised intersection, a connected operation should be considered. There is no reference to signals settings for flow groups or all-red period according to different site lengths but engineering judgment should be used to determine these settings.
The traffic signals controller can adjust the signals timings (all-red time and maximum green time) in order to suit the site length, which is measured between the ‘WAIT HERE’ signs as shown in Figure 2.4 (Department for Transport, 2009).
All-red timing has to be adjusted to the minimum in order to give the moving vehicles chance to clear the roadworks site as shown in Table 2.3 and illustrated in Figure 2.5. The maximum green timing has to be set to the maximum depending on the site length as shown in Table 2.4 (Department for Transport, 2009; ITE, 2010).
Table 2.3: All-Red timing for different site length (Department for Transport, 2009) Distance (metres) 0-50 50-100 100-150 150-200 200-250 250-300
All-red timing (sec) 5 10 15 20 25 30
Table 2.4: Maximum green time for different site length (Department for Transport, 2009)
Distance (metres) 30-75 75-135 135-195 195-300
12
Figure 2.4: Typical site layout for shuttle-lane roadworks operated by portable traffic signals (Department for Transport, 2011)
Figure 2.5: All-red timing for different site length
2.4.3.1 Vehicle-Actuated operation (VA)
[image:34.595.133.465.347.588.2]13
Microwave Vehicle Detector (MVD) is a detection unit placed on top of the signals head which uses microwave technology to detect the movement of vehicles. The MVD can detect most moving vehicles, including larger motorcycles with a maximum detection range of up to 40 metres (but with smaller motorcycles and cycles the range is reduced to 25 metres) assuming that vehicles are travelling towards the MVD with a speed greater than 10 mph and the detector is aligned correctly (Department for Transport, 2008).
Few limitations have been reported regarding the use of MVD detectors, such as it needs to be correctly aligned (correct angle), detection ability might be affected under harsh weather conditions (heavy rain or snow), the detection might be affected by parked vehicles or blocked view such as trees and might not detect approaching vehicle with speed under 10 mph (Department for Transport, 2008; Dickenson and Wan, 1990 and Medina et al., 2012).
According to the latest specification for portable traffic signals control and equipment to be used at roadworks (Highways Agency, 2005B), the minimum green time should be configured to either 7 or 12 seconds and will be extended following a passage of each vehicle (vehicles will be detected using the MVD unit) . The maximum green will be set to a value up to 50 seconds (depending on site length and as shown in Table 2.4).
There is no direct reference given by the Highways Agency (2005B) to the green time extension amount which should be given to each vehicle. It was stated by the Department for Transport (1999a) that green time should be extended by an increment of 0.5 seconds until the vehicle passes the stop line.
2.4.3.2 Fixed Time operation (FT)
According to the Queensland Goverment (2010), FT mode will be used where the VA mode is not possible, the traffic flow at the approaches is relatively constant and the traffic control operation is required at the roadworks site after working hours.
2.4.3.3 Manual operation
14 2.4.3.4 Signals phase sequence
The design procedure of traffic signals timings for shuttle-lane roadworks is not as complicated as in the case of typical signalised junctions in urban areas where the designer has to consider multiple conflicting movements from various directions and also the presence of pedestrians crossing at junctions (for the design procedure of traffic signals for normal junctions, see for example Salter and Hounsell, 1996). Temporary traffic lights at shuttle-lane roadworks are operated using the following phases (Highways Agency, 2005A):
Green period (G);
Stopping amber period (Amb), usually applied as 3 seconds;
Red and/or all-red period(AR), which is used to clear the shuttle-lane site; Red-amber period (RAmb), usually applied as 2 seconds;
The phase sequence of temporary traffic signals at shuttle-lane roadworks is illustrated in Figure 2.6. Values for maximum green and all-red periods are calculated based on site length as shown in Tables 2.3 and 2.4. Cycle length for the temporary traffic signals can be calculated using Equation 2.1 as follows:
CT = G + Amb + AR + RAmb + G + Amb + AR + RAmb Equation 2.1
Where,
CT is the Cycle Time; P is the Primary stream; S is the Secondary stream;
AmbP and AmbS are the stopping amber time for primary and secondary streams, respectively (in seconds);
ARP and ARS are the all-red period for primary and secondary streams, respectively (in seconds);
RAmbP and RAmbS are the red amber time for primary and secondary streams, respectively (in seconds);
15
Figure 2.6: Temporary traffic signals phase sequence 2.4.3.5 Comparison with typical signalised junction
There are various differences between Temporary Traffic Signals (TTS) at shuttle-lane roadworks and Typical Signalised Junctions (TSJ). These differences could be summarised as follows:
The number of conflicting movements is less in TTS at shuttle-lane roadworks compared with TSJ due to the presence of left/right movements and minor/major arms in TSJ which could affect safety. Therefore, the calculation of the phase sequence and green time/all red period may be different.
There may be issues relating to visibility on shuttle-lane roadworks when compared with TSJ. These are affected by the presence of roadworks (including site lengths, especially for long site lengths and possible bends within the geometry of the road). Vehicles on the primary stream have to change their horizontal trajectory at shuttle-lane roadworks.
There may possibly be differences in detection methods used for TTS at shuttle-lane roadworks. Normally Microwave Vehicle Detectors (MVD) are used which influence the operation as explained in previous sections compared with TSJ which mostly use loop detectors.
16
2.4.4 Control by manually operated Stop/Go Signs
Stop/Go boards control method is controlled either manually or electronically (e.g. using radio device) by an operator, which give directions to each traffic stream to either go or stop as shown in Figure 2.7.
It is stated by the Department for Transport (2009) that the “Stop and Go” signs form a double sided sign placed outside the safety zone on a suitable stand. The sign will be operated remotely (e.g. using radio control device) unless for safety reasons, then manual operation will take place. If the sign could not be placed outside the safety zone, then temporary traffic signals are introduced. This method can be used at night if accompanied with appropriate illumination by operators.
[image:38.595.116.481.403.637.2]According to the Federal Highway Administration (2009), for a one-lane two-way operation (shuttle-lane) traffic can be controlled by a flagger (holding Stop and Slow signs) at each end of the work space and they can communicate orally, electronically or by a manual signal. If the visibility is good and the site length is short, the site can be controlled by a single flagger.
Figure 2.7: Typical site layout for shuttle-lane roadworks operated by Stop/Go boards (Department for Transport, 2011)
2.4.5 Flag transfer method
17
[image:39.595.167.428.165.510.2]flag and deliver it to the flagger at the other end. The flagger at the other end will then know that traffic is permitted to move in the other direction. Usually, this method is carried out only on roadwork section of less than 1 mile in length. Typical shuttle-lane operation site layout operated by flag transfer is shown in Figure 2.8.
Figure 2.8: Typical site layout for shuttle-lane roadworks operated by flag transfer method (Federal Highway Administration, 2009)
2.4.6 Pilot car method
Based on the Federal Highway Administration (2009), the pilot car control method is carried out by the use of a car which will lead a queue of vehicles from each stream in alternating way to the other side of the roadworks site. A flagger should also be available at the end of the activity area controlling the traffic until the pilot car is available. The use of pilot car is usually associated with poor visibility at roadworks site.
18
mph or less). The method can be successfully implemented at sites with two-way traffic volume between 900-1000 vehicles/hour (Department for Transport, 2009).
Table 2.5 summarises the advantages and disadvantages of each of the seven shuttle-lane control methods listed previously.
2.5
Traffic control selection criteria
Selection criteria for the appropriate traffic control method require the following considerations (Federal Highway Administration, 2009; Department for Transport, 2009):
Traffic volumes; Duration of work;
Site layout and conditions (e.g. visibility, site length, etc.); Personnel available;
Proximity of a junction, railway crossing or pedestrian crossing.
Table 2.5: Advantages and disadvantages of shuttle-lane control methods
Control Method Advantages Disadvantages
No specified priority
No setup cost required. Do not require personnel to operate or maintain.
Long work duration.
Cannot be applied at night (unless illuminated) or in poor visibility. Only operates on low traffic volume.
Signed priority
Can be operated at night if illuminated and the street is lit. Do not require personnel to operate or maintain.
Long work duration.
Special considerations need to be taken if placed near a junction.
Traffic signal
Operate on high volume of traffic.
Long work duration.
Can be synchronised/linked if near signalised junction.
Can cause high delays and queues if not setup correctly.
Regular maintenance of detectors is required to ensure adequate
operation.
Stop/Go sign
Can be used at night with sufficient illumination. Can be used on high speed roads.
Can be adapted to respond to traffic flow variability. Can be used near intersection.
Requires personnel to operate. Short duration of work. Requires good visibility.
Not applicable to use during night or weekends (inactive time) without the presence of personnel.
Flag transfer Can be used at sites up to 1 mile in length.
Inadequate for sites with high traffic volume.
Interrupt the drivers by asking to deliver a flag.
Requires personnel to operate. Pilot car Can be used with other control
methods.
19
Table 2.6 indicates the maximum desirable site length for each level of traffic volume in vehicles per hour as a selection method in Australia. The site can be operated by traffic controller, portable or temporary fixed traffic signals (Queensland Government, 2010).
Table 2.7 shows the maximum two-way traffic flow for each roadworks site length under the Stop and Go method (Department for Transport, 2009).
Table 2.8 summarises the different criteria available for selecting the appropriate traffic control method for shuttle-lane roadworks in different countries. The values shown in this table for the two-way flow, site length and speed indicate the maximum values.
The values shown in Table 2.8 may vary depending on local conditions and circumstances. It is also noticed in the design guidelines, that (in few cases) there is no specific value provided such as low/high for traffic volume and short/long for site length without providing guidance on those descriptions. Therefore, it is based on engineering judgment to decide which might cause poor design leading to higher delays and queues than expected.
Table 2.6: Desirable maximum length of single-lane operation (Queensland Goverment, 2010)
Traffic volume (both directions) in vehicle
per hour Length of single lane section (metres)
800 70
700 100
600 150
500 250
300 600
<300 800
Table 2.7: Critical site length vs. two-way flow for Stop/Go operation method (Department for Transport, 2009)
Method of control Maximum speed limit (mph)
Length of coned area (metres)
Maximum two-way traffic flow (vehicle
per hour)
Stop/Go signs 60
100 1,400
200 1,260
300 1,060
400 940
20
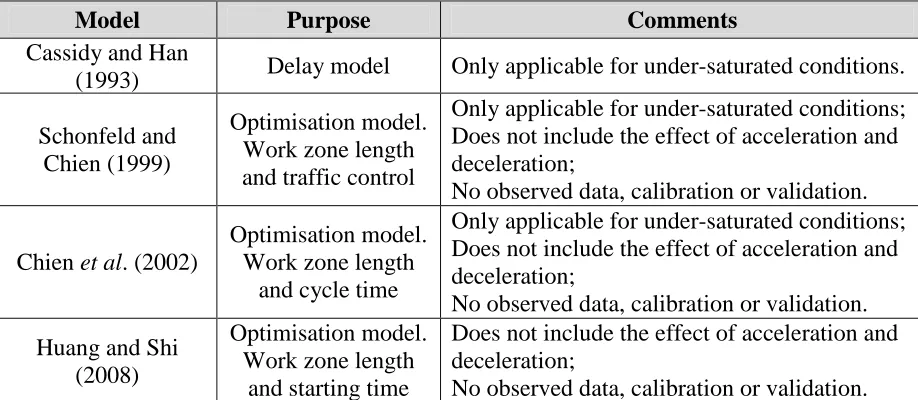
According to Schonfeld and Chien (1999) and Chien et al. (2002), both the Queensland Government (1988) and Highway Capacity Manual (HCM, 1985) cannot address the variety of problems, such as the optimal traffic control method selection at roadworks, although the responsible agencies have attempted to develop such guidelines.
P T E R T W O L IT E R A T U R E R E V IE W 2 1
Method of control Length of coned area (metres)
Maximum two-way
traffic flow (vehicle per hour)
Maximum speed limit (kph)
Considerations
No specified priority
(Give and Take)
(1) 60 (max)
(2) 15 (max)
(3) 50 (max)
(4) N/A
(1) 40
(2) 100
(3) 400 and 20 HGVs/hr
(4) 400
(1) 70
(2) 50
(3) 48 (30 mph)
(4) N/A
(1) Good visibility
(2) Good visibility
(3) Good visibility
(4) Low volume and good visibility
Signed Priority
(1) 100
(2) 50-100
(3) 80 (max)
(4) N/A
(1) 150 (vehicle/day)
(2) 400
(3) 840
(4) 400
(1) 60
(2) 50
(3) 96 (60 mph)
(4) N/A
(1) Only in good visibility
(2) N/A
(3) N/A
(4) Low volume and good visibility
Traffic signals
(1) N/A
(2) 400
(3) 300 (max)
(4) N/A
(1) No limit
(2) 800
(3) No limit
(4) N/A
(1) 60
(2) 50
(3) 96 (60 mph)
(4) 96
(1) N/A
(2) N/A
(3) N/A
(4) N/A
Stop/Go signs
(1) Not Used
(2) 400
(3) 500
(4) Controller sight distance
(1) Not Used
(2) 1,000
(3) 1,400
(4) N/A
(1) Not Used
(2) 50
(3) 96 (60 mph)
(4) 120
(1) Not Used
(2) N/A
(3) Check
(4) Table 2.7
Flagg Transfer
(1) Not Used
(2) Not Used
(3) Not Used
(4) 1,610 (1 mile)
(1) Not Used
(2) Not Used
(3) Not Used
(4) N/A
(1) Not Used
(2) Not Used
(3) Not Used
(4) N/A
(1) Not Used
(2) Not Used
(3) Not Used
(4) N/A
22
2.6
Effects of roadworks
Shuttle-lane roadworks have various effects on the road network and road users. Taking those impacts into consideration will determine the optimum management and operational methods. Detailed description of each type of the likely effects caused by shuttle-lane roadworks are provided in the following sections.
2.6.1 Restricted height or width
When applying shuttle-lane roadworks, the road width is subjected to a reduction (restriction) as mentioned in Table 2.1. Height restriction can also be imposed on drivers if the work is being carried out under a bridge. In both situations, warning signs should be provided at suitable distance to allow drivers to take extra care or to follow a diversion (Department for Transport, 2009).
2.6.2 Reduction in speed
Speed reduction at shuttle-lane roadworks sites are usually introduced for safety reasons. The speed limit can range between 30 mph to 60 mph. Department for Transport (2009) specified the speed limit for each type of hazard for high speed roads with speed limits of 50 mph or more (e.g. poor visibility, narrow lanes, etc.).
Traffic speed will inevitably be reduced in urban environment, because of the presence of busy roads and temporary speed limits might not be necessary except in certain circumstances.
The reduction in drivers’ speed at roadworks is also caused by the presence of traffic control devices where drivers have to take extra caution to reduce their speed to respond to such a control. Furthermore, the presence of queues at roadworks site will force drivers to reduce their speed and therefore increase in journey time.
2.6.3 Reduction in visibility
23 2.6.4 Interference with non-motorised road users
Shuttle-lane roadworks will usually affect the free movement of pedestrians, cyclists, vulnerable road users, which will force them to be diverted from their normal path to the carriageway. According to the Department for Transport (2009), this hazard should be minimised through the use of barriers or fences with the addition of lamps by night, which clearly warn the pedestrians of their presence and keep them away from the movement of the traffic providing safe a route/exit.
2.6.5 Interference with other junctions
In urban areas, junctions are usually located within a close proximity to each other. Shuttle-lane roadworks might cause enough queues to block back several junctions, which will cause delays to drivers which are not part of the roadworks traffic. Extra care should be taken when designing roadworks near junctions.
2.6.6 Reduction in capacity
Capacity is a very important measure which determines the maximum amount of traffic volume that can pass through the shuttle-lane roadworks in an hour. The appropriate identification of the system capacity will be used to calculate queues and delays resulted from capacity reduction.
Maze et al. (2000) stated that different methods of calculating capacity were noticed such as the Texas Transportation Institute (TTI), which defines capacity as the hourly traffic volume under congested traffic conditions. A Pennsylvania study defined work zone capacity as the hourly traffic volume converted from the maximum 5 minutes flow rate. A California study measured capacity by using 2-three minutes intervals separated by 1 minute. The value was then averaged and multiplied by 20 to convert to hourly value. It was also stated by Maze et al. (2000) that Dixon and Hummer (1995) defined capacity as the flow rate where traffic
changes from an uncongested to a congested condition. Jiang (1999) defined capacity as the flow just before a sharp drop in speed followed by a steady period of low speed and fluctuating traffic flow.
24
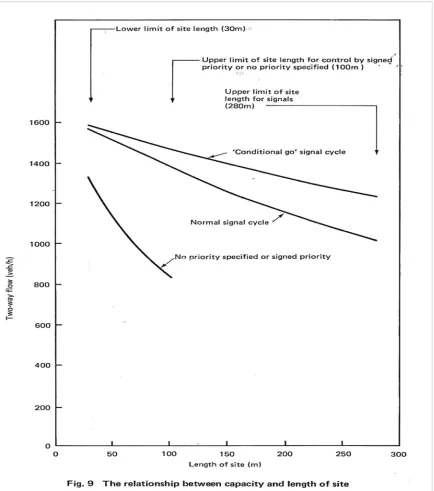
[image:46.595.82.516.171.662.2]It can be seen from Figure 2.9 that the maximum site capacity for no priority or priority specified operation is around 1290 veh/hr for two-way flow. For shuttle-lane roadworks operated by temporary traffic signals, the maximum site capacity achieved is 1590 veh/hr for two-way flow.
25 2.6.7 Increased delays
In Great Britain, delays at traffic signals are estimated to be 100 million vehicle-hours each year. If a saving of few percent was possible by using improved methods of operation, the financial savings each year would be considerable (Webster and Cobbe, 1966).
Delays and queues are the most important measures which determine the operational performance of roadworks. The overall delay due to shuttle-lane roadworks can be divided into two categories (Cassidy and Han, 1993):
1- Queuing delay; 2- Travel time delay.
The components of these delay categories are:
Delay according to the reduction in speed/capacity of shuttle-lane operation; Waiting time delay according to red light;
Move-up delay following a stopping situation (e.g. traffic signals, queues); Acceleration/deceleration delays.
Vehicle delay is the main parameter used to calculate the travel time cost of roadworks, which is then used for selecting optimum management and operational strategies.
2.6.8 Environmental effect
Traffic congestion (reduced speed and increased delays) contribute to a major part of the deteriorating urban air quality and pollution (Shefer, 1994). If urban roadworks are not designed appropriately, queues and delays are likely to form which could worsen air quality. More studies should therefore be carried out to show the effect of roadworks on urban air quality.
2.6.9 Safety effect
26
A study carried out by the Highways Agency (2011) showed that around 83% of drivers change their behaviour through roadworks. Various reasons were given to the change in behaviour such as trying to avoid accidents, reading signs, narrow lanes, etc. The above changed behaviour is caused by the change in road layout especially to unfamiliar drivers, which could lead to accidents at roadworks. Based on SWOV (2010), it has been noticed that fewer accidents are recorded at longer duration and longer site length in the Netherlands.
Various accident reduction studies were carried out (Allpress and Leland Jr, 2010; Xing et al., 2010 and Elghamrawy, 2011) to study and analyse the factors influencing the cause of
accidents at roadworks and suggesting methods and solutions to reduce the accident rates. SWOV (2010) mentioned that various measures could be taken to improve safety through roadworks such as demarcating the work area for traffic, guiding traffic through the roadworks site, making roadworks and workers visible to road users and simplifying the driving task.
Li and Bai (2009) carried out a study to test the effect of four shuttle-lane operation control methods on accident data using logistic regression analysis. It was found that flaggers/officers could considerably lower the odds of having severe accidents caused by human errors, while having stop signs/signals would dramatically increase the odds of having severe accidents. The study was based on limited data which was collected from the state of Kansas and will be unreliable to rule out those results on other states or countries.
Pilot study was carried out by the Isle of Man’s Department of Infrastructure (2012) by installing mobile CCTV on urban roadworks to reduce the drivers’ violation of crossing the red light on temporary traffic signals. If the pilot study is successful, it will be a requirement to install mobile CCTV cameras on all future roadworks.
2.6.9.1 Close following behaviour “tailgating”