comm
en
t
re
v
ie
w
s
re
ports
de
p
o
si
te
d r
e
se
a
rch
refer
e
e
d
re
sear
ch
interacti
o
ns
inf
o
rmation
A classification based framework for quantitative description of
large-scale microarray data
Dipen P Sangurdekar
*†
, Friedrich Srienc
*†
and Arkady B Khodursky
†‡
Addresses: *Department of Chemical Engineering and Materials Science, University of Minnesota, Saint Paul, MN 55108, USA. †Biotechnology
Institute, University of Minnesota, Saint Paul, MN 55108, USA. ‡Department of Biochemistry, Molecular Biology and Biophysics, University of
Minnesota, Saint Paul, MN 55108, USA.
Correspondence: Arkady B Khodursky. Email: [email protected]
© 2006 Sangurdekar et al.; licensee BioMed Central Ltd.
This is an open access article distributed under the terms of the Creative Commons Attribution License (http://creativecommons.org/licenses/by/2.0), which permits unrestricted use, distribution, and reproduction in any medium, provided the original work is properly cited.
Quantitative array data description
<p>A new classification-based framework is presented that allows quantitative description of microarray data in terms of significance of co-expression within any gene group and condition-specific gene class activity.</p>
Abstract
Genome-wide surveys of transcription depend on gene classifications for the purpose of data interpretation. We propose a new information-theoretical-based method to: assess significance of co-expression within any gene group; quantitatively describe condition-specific gene-class activity; and systematically evaluate conditions in terms of gene-class activity. We applied this technique to describe microarray data tracking Escherichia coli transcriptional responses to more than 30 chemical and physiological perturbations. We correlated the nature and breadth of the responses with the nature of perturbation, identified gene group proxies for the perturbation classes and quantitatively compared closely related physiological conditions.
Background
The advent of microarray technology has allowed parallel measurements of abundances of thousands of transcripts [1]. The obtained information has been used to describe and understand the transcriptional dynamics in the cell and gene-interaction networks. Such analysis can be reduced to several basic questions: which gene activity makes up a biological response; what are the common characteristics of those genes; and what is the molecular basis of those genes' co-expression? Analysis of multi-dimensional expression data is pivotal to such inferences, and a considerable volume of liter-ature has been published detailing various computational and statistical tools to analyze microarray data. Most of these pat-tern recognition methods involve classification of profiles of transcript abundances based on proximity or distance, in the expression data space or in a reduced basis space. Such clas-sifications usually yield groups of genes deemed to be co-expressed, and biological interpretations follow to deduce the physiological response of the cells [2-6].
Despite the popularity and wide applicability of these unsu-pervised techniques, biological significance of those clusters is sometimes difficult to assess because of uncertainties con-cerning the cluster membership and reproducibility. The clusters or patterns obtained generally consist of a set of genes enriched to various extents for a particular biological function/process/compartment along with genes that cannot be easily co-classified and are forced to fit into a cluster. Under different conditions, these genes may or may not be co-regulated, thus causing the cluster to lose its identity. This observation has spurred the development of condition-spe-cific classification of multiple or large-scale gene expression data. [7-11]. These algorithms largely involve partitioning the expression data into condition-specific groups, in which the expression of genes is most similar across the condition selected for a group. Segal et al. [12] demonstrated that expression data can be classified in terms of enriched func-tional modules and, moreover, these modules can be associ-ated with a regulatory program. Ihmels et al [9] proposed an
Published: 20 April 2006
Genome Biology 2006, 7:R32 (doi:10.1186/gb-2006-7-4-r32)
Received: 11 November 2005 Revised: 25 January 2006 Accepted: 15 March 2006 The electronic version of this article is the complete one and can be
iterative signature algorithm (ISA), in which the entire genome is scanned for groups of genes and conditions that together yield a high threshold score. This algorithm can be seeded with a biologically coherent group of genes, such as genes involved in a pathway, and the iterations will yield a refined module consisting of additional genes that may be associated with the query genes and a set of conditions that the genes are most co-regulated within. In these methods again, it is assumed that a particular program or module is associated with a biological function that is best co-regulated within a set of conditions. However, the ISA method struggles to find coherence within the classified groups, thus running into similar issues that clustering-based algorithms face. Fur-thermore, these module-based analyses (ISA [9], module maps [10]) only allow for a 'binary' expression program, wherein a group of genes is assumed to be changing direction once during each experiment. Consequently, certain time course experiments (cell-cycle, transient response, and so on) are treated as different conditions since genes change their expression non-monotonously. Importantly, none of these methods account for the background distribution of gene-specific expression, analogous to a statistical null hypothesis. Moreover, all these analyses circumvent the fact that DNA microarray data are noisy. It is desirable that any algorithm proposed to classify gene expression data addresses its sensi-tivity to background noise, bias and random fluctuations [13]. A systematic study on the effects of data structure, experi-mental dimensionality and noise levels on the results or reli-ability of classification techniques employed is yet to be seen. Classification of unlabeled data based on a training set of query genes is the basis for many supervised classification techniques, like support vector machines [14,15]. In these studies, groups of genes associated with a functional category or a particular transcriptional factor are learned from unclas-sified data. In an insightful analysis of functional classes in classification of microarray data, Mateos et al. [16] observed that only a small percentage of functional classes, derived from the Munich Information Center for Protein Sequences (MIPS), is 'learnable' through machine learning. The reason for this poor performance is attributed to class size (number of genes in the class), class heterogeneity (different members of a class vary their expression in different conditions) and functional interactions between different classes. The authors also observe that groups with low functional heterogeneity and less number of interacting links tend to be better classifi-ers, and that the behavior of functional classes might be a function of condition.
In this study, we propose a novel method based on a condi-tion-specific entropy reduction of functional groups to deter-mine well-defined physiological responses to diverse experimental treatments. This method does not rely upon any assumptions regarding the dataset, is based on a rigorous sta-tistical formalism, and takes advantage of pre-existing biolog-ical classifications to define an experimental result as a set of
enriched correlations (and hence, co-expression) for a number of annotated groups of biologically related genes. By measuring how the entropy of a pre-classified group of genes decreases as a function of a condition, we are able to classify transcriptional responses in terms of extent of co-expression of functionally related groups of genes. The expectation is that if genes forming a functional group are genuinely co-reg-ulated under a given condition, the transcriptional profiles of these genes in that condition will be better correlated than in a random assortment of microarray experiments. The group(s) of genes that satisfies this expectation is said to be active, or responsive, in that condition. The significance of entropy reduction of a group-condition is determined by standard statistical criteria, by comparing its activity to per-muted background correlation levels of the group. We are, therefore, able to form a coarse, but nonetheless very inform-ative, map of transcriptional responses to various treatments and conditions, and to directly compare two or more groups of genes or conditions. The method is amenable to incorpora-tion of new groups and condiincorpora-tions and flexible enough to allow ready determination of the statistical threshold above which the entropy reduction is termed significant.
Results
Characterization of transcriptional responses to experimental stimuli
Information contained in expression profiles and amplitudes of classified groups of genes is expressed as normalized activ-ity scores (described in Materials and methods). Conditions can be characterized on the basis of either their median class activity or the number and distributions of the high scoring classes. Median class activity for a condition refers to the overall performance of all queried classes in a condition, while the top scoring classes (at least one standard deviation away from the expected scores characterizing transcriptional activity of the class across the conditions and relative to other gene classes) constitute the characteristic transcriptional response for the condition. Low median class activity charac-terizes conditions that elicit specialized transcriptional responses. Those conditions include, but are not limited to, growth in chemostat at different growth rates, novobiocin, norfloxacin, ampicillin and CaCl2 treatment of the wild-type cells, as well as irradiation by UV light or gamma-rays and exposure to temperature upshift. On the other side of the spectrum are conditions in which the transcription of multi-ple classes of genes is affected (Figure 1). Those are exempli-fied by aerobic and anaerobic growth in batch cultures, recovery from stationary phase into LB (Luria-Bertani broth) or sodium-phosphate buffer, indole-acrylate and rifampicin treatments
comm
en
t
re
v
ie
w
s
re
ports
refer
e
e
d
re
sear
ch
de
p
o
si
te
d r
e
se
a
rch
interacti
o
ns
inf
o
rmation
scoring above zero. High scoring classes in a condition have been further dissected for highly correlated subsets of genes to establish the class expression profile and to infer interest-ing transcriptional trends from the data (described in Materi-als and methods). The conditions were analyzed within two general categories - 'Transient arrest and killing' and 'Growth and recovery'.
Transient arrest and killing
In this category, we analyzed and compared transcriptional responses triggered by inhibitors of translation (kanamycin), transcription (rifampicin), replication (norfloxacin and novo-biocin), and cell wall synthesis (ampicillin). Individual condi-tion responses are assessed by qualitatively comparing class scores for the condition. In kanamycin treated cells, the
[image:3.612.58.553.86.560.2]Median scores of experimental conditions classified into 'Growth and recovery' and 'Transient arrest and killing'
Figure 1
Median scores of experimental conditions classified into 'Growth and recovery' and 'Transient arrest and killing'. Experimental conditions classified into 'growth and recovery' (red vertical bar) and 'transient arrest and killing' (green bar). The conditions are ordered based on their median class activity scores. Conditions of growth and recovery score relatively high on the scale. Low scoring conditions (Sij < 0) are those that invoke limited mechanistic
responses, and comprise mostly severe arrest and killing type conditions. *Exceptions to the presented experimental classification of conditions. WT, wild type.
Growth
and recovery
Transient
arrest and
killing
-1
-0.5
0
0.5
1.0
1.5
Growth in LB
Recovery in LB - Early Growth - Anaerobic Recovery in LB - Late Recovery in Na-phosphate Transient arrest - Indole acrylate
Growth - anaerobic (fumarate) vs aerobic Transient arrest - Rifampicin in LB Transient arrest - Rifampicin in DMSO Recovery in Na-phosphate + glucose Growth - anaerobic versus aerobic
Growth - anaerobic (fumarate) versus aerobic
Severe arrest & killing - Norfloxacin (gyr resistant) 50 ug/ul Severe arrest & killing - Norfloxacin (gyr resistant) 15 ug/ul Severe arrest & killing - Kanamycin
Severe arrest & killing - Sodium azide Severe arrest & killing - Tryptophan starvation Severe arrest & killing - UV in
lexA-Severe arrest & killing - UV in WT
Severe arrest & killing - Norfloxacin in WT Suboptimal growth - pUC19 versus no pUC Severe arrest & killing - gyrBts at restrictive temp Growth - Balanced growth in NOX+ mutant Growth - Rapid time points
Severe arrest & killing - Novobiocin Transient arrest - CaCl2 wash Severe arrest & killing - Ampicillin Transient arrest - Gamma radiation Growth - Balanced growth in WT
Median activity score
Conditions
* * * *
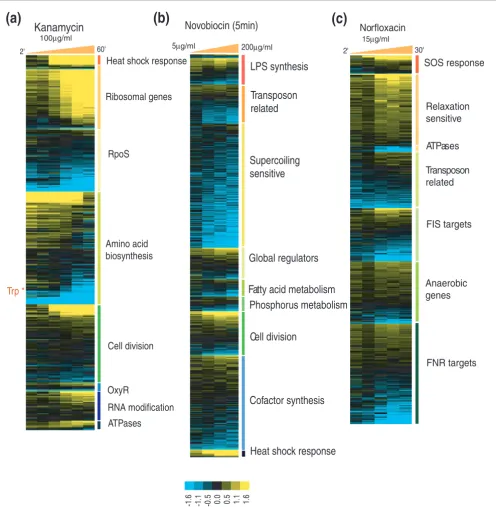
response is fairly specific, with heat shock response and ribosomal genes scoring highly among the queried genes. Other groups scoring above the mean in this condition are stress related (RpoS, OxyR), amino acid biosynthesis, cell division related, and genes involved in RNA modification (Figure 2a). Heat shock response in the kanamycin treatment is produced as a result of stalled translation [17]. Both classes
expectedly show above the threshold activity scores in this condition. More interestingly, heat shock response is also produced in other conditions of antibiotic and radiation treat-ment (novobiocin, norfloxacin in gyrase resistant strains, UV irradiation). However, these conditions are characterized by low ribosomal class activity, indicating the uncoupling of heat shock response from ribosomal protein synthesis when
[image:4.612.61.557.87.593.2]trans-Expression profiles of top-scoring classes for drug treatments
Figure 2
Expression profiles of top-scoring classes for drug treatments. Expression profiles of top-scoring classes (Sij > 1) for drug treatments: (a) Kanamycin, (b)
Novobiocin, (c) Norfloxacin treatment of the wild-type strain. Classes are sorted from top to bottom in descending order of their scores. A row of pixels corresponds to a single gene expression profile; a blue color indicates relative decrease in transcript abundance, and a yellow color an increase.
Heat shock response
Ribosomal genes
RpoS
Amino acid
biosynthesis
Cell division
OxyR
ATPases
Trp
*
Kanamycin
2' 60'
100µg/ml
RNA modification
5µg/ml
Novobiocin (5min)
LPS synthesis
Transposon
related
Supercoiling
sensitive
Global regulators
Fatty acid metabolism
Phosphorus metabolism
Cell division
Cofactor synthesis
Heat shock response
200µg/ml
SOS response
Relaxation
sensitive
ATPases
Transposon
related
FIS targets
Anaerobic
genes
FNR targets
Norfloxacin
15µg/ml
2' 30'
comm
en
t
re
v
ie
w
s
re
ports
refer
e
e
d
re
sear
ch
de
p
o
si
te
d r
e
se
a
rch
interacti
o
ns
inf
o
rmation
lation machinery has not been impacted directly. Another condition in which both classes are highly active is growth in LB, reflective of the fact that heat shock response is also gen-erated when cells are actively translating proteins. The pro-files for the two classes are strikingly different in the LB growth condition (and also recovery into LB from the station-ary phase), with heat shock response genes being upregulated during the early exponential phase and also during the early stationary phase, while the expression of ribosomal genes decreases with time (Figure S1 in Additional data file 1). The genes involved in amino acid biosynthesis represent another interesting class in the kanamycin treatment. When we searched this class for correlated profiles of subsets of genes, we observed that genes related to tryptophan biosyn-thesis (aroM, trpCDE, aroH, tyrA). [18] make up a profile that is anti-correlated with that of the ribosomal genes (Figure 2a).
Novobiocin is a coumarin antibiotic that inhibits ATPase activity of the DNA gyrase [19]. As a result of novobiocin action, DNA gyrase fails to introduce negative supercoils into relaxed or positively supercoiled DNA. When cells are treated with novobiocin, the top scoring classes are lipopolysaccha-rides (LPS) synthesis, transposon related, supercoiling sensi-tive genes, global regulators, fatty acid metabolism, phosphorus metabolism, cell division related, cofactor syn-thesis and heat shock response (Figure 2b). The supercoiling sensitive (SS) genes comprise a group of about 200 genes whose expression is dependent on negative DNA supercoiling [20]. SS genes are significantly downregulated in novobiocin treatment, indicating the inhibition of gyrase function by novobiocin. Additionally, SS genes are upregulated in a con-certed manner during anaerobic growth and recovery into LB from stationary phase (data not shown; see scores in Addi-tional data file 3), and they are significantly upregulated by UV irradiation of the wild-type strain (but not in lexA- cells) (Figure S2 in Additional data file 1).
Norfloxacin is a quinolone antibacterial that primarily poi-sons DNA gyrase and topoisomerase IV, leading to DNA dam-age. [21]. In wild-type cells, norfloxacin treatment is accompanied by changes in transcriptional activity of DNA damage and recombinational repair (SOS) genes, relaxation sensitive genes (79 genes induced upon DNA relaxation [20]), ATPases, transposon related, targets of FIS, a nucleoid asso-ciated transcriptional regulator as well as anaerobic genes and targets of FNR, a regulatory gene for fumarate nitrite, nitrate reductases and hydrogenase (Figure 2c). Thus, it appears that in addition to the transcriptional responses associated with known norfloxacin effects, such as topoi-somerase-mediated DNA damage and inhibition of uncon-strained supercoiling [22], it also affects genes whose activity is controlled by FIS, a component of a supercoiling-depend-ent regulatory network and a likely mediator of constrained supercoiling in the cell [23]. In comparison, norfloxacin
treat-ment in gyrase resistant strains affects transcription of genes related to energy metabolism (tricarboxylic acid (TCA) cycle, electron transport, amino acid catabolism) and division (nucleotide synthesis, DNA replication, cell division), apart from the SOS response (Figure S3 in Additional data file 1). This is the only case we are aware of where mutating a drug target leads to a shift, rather than an abrogation, in transcrip-tional response. This finding is also intriguing because it has been previously observed that secondary mutations render-ing quinolone resistance map in the genes of the TCA cycle [24,25]. Furthermore, treatment in resistant strains is char-acterized by high scores for heat shock response and low scores for relaxation-sensitive genes as the state of DNA supercoiling is not affected in these mutants by the used drug concentrations (data not shown).
Ampicillin treatment induces a response (Sij > 1) (see Materi-als and methods for details of the score calculation) from arginine biosynthesis, sulfur assimilation, amino acid biosyn-thesis and the LRP (Leucine response protein) regulon. The top scoring classes for other antibiotic treatment conditions are listed in Additional data file 2.
Growth and recovery
Experiments in this category could be grouped as: anaerobic growth on glucose in M9 media; growth and recovery from stationary phase into LB supplemented with glucose; recov-ery from stationary phase into sodium phosphate (Na-phos-phate) buffer with and without glucose; balanced growth at different growth rates in chemostats (wild type and with NADH oxygenase (NOX+) overexpression); recovery in
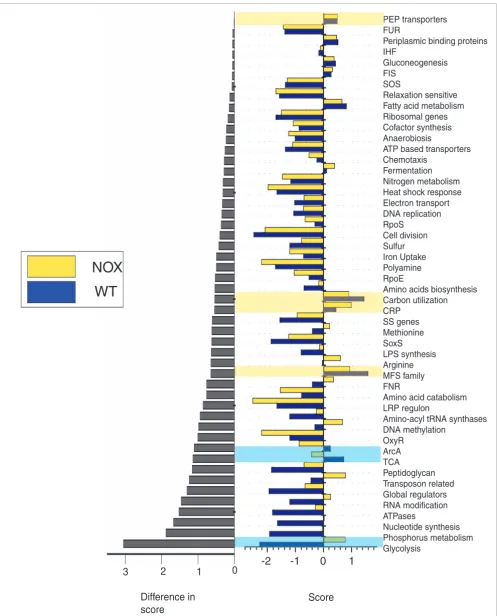
mini-mal medium following UV and gamma-rays treatment. Most growth experiments are characterized by a large number of classes (>90%) having a positive activity score. Classes that score relatively high in these conditions are related to protein synthesis (ribosomal genes, amino acid biosynthesis), carbon and energy metabolism (TCA, glycolysis, electron acceptors), nutrient uptake and assimilation, global and redox stresses (RpoS, RpoE, polyamine biosynthesis, ArcA, OxyR) and transport proteins (ATP family, Major Facilitator Super-family, PhosphoEnolPyruvate PhosphoTransferase Systems). When compared to growth experiments in batch conditions, growth in a chemostat under balanced conditions is characterized by lower overall class activity. Also, the top scoring classes in both balanced growth experiments (wild type and NOX+) are groups involved in utilization of
Figure 3 (see legend on next page)
3
Score
Difference in
score
1
2
PEP transporters FUR
Periplasmic binding proteins IHF
Gluconeogenesis FIS
SOS
Relaxation sensitive Fatty acid metabolism Ribosomal genes Cofactor synthesis Anaerobiosis
ATP based transporters Chemotaxis
Fermentation Nitrogen metabolism Heat shock response Electron transport DNA replication RpoS
Cell division Sulfur Iron Uptake Polyamine RpoE
Amino acids biosynthesis Carbon utilization CRP
SS genes Methionine SoxS LPS synthesis Arginine MFS family FNR
Amino acid catabolism LRP regulon
Amino-acyl tRNA synthases DNA methylation
OxyR ArcA TCA
Peptidoglycan Transposon related Global regulators RNA modification ATPases
Nucleotide synthesis Phosphorus metabolism Glycolysis
0
NOX
WT
comm
en
t
re
v
ie
w
s
re
ports
refer
e
e
d
re
sear
ch
de
p
o
si
te
d r
e
se
a
rch
interacti
o
ns
inf
o
rmation
scoring SoxS regulon, whose genes show upregulation during the treatment, suggesting that cells might also be sensing a superoxide stress. Similarly, gamma radiation can be charac-terized by activity of the OxyR group and amino acid biosyn-thesis. As in the norfloxacin treatment, gamma radiation treatment induces a relatively narrow range of responses, as reflected in the low median class activity scores for these con-ditions (Additional data file 2).
Class activity across conditions
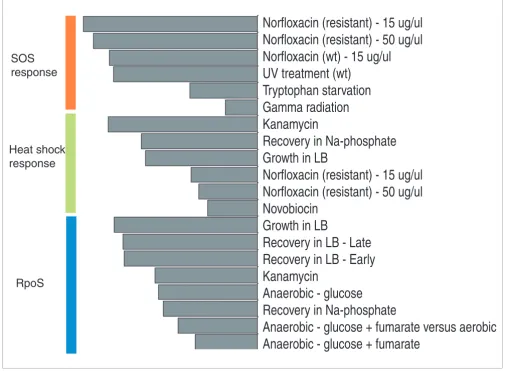
Apart from individual experiments, it is informative to look at conditions in which classes are co-expressed best. For exam-ple, high activity of the SOS class of genes (Sij > 1), indicating the sensing of DNA damage by the cells, was observed in a limited number of conditions, including UV and gamma irra-diation, norfloxacin (in wild-type and resistant strains) treat-ment and in tryptophan starvation (Figure 4). In these conditions, the SOS class had a score above 1, while none of the other conditions had a score greater than 0.5 for the class, indicating a clear demarcation in conditions where the response is induced. For the heat shock response class, the top scoring conditions (Sij > 1) were treatments of kanamycin, novobiocin, norfloxacin in gyrase resistant strains, growth in LB and recovery in Na-phosphate buffer. While certain drug treatments and exponential growth in rich medium are accompanied by a characteristic heat shock response, it is not clear why this response is induced (transient upregulation) in recovery conditions in LB and Na-phosphate (Figure S1 in Additional data file 1). The less specific stress response class of RpoS is most active in growth and recovery in LB, anaero-bic growth, in recovery in Na-phosphate (but not in recovery in glucose added phosphate buffer) and in the kanamycin treatment. When we searched the RpoS class for a subset of highly correlated genes, a group of nine genes (aidB, cbpA, osmY, poxB, dps, hdeA, hdeB, xasA, gadA, gadB, adhE) was found to be significantly correlated (median correlation >0.6) across all conditions tested. The profile of this subgroup dur-ing different growth and recovery conditions (Figure S4 in Additional data file 1) indicates that these particular genes are downregulated whenever cells are supplied with abundant nutrients and exposed to kanamycin treatment, and are upregulated whenever cells approach the stationary growth phase.
Comparison of conditions
Class scores can be compared for different conditions and it can be particularly revealing in comparisons where condi-tions are similar to each other. Comparisons can be made by assessing the difference in class scores in two conditions, or by grouping together conditions, which are expected to elicit
phenotypically similar responses. For example, we can com-pare conditions of recovery into LB at an early (OD 0.5) or later (OD 1.0) stage. The recovery at higher density is charac-terized by differential activities of amino acid catabolism, sul-fur assimilation, PEP based transporters, phosphorus metabolism, FNR, fermentation, OxyR, SoxS, gluconeogene-sis, FUR and ArcA, indicating that cells are undergoing the onset of global nutrient limitation along with redox imbal-ance (Figure S5 in Additional data file 1). The early recovery condition is characterized by cell wall synthesis (RpoE, LPS synthesis), energy generation (ATPases), supercoiling state related classes (FIS, IHF (Integration Host Factor), relaxa-tion-sensitive), ribosomal genes, amino acid and nucleotide biosynthesis and nitrogen assimilation. Thus, cells early in the growth stage coordinate their regulation towards growth and division, whereas at later points cells encounter nutrient starvation and redox related stresses. Furthermore, recovery-stage dependent induction of RpoS, anaerobic genes, nucle-otide synthesis genes and ribosomal genes indicate that the starvation response is fairly independent of the culture's age and history.
Similarly, comparison between the wild-type and NOX+
mutant in balanced growth conditions revealed that TCA and ArcA classes are more active in the wild type, while overex-pression of NADH oxygenase (NOX+) causes activation of
gly-colysis, which is the largest difference in the two conditions (Figure 3, highlighted in blue). NOX (encoded by the NADH oxygenase gene from Streptococcus pneumoniae) acts as a NADH sink to regenerate the oxidative potential of NAD+,
thus allowing glucose to be completely metabolized in the cell and relieving the repression of ArcA two-component system (GN Vemuri, DS, ABK, unpublished data). Commonly acti-vated classes in both conditions include the PEP and MFS family of transporters and carbon utilization related genes (highlighted in yellow).
For group comparisons, conditions are classified into three meta-groups based on their phenotypical responses, and classes are sorted for their median activity in the conditions constituting the group. Unlike pairwise comparison of condi-tions, top scoring classes in a group of conditions constitutes a common 'signature' response for that group. The first group consists of growth and recovery conditions (growth in LB, early and late recovery in LB, recovery in sodium phosphate buffer and glucose-supplemented sodium phosphate buffer; Figure S6 in Additional data file 1). This group is character-ized by high activity scores (in decreasing order) for amino acid catabolism, arginine biosynthesis, nitrogen metabolism, RpoS, RNA modification, polyamine synthesis, LRP regulon,
Comparative analysis of class activity scores across balanced growth conditions
Figure 3 (see previous page)
nucleotide synthesis, amino acid biosynthesis, PEP trans-porters, chemotaxis, FIS targets, iron uptake, relaxation sen-sitive, ribosomal genes and ATPases. Two of the least scoring classes for this group are CRP (cAMP receptor protein) and carbon utilization, with the exception of recovery experi-ments in sodium phosphate and glucose-supplemented sodium phosphate, indicating the lack of carbon stress in the growing cells. Arginine biosynthesis genes and the RpoS sub-group mentioned in the previous section have a role in acid resistance of cells at the onset of the stationary phase [26]. Comparison of recovery profiles under different conditions (early or late, in buffer with or without glucose) shows inter-esting trends. Ribosomal genes, RNA modification genes, polyamine synthesis and ATPases are expressed as a strong function of growth conditions and energetic state of the cell. Amino acid biosynthetic genes, with the exception of
methio-nine, glutamine and tryptophan synthesis genes, are repressed in all conditions
The second group consists of treatments by drugs whose modes of action are not known to damage DNA. This group includes conditions of sodium azide, ampicillin, indole acr-ylate and kanamycin treatments, and it is characterized by high scores for amino acid biosynthesis, arginine synthesis, LRP regulon, peptidoglycan, sulfur assimilation OxyR, nucle-otide synthesis and heat shock response (Figure S7 in Addi-tional data file 1). The third group includes DNA damaging conditions of norfloxacin treatment, UV radiation (in wild-type and lexA- mutant), gamma radiation and novobiocin
treatment. Not surprisingly, SOS response is by far the top scoring class in this group (with the notable exception of novobiocin treatment and UV treatment in lexA-), followed
[image:8.612.55.560.92.463.2]Conditions associated with different stress responses
Figure 4
Conditions associated with different stress responses. Top-scoring conditions for three classes: SOS response, heat shock response and RpoS targets. SOS is active in known DNA damaging conditions only (with the exception of tryptophan starvation); RpoS is active in growth conditions (with the exception of the kanamycin treatment), while heat shock response is active in the mixture of conditions.
Norfloxacin (resistant) - 15 ug/ul
Norfloxacin (resistant) - 50 ug/ul
Norfloxacin (wt) - 15 ug/ul
UV treatment (wt)
Tryptophan starvation
Gamma radiation
Kanamycin
Recovery in Na-phosphate
Growth in LB
Norfloxacin (resistant) - 15 ug/ul
Norfloxacin (resistant) - 50 ug/ul
Novobiocin
Growth in LB
Recovery in LB - Late
Recovery in LB - Early
Kanamycin
Anaerobic - glucose
Recovery in Na-phosphate
Anaerobic - glucose + fumarate versus aerobic
Anaerobic - glucose + fumarate
SOS
response
Heat shock
response
comm
en
t
re
v
ie
w
s
re
ports
refer
e
e
d
re
sear
ch
de
p
o
si
te
d r
e
se
a
rch
interacti
o
ns
inf
o
rmation
by heat shock response, cell division genes, DNA replication and supercoiling sensitive genes (Figure S2 in Additional data file 1).
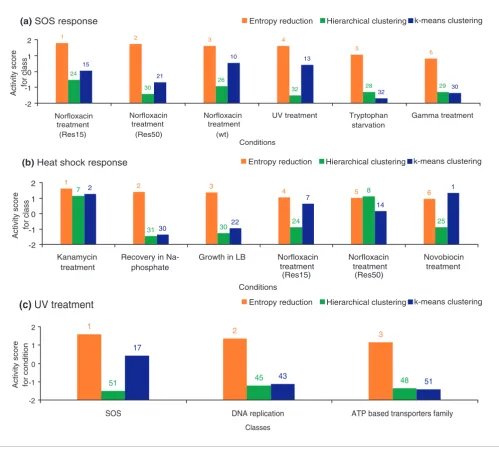
Comparison with other classification techniques To evaluate the utility of the entropy reduction analysis, we compared the performance of the proposed method with standard unsupervised learning methods [27], such as k-means and hierarchical clustering, and with a more recent technique known as the signature algorithm (SA) [28]. For clustering, we devised a comparable metric (described in Materials and methods) to score the activity of each class (condition) learned from a particular clustering result for a condition (class). For the purposes of illustration, we limited our comparison here to the classes and conditions, SOS and heat shock responses and UV treatment, whose underlying physiology is well understood, thus providing us with a good set of biological expectations. We compared the scores obtained from clustering and the entropy-reduction method for the SOS and heat shock classes of genes, which are expected to produce transcriptional responses in the condi-tions of DNA damage and growth perturbacondi-tions, respectively. The comparison revealed that the conditions that are known to cause DNA damage (among all of the tested conditions, five treatments have been specifically set up to elicit this type of response) score consistently on top of the other conditions and higher than they score based on the clustering solutions (Figure 5a). Similar results have been obtained with the heat shock response genes (Figure 5b). Thus, despite a strong expectation that expression of the SOS and heat shock genes should be affected by several conditions, clustering failed to identify these conditions within the dataset. For individual conditions, the entropy-reduction based method is more suc-cessful than clustering in identifying top scoring classes that constitute known biological responses to a condition. This is illustrated by a comparative application of the methods to a condition of UV irradiation (Figure 5c). The comparison dem-onstrated that, unlike in the entropy reduction method, nei-ther the SOS nor DNA metabolism class of genes score high in clustering methods, contrary to the prior biological expecta-tion. Furthermore, classes that are deemed to be significantly different by clustering tend to have lower amplitudes (data not shown), thus reflecting the importance of using both amplitude and profile features to gauge activity of a class. Next, we compared our method with the SA, a technique that relies on amplitude of expression to refine a seeded group of genes [28]. SA also identifies arrays (that is, a single time point in a condition) in which the group is most activated. By definition, our method differs from the SA: unlike the SA method, our technique maintains the integrity of classes and conditions, scores classes across an entire spectrum of condi-tions and condicondi-tions across all the classes, and the scores are a function of the amplitude, correlation and background expression of the dataset. To compare the performance of the SA with our method, we examined two criteria: how well a
particular class is refined by iterating the algorithm; and which conditions are over-represented in the top scoring arrays for a class in SA after the above iterations. Some classes (for example, DNA replication, RNA modification) produced empty sets after iteration, indicating that some classes need to be analyzed as a whole, which cannot be done by clustering or SA. A list of illustrative examples of classes that remained stable is provided in Additional data file 4. The entropy reduc-tion method retained a class subset that is at least equal to that retained by SA for most classes, and in some cases (for example, ribosomal genes, DNA replication, RNA modifica-tion, SOS response), it was much higher. Moreover, while SA captures most conditions that our method identifies as most active, it misses out on some biologically relevant examples. Such examples include kanamycin treatment for ribosomal genes (Figure 2a), novobiocin and norfloxacin treatments for heat shock response and recovery in sodium-phosphate buffer for the RpoS group of genes. Furthermore, given avail-able biological evidence, some conditions deemed as differen-tially affecting certain classes of genes appear to be erroneously classified by the SA. The most striking among them is the classification of sodium azide treatment as the highest scoring SOS specific condition: neither the available experimental data (not shown) nor close examination of the transcriptional patterns of the SOS genes in the condition warrants such an inference. Additionally, in this version of the algorithm, seeding arrays (or conditions) to identify top scoring genes (and hence classes) to identify top responses in specific treatments is not possible, something that can readily be achieved by our technique.
out the identity of a set (condition), proves to be more versatile and reliable in classifying non-binary or heterogene-ous responses than clustering or signature algorithm.
Discussion
One of the motivations for doing genome-wide analysis of transcription is to be able to predict the transient state of the cell based on the activity of genes. Ideally one would like to be able to establish a correspondence between a condition,
envi-ronmental or genetic, and a transcriptional state of the cell; for example, in the simplest of cases, if a gene X changes its activity, it is likely that cells have been subjected to a pertur-bation Y. While surveying a multitude of controlled condi-tions for the sake of interpreting the uncontrolled ones may not be practical, in principle it should be possible to obtain a representative sample of conditions that would allow us to: describe individual surveyed condition(s) in terms of gene activity; and present gene activity as a molecular proxy of a particular condition(s). Towards this goal, we obtained and
[image:10.612.58.557.88.537.2]Comparison of the entropy reduction method with standard clustering techniques
Figure 5
Comparison of the entropy reduction method with standard clustering techniques. (a) Normalized activity scores for SOS response. (b) Normalized activity scores for heat shock response class. The scores from entropy reduction (orange bar) and clustering (k-means (blue), k = 10, and hierarchical (green)) methods are shown. The conditions on the ordinate are top scoring conditions sorted by scores obtained from the entropy method. The ranks for the class for each condition and in each method are listed on top of the respective bars (c) Normalized activity scores for classes in UV treatment condition obtained from entropy reduction and clustering methods; classes are sorted by activity scores from the entropy method. The ranks for each class in the condition and in each method are listed on top of the respective bars.
(a) SOS response
6 5
4 3
2 1
30 24
26
32 28 29
15
21
10 13
32 30
-2 -1 0 1 2
Norfloxacin treatment
(Res15)
Norfloxacin treatment
(Res50)
Norfloxacin treatment
UV treatment Tryptophan
starvation
Gamma treatment
Conditions
Activity score
for class
(b) Heat shock response
6 5
4 3
2 1
31 7
30 24
8
25
2
30
22
7
14
1
-2 -1 0 1 2
Kanamycin treatment
Recovery in Na-phosphate
Growth in LB Norfloxacin treatment
(Res15)
Norfloxacin treatment
(Res50)
Novobiocin treatment
Conditions
Activity score
for class
(c)
UV treatment
1 2
3
48
51 45 43 51
17
-2 -1 0 1 2
SOS DNA replication ATP based transporters family
Classes
Activity score for condition
Entropy reduction Hierarchical clustering k-means clustering
Entropy reduction Hierarchical clustering k-means clustering
Entropy reduction Hierarchical clustering k-means clustering
comm
en
t
re
v
ie
w
s
re
ports
refer
e
e
d
re
sear
ch
de
p
o
si
te
d r
e
se
a
rch
interacti
o
ns
inf
o
rmation
analyzed expression data for more than 3,600 genes in the genome of E. coli in more than 30 conditions.
Our analysis is predicated on the notion that rationalization of a transcriptional response is possible only in terms of the already available or emergent information about the groups of genes. The current study took advantage of the breadth of available information about the physiology of E. coli bacteria. We used functional and regulatory classifications of genes and their products to evaluate the transcriptional activity within and across groups of related genes. We were also able to describe the examined conditions in terms of transcrip-tional activity of gene families. The choice to analyze tran-scriptional responses in the classified groups of genes was dictated by the following. First, given a large number of sur-veyed genes and a relatively small number of responses, the transcriptional behavior of a group of related genes, where relatedness can be defined by various biological criteria, is likely to be more informative than that of an individual gene. Second, transcriptional patterns obtained by either super-vised or unsupersuper-vised techniques are being widely inter-preted in the context of the already available information about the genes whose respective classes are more repre-sented in the pattern [29]. Such an approach implies a certain degree of co-regulation within the families of genes that have been used to derive the biological meaning of discovered pat-terns. This assumption about co-regulation has never been explicitly tested. Thus, the third reason, evaluating the degree and homogeneity of co-regulation within the annotated gene families, is of considerable practical and biological interest. Furthermore, any hypothesis regarding a group of unrelated genes, for example, connected pathways, can be tested simply by querying that group in this analysis. Any new condition can likewise be queried for its characteristic response profile from the existing classes.
In this study, we have proposed a novel method for assessing condition-specific co-regulation of pre-classified functional groups based on reduction in Shannon entropy for a group of genes. Previously, some biological studies have used entropy to develop classifiers for microarray data, identify biases and patterns in protein and DNA sequences and to predict drug targets [30-34]. Here, the entropy concept is used to assess the degree of coherence in the expression pattern of function-ally related genes in a given condition. This coherence is hypothesized to be a systematic result of class and condition related trends, and this hypothesis is verified or rejected by randomization of classes and conditions. This degree of coherence allows for description and comparison of class-condition behavior on a continuous information scale. By identifying functional classes that show a significant degree of co-expression, large-scale microarray data can now be mean-ingfully characterized, without relying on assumptions about underlying structure of the data.
The scope and number of surveyed conditions also allowed us to determine whether the observed changes in expression are condition specific and whether the conditions themselves were distinct enough to be characterized by a specialized transcriptional response. The approach proposed in the cur-rent study has at least two advantages compared with other methods, which analyzed condition-specific transcriptional patterns. [9,10]. First, condition-specific responses were quantified using a composite metric reflecting both the amplitude of a transcriptional response as well as the infor-mation content of a transcriptional profile. Second, the distri-bution of transcript abundances across all examined conditions was used to assess the background information in transcriptional profiles for a specific condition. The differ-ence between a condition-specific profile and the background activity allows for a rather natural and straightforward way of describing the relative activity of a group of genes. Third, the activity score does not rely heavily on the classification accu-racy on the whole, since enhanced correlations in class sub-sets often 'carry' the class, regardless of the lack of correlation in the remaining genes.
By applying this method to a set of experimental conditions, we were able to validate several beliefs regarding physiologi-cal responses to certain stimuli, as well as to discover new trends. For example, cells under normal growth conditions or recovering from the stationary phase are able to co-ordinate genome-wide functional activities, whereas cells under severe stress are significantly less capable of doing so. Cells growing at different balanced growth rates adjust only a part of their metabolic activities to cope with different doubling efficiencies. Drug treatments that are known to affect DNA integrity produce responses dominated by groups of genes involved in DNA metabolism (SOS response and DNA repli-cation). Under conditions of nutrient starvation or stationary phase, cells activate genes related to general stress response, nitrogen limitation and acid resistance. Classes were used as molecular proxies to partition the condition space - SOS (DNA damage versus no damage) and RpoS (growth versus non-growth). Condition-specific correlational links were dis-covered between functional classes, for example, ribosomal genes correlate with heat shock genes conditionally. Overall, this approach provides a unique and elegant tool for generat-ing the blueprint of transcriptional response to external stim-uli. It also provides a platform for further investigations by using significantly co-expressed classes and their subsets as candidates for machine learning and supervised classification.
activity of pre-assigned groups of genes we could see that transcriptional activity of the genome can be described through a contribution of multiple functional groups of genes on an essentially continuous information scale. Such a 'con-tinuum' of transcriptional activity across genes in a genome may serve as the basis for inherent flexibility of transcrip-tional programs. Whereas it may limit the usefulness of genome-wide monitoring of gene expression for screening purposes, it likely offers a more adequate representation of the biology of the system.
Materials and methods
Overview of experimental conditions
All experiments were carried out using the MG1655 genetic background from American Type Culture Collection 47076. Relative transcript abundances were measured under condi-tions of normal growth, sub-optimal growth, transient arrest and recovery and in severe arrest and killing. The following experimental conditions were tested (a detailed summary of comparisons is available in Additional data file 8).
Normal growth
During 'normal growth', we tested: the growth curve under anaerobiosis in M9 salts supplemented with 0.2% glucose with or without fumarate as an electron acceptor (24 array-hybridizations, 6 time point comparisons with and without fumarate against two different common references; details of labeling and references are presented in Additional data file 7); the growth curve under aerobic conditions in LB supple-mented with 0.2% glucose (11 array-hybridizations, 11 time points along the curve compared to a common reference); recovery of cells from the 24 hours old stationary LB culture into LB + 0.2% glucose at two different inoculum densities (14 array-hybridizations, 7 comparisons against common refer-ence each); recovery of the cells from the 24 hours old station-ary LB culture into Na-phosphate buffer, pH 7.5, at an inoculum OD600 of approximately 0.5; and recovery into Na-Pi buffer supplemented with 0.2% glucose.
Sub-optimal growth
During 'sub-optimal growth', we tested: transient heat-shock treatment (four time points); indole acrylate (IAA) mild star-vation at two concentrations of IAA (four time points each); the limited growth curve of the cells harboring pUC19 (five time points); and UV-untreated controls of the wild-type and lexA- cells that were handled similarly to the experimental
sample but not treated with the UV light [39] (four time points).
Transient arrest
During 'transient arrest', we tested: UV treatment in the wild type (five time points); gamma-ray treatment in the wild type (five time points); Norfloxacin treatment in gyrArparCr at
two different sub-lethal concentrations [20] (ten time points); early stationary cells in LB (six time points); 0.1 M
CaCl2 treatment in the cold (seven time points); and 0.5% DMSO treatment (two time points).
Severe arrest and killing
During 'severe arrest and killing', we tested: treatment with 0.01 M sodium azide (four time points); tryptophan starva-tion in the auxotrophic strain (three time points); UV treat-ment of the SOS-uninducible lexA3 mutant (five time points); treatment of wild-type E. coli with Norfloxacin at lethal con-centrations (five time points); treatment of wild-type E. coli with different bactericidal concentrations of Novobiocin (four comparisons after 5 minutes of treatment); shift of the gyrBTs
to restrictive temperature (four time points); Rifampicin treatment (500 ug/ml) in LB (five time points) and in M9 + 0.2% glucose (seven time points) [40]; Ampicilin treatment (100 ug/ml) in M9 + 0.2% glucose (six time points); and Kan-amycin treatment (100 ug/ml) in M9 + 0.2% glucose (six time points).
General microarray procedures
We amplified 4,290 E. coli open reading frames (96.4% aver-age success rate) using primer pairs from Sigma Genosys (St Louis, MO, USA). EtOH precipitated amplification products were printed on glass surfaces to produce whole-genome DNA microarrays using an in-house 16-tip robotic spotter as described in [41]. Following a print (the data presented in this communication were collected on slides from eight different prints) slides were post-processed as described in [41] and stored in a dark dry environment until hybridization. Total RNA extraction, RNA labeling via direct Cy-dye incorporation into cDNA and array washing were performed as described elsewhere [42]. A 16-bit TIF image was acquired using a GenePix scanner (Axon Instruments, Molecular Devices, Sunnyvale, CA) and analyzed using GenePix software. Raw data of previously published experiments, including UV, rifampicin and norfloxacin treatments, and tryptophan star-vation by indole acrylate, have been deposited in the Stanford Microarray Database. [43].
Data preparation
comm
en
t
re
v
ie
w
s
re
ports
refer
e
e
d
re
sear
ch
de
p
o
si
te
d r
e
se
a
rch
interacti
o
ns
inf
o
rmation
quality' genes were removed from consideration following the analysis of distributions of spot regression coefficients, inten-sities and diameters. Of the filtered out genes, 77% encode hypothetical proteins.
The experimental dataset consists of log ratio intensity values for G E. coli genes measured in M cDNA microarray hybridi-zations. The M arrays correspond to different treatment levels or times in k experiments such that:
where Nj refers to the number of arrays in the jth experiment.
Before collating the data set, values from individual arrays were pre-processed for each experiment, such that means in the arrays are centered on zero. In the case of replicate arrays, average values were considered so that each value with co-ordinates (gi, rnj) represents the gene expression of gene gi in unique treatment rnj (corresponding to the nth array in
exper-iment j). For the purpose of this analysis, experiments with less than three arrays (or treatments) were not considered, since meaningful correlations can only be derived from a minimum of three data points.
Query classes
Query classes are groups of genes that are pre-arranged based on some functional relationship. These categories and their corresponding genes were compiled from different publicly accessible E. coli databases, including EcoCyc [44], Monica Riley's functional categories at GenProtEC [45] and Regu-lonDB [46]. The classes chosen for the analysis represent var-ious aspects of cellular physiology and metabolism; selected classes include carbon metabolism (glycolysis, TCA cycle, car-bon utilization), DNA metabolism (nucleotide synthesis, DNA replication and degradation, DNA methylation), RNA related (RNA modification), energy metabolism (fermenta-tion related, aerobic respira(fermenta-tion, anaerobic respira(fermenta-tion, elec-tron transport, oxidative phosphorylation), nutrient uptake and utilization (iron, sulfur, nitrogen, phosphorus), protein synthesis, folding and repair (ribosomal components, amino acid metabolism aminoacyl tRNA synthases, chaperones and proteases), cell division, stress response (SOS response, heat shock response), transport proteins and transcriptional fac-tor targets (RpoS, ArcA, SoxS, OxyR, RpoE, CRP). The size of classes refers to the number of member genes in a class, which typically varied from 10 to 100 genes. A total of 1,642 genes were queried in this analysis, of which 1,104 genes uniquely belonged to a single class, 390 genes belonged to 2 classes and 148 belonged to 3 or more classes. Of the 1,965 genes not included in the classification, 1,466 genes are either unclassified or unknown genes, as described by Riley's classi-fication [45]. The remaining genes either belonged to classes defined purely on the basis of compartmentalization or to loosely defined families of proteins, or to classes with less than five gene members. A list of classes queried along with
corresponding genes is given in Additional data file 5. Any set of genes within this range can be queried in this analysis if there is a hypothesis regarding their co-expression. Examples of such classes can include stable clusters obtained from clus-tering of individual or meta-datasets, or genes belonging to one or related pathways of interest, or genes having a com-mon upstream sequence motif. The choice of query classes could depend on the nature of the experiment and the prior expectations regarding the outcome.
Shannon entropy
Entropy in thermodynamic terms refers to the degree of dis-order in the system. Claude Shannon [47] defined the concept of entropy H in information theory as the degree of uncer-tainty associated with an information source (equation 1):
where L stands for the number of states and pi corresponds to the probability of occurrence in state i. An entropy value of 0 stands for a state of high probability and that of 1 corresponds to a highly disordered state with high uncertainty and the state that needs the most amount of information to describe it. The general idea was applied by Alter et al. [4] to describe the information contained in the principal eigenvectors obtained by singular-value decomposition (SVD) of a micro-array data set. A brief description of the SVD procedure is given in Additional data file 6. Highly ordered and noiseless datasets, with 1 or 2 dominant patterns of behavior, have low entropy, whereas noisy and randomly behaving genes constitute a high-entropy dataset. The concept of entropy has also been applied elsewhere in microarray data analysis to recursively develop a feature-rich training set for classifica-tion [30,48] and to validate clustering methods [29]. In this method, we evaluated the reduction of entropy within a pre-classified group of genes as a function of condition. Functionally related genes will co-express in certain condi-tions and not in others. Their enhanced co-expression, or cor-relation, in a condition will cause the matrix of g × Nj log-ratios (g ∈G) to be decomposed onto fewer eigenvectors, thus causing the Shannon's entropy to be reduced from the univer-sal or background entropy that the group possesses [4]. To get an estimate of the background entropy of the group, the entropy is iteratively calculated for the same group of genes across the same number of arrays picked at random from the dataset (Figure 6). The percentile reduction of entropy for a class is then determined as the number of iterations in which the condition-specific entropy is lower than the randomized group entropy (equation 2):
M= Nj
i=1 k
∑
H pi pi
i Nj
= −
( )
∑
=( )
11
log L log
Pijarray= percentile of entropy reduction for i class in
th jj experiment over randomly selected arrays for i class
th th
A high percentile reduction value means that condition-spe-cific class entropy is significantly lower than that of universal (background) class entropy.
The same evaluation is done for a group of genes randomly sampled from the genome for the same condition (equation 3):
Here, a high percentile reduction value means that the condi-tion-specific class entropy is significantly lower than the background condition entropy. High percentile reduction val-ues, for both sets of entropies, implies that genes from a given class are correlated better than expected by chance given available sets of array experiments and expression profiles.
Amplitude of gene expression
Genes that are highly correlated (and low in entropy) could be those that do not change their activity level at all during an experiment. Also, these could correspond to imputed values in the gene expression dataset. Since genes that do not change their amplitude will be trivially decomposed onto an eigen-vector of zero magnitude, such groups will have low entropies and high percentile reduction values. To avoid getting biolog-ically meaningless results, the amplitude of gene expression is considered as the second descriptor of condition-specific class activity. The amplitude of a gene is defined as the sum of squares of expression log-ratios of a gene in the particular condition (equation 4):
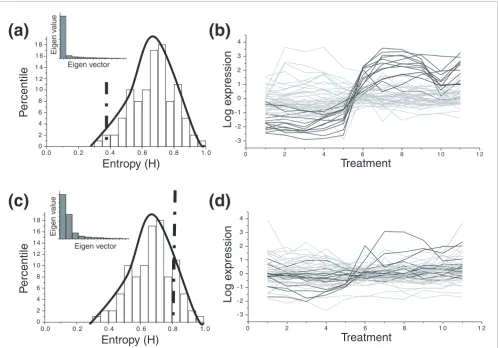
[image:14.612.60.558.86.433.2]Distributions of entropy values for an active and randomized class-condition
Figure 6
Distributions of entropy values for an active and randomized class-condition. (a) Distribution of randomized entropies for an 'active' class-condition pair. The actual entropy for the class is denoted by a vertical line. The percentile counts for the class correspond to the area of the distribution to the right of the dotted line. (b) Expression profiles of an active class-condition. The darker gray lines indicate a highly correlated subset in the group. For an 'active' class-condition, a significant portion of the gene members are co-expressed, leading to lower class entropy (see the Scree plot of eigenvalues in the inset). (c) Distribution of entropies for the 'inactive' class-condition. (d) Expression profiles of the 'inactive' class-condition. Darker lines are relatively few compared to lighter ones, as identified by SVD.
0 2 4 6 8 1 0 1 2 1 4 1 6 1 8
0 2 4 6 8 1 0 1 2
- 3 - 2 - 1 0 1 2 3 4
0 2 4 6 8 1 0 1 2
-3 -2 -1 0 1 2 3 4
(a)
(d)
(c)
(b)
0 .0 0. 2 0 .4 0. 6 0 .8 1. 0
0 2 4 6 8 1 8
Entropy (H)
1 0 1 2 1 4 1 6
P
ercentile
P
ercentile
Eigen vector
Eigen v
alue
Eigen vector
Eigen v
alue
Treatment
Log e
x
pression
Log e
xpression
Treatment
0 .0 0. 2 0 .4 0. 6 0 .8 1. 0
Entropy (H)
Pijgene=
percentile of entropy reduction for i class in jth tth th
experiment
over randomly selected genes in j experimennt
= ( > )
count Hrand j, Hij
Aij rkn g G
n N
k g j
=
( )
(
∈)
= =
∑
∑
21 1
comm
en
t
re
v
ie
w
s
re
ports
refer
e
e
d
re
sear
ch
de
p
o
si
te
d r
e
se
a
rch
interacti
o
ns
inf
o
rmation
where Aij is the total amplitude of class i in experiment j, rkn is the log-ratio of gene k in array n and Nj is the number of arrays in experiment j. Similar to entropy reduction, ampli-tude gain for a class is defined as the percentile of condition-specific gain in amplitude for the class-condition over the background (equations 5 and 6):
A combined percentile score is calculated by adding the indi-vidual percentile scores for gene-wide and array-wide entropy reduction and amplitude gain (equation 7):
Finally, the scores are normalized to zero mean and a stand-ard deviation of 1 for conditions (equation 8):
where is the standard deviation of the scores for all classes within a condition.
Class subset Identification
For classes that show significant entropy reductions (scores above 1), subsets of highly correlated genes were identified. These genes are responsible for maximum reduction in entropy for the class since their profile is represented by a sin-gle vector. This is particularly insightful in larger and more heterogeneous classes, such as genes controlled by global regulators that have varied functions and ontologies. The pur-poses of identifying the subset are: to establish an expression profile for that class; and to collect genes that 'carry the class' in a condition for the purposes of machine learning. Since a class is identified on the basis of its high score, it is expected such a filtered class would be enriched for a single expression profile that can be seen in the gene subset. The expression profile not only allows a visual interpretation of a class's response to a condition, but also indicates whether the signif-icant correlation within a class is supported by a substantial change in gene expression values. The class-subset identifica-tion is done by finding genes that correlate maximally with the principal eigenvector of each low-entropy class.
Comparison with clustering
Using functional annotation to assess physiological responses has its advantages over standard clustering followed by func-tional interpretations. Clusters are defined to be funcfunc-tionally enriched if a particular class (or classes) is statistically
over-represented in the cluster. To analyze which classes are 'learnable' by clustering techniques, we applied the principle of information theory to clustering. We utilize the metric of class-cluster entropy or mutual information ( , where i refers to ith class, C refers to clustering result in jth condition)
to assess which class and how enriched it is in a clustering result [29]. The class-cluster entropy, referred to as mutual information MI for clarity, for a condition reflects how dis-tributed a class is across all resulting clusters in that condi-tion. A lower MI value would indicate that most of the genes in a class are members of one (or few clusters), and a higher entropy value would indicate a wider distribution (equation 9):
where Hij(A) indicates the total entropy of a class in a cluster-ing result and Hij(A|C) indicates the conditional entropy of the class given the clustering result.
Similar to a percentile value defined for class-condition, we define a percentile value for class-cluster by randomizing arrays (equation 10) and clustering each randomized dataset:
where HAC refers to the mutual information of a class in a
cluster result. A higher percentile count for a class in a given condition would indicate that: the class is represented in fewer clusters in a condition (enrichment); and the enrich-ment is specific for a condition over the background for the class. The percentile count is then normalized for a given class over all conditions to define an activity score based on cluster-ing results (equation 11):
The choice of clustering technique was k-means and hierar-chical (complete linkage) clustering with Euclidean distance metric over a range of cluster numbers k (6 to 10). This choice was dictated by a previous study that showed that k-means clustering performed better than hierarchical clustering and was comparable to SOM (self-organizing feature map) for a number of datasets, and the optimal cluster number was found to be between 7 and 10 [29].
Comparison with the signature algorithm
The SA was seeded with classes, and these were refined with a recurrence level of 70% and minimum occurrence of 70% [28] till the set was stable. The number of top scoring arrays for these classes was considered as the maximum of 40 or the number of arrays having scored greater than 50. The
enrich-Aijgene=
percentile of amplitude gain for i class in j th theexperiment
over randomly selected genes in j experimentth
=count A( rand j, <Aij)
Aij
array= percentile of amplitude gain for i class in jth th experiment over randomly selected arrays for i classth
= ( < )
count Ai rand, Aij
Sij Pij P A A
gene
ijarray ijgene ijarray
= + +4 +
Sij Sij mean Si j Si j
= − ∀
∀
[ ( )]
σ
σSi j∀
HijAC
HijAC=
Mutual information content for class i in cluster resuult C obtained in condition j
=Hij( )A −Hij(A C| )
PCijarray=
percentile of class-cluster entropy reduction forr i class in j experiment over randomly selected array
th th ss for i classth
=count H( i randAC, >HijAC)
Sijcluster PCij mean PC array
i jarray
Si jcluster
= − ∀
∀
[ ( )]