Tow a r d s t h e d e v elo p m e n t of a n
EIT-b a s e d s t r e t c h a b l e s e n s o r fo r
m u l ti-t o u c h i n d u s t r i al h u m a
n-c o m p u t e r i n t e r a n-c ti o n s y s t e m s
R u s s o, S, N e f ti-M e zi a ni, S, G ul r e z, T, C a r b o n a r o , N a n d To g n e t ti, A
h t t p :// dx. d oi.o r g / 1 0 . 1 0 0 7 / 9 7 8-3-3 1 9-4 0 0 9 3-8_ 5 5
T i t l e
To w a r d s t h e d e v elo p m e n t of a n EIT-b a s e d s t r e t c h a b l e
s e n s o r fo r m u l ti-t o u c h in d u s t r i al h u m a n-c o m p u t e r
in t e r a c ti o n s y s t e m s
A u t h o r s
R u s s o, S, N e f ti-M e zi a n i, S, G ul r e z, T, C a r b o n a r o , N a n d
To g n e t ti, A
Typ e
C o nf e r e n c e o r Wo r k s h o p I t e m
U RL
T hi s v e r si o n is a v ail a bl e a t :
h t t p :// u sir. s alfo r d . a c . u k /i d/ e p ri n t/ 4 2 8 2 0 /
P u b l i s h e d D a t e
2 0 1 6
U S IR is a d i gi t al c oll e c ti o n of t h e r e s e a r c h o u t p u t of t h e U n iv e r si ty of S alfo r d .
W h e r e c o p y ri g h t p e r m i t s , f ull t e x t m a t e r i al h el d i n t h e r e p o si t o r y is m a d e
f r e ely a v ail a bl e o nli n e a n d c a n b e r e a d , d o w nl o a d e d a n d c o pi e d fo r n o
n-c o m m e r n-ci al p r iv a t e s t u d y o r r e s e a r n-c h p u r p o s e s . Pl e a s e n-c h e n-c k t h e m a n u s n-c ri p t
fo r a n y f u r t h e r c o p y ri g h t r e s t r i c ti o n s .
Impedance Tomography
Stefania Russo1(✉), Nicola Carbonaro2, Alessandro Tognetti2,3, and Samia Nefti-Meziani1
1 Autonomous System and Robotics Research Centre, University of Salford, Manchester, UK
{s.russo1,s.nefti-meziani}@salford.ac.uk
2 Research Centre E. Piaggio, University of Pisa, Pisa, Italy
{nicola.carbonaro,a.tognetti}@centropiaggio.unipi.it
3 Department of Information Engineering, University of Pisa, Pisa, Italy
Abstract. Electrical Impedance Tomography (EIT) is a method used to display, through an image, the conductivity distribution inside a domain by using meas‐ urements taken from electrodes placed at its periphery. This paper presents our prototype of a stretchable touch sensor, which is based on the EIT method. We then test its performance by comparing voltage data acquired from testing with two different materials, using the performance parameters Signal-to-Noise Ratio (SNR), Boundary Voltage Changes (BVC) and Singular Value Decomposition (SVD). The paper contributes to the literature by demonstrating that, depending on the present stimuli position over the conductive domain, the selection of elec‐ trodes on which current injection and voltage reading are performed, can be chosen dynamically resulting in an improved quality of the reconstructed image and system performance.
Keywords: Electrical Impedance Tomography · EIT · Drive patterns · Stretchable sensors
1
Introduction
EIT is a method that utilises electrodes placed at the periphery of a conductive body for both injecting a small current inside the conductive domain, and measuring the conse‐ quently induced potentials. The EIT method is mostly applied in clinical applications [1], but it can be used to create artificial sensitive skins by using thin, conductive and flexible fabric materials that respond to a mechanical solicitation by changing their internal resistance. The main advantage of such EIT systems is the possibility to achieve a stretchable sensor without internal wires, which can be easily mounted over 3D and deformable surfaces showing multi-touch sensing capabilities [2]. In literature, some other EIT applications are for damage detection [3] and pressure sore prevention [4].
The main issue with EIT is its low resolution, being an inverse ill-posed problem [5] where the aim is to reconstruct the internal conductivity based on the voltages which are measured at the boundary. For this reason, recent studies [6–8] have focused on developing different drive patterns for current excitation and voltage reading in order to
© ICST Institute for Computer Sciences, Social Informatics and Telecommunications Engineering 2017 P. Perego et al. (Eds.): MobiHealth 2016, LNICST 192, pp. 337–344, 2017.
improve the image resolution and object distinguishability. Being a drive pattern a strategy that selects the electrodes pairs on which current injection and voltage reading are performed, it affects system performance as different current injections result in different current density distribution across the transducer, and different voltage readings influence how big of a portion of the material is been read. However, these studies have not considered the correlation between drive patterns and the contact position of the input stimuli.
This work describes a comparison of different performance parameters of three drive patterns for EIT. The results are compared according to the location of the input stimuli.
2
Materials and Methods
2.1 EIT for Artificial Sensitive Skin
EIT works by minimising the difference between the voltages measured at the periphery of a conductive body, and a model called forward operator which predicts these values [3]. In the EIT method, measurements are conducted initially without any load in order to get a set of baseline potentials V0 and a difference imaging technique is then performed by comparing V0 and measurements taken once a load is applied. Then, the forward operator is linearized around an initial known conductivity σ0, giving the solution:
𝜕V≈J𝜕𝜎+w. (1)
Where 𝜕V represents the difference between the measured voltages, w represents the noise, and J is the Jacobian matrix that relates the voltage across the electrodes to the changes in electrical conductivity within the medium when a known current is applied. The Jacobian matrix has many entries which are close to zero, and they create numerical sensitivity when reconstructing the conductivity σ. This is solved by approx‐ imating the solution through regularisation [9], assuming that the conductivity inside the medium is changing smoothly. A common regularization method is the Tikhonov regularization, which provides the following solution:
𝛿𝜎= (JTJ+𝛼2Q)−1(JT𝜕V).
(2)
Here, α is a hyper-parameter that controls the extent of regularisation, and Q is a combination of regularisation matrices controlling the “smoothness” of the solution. The calculation for the forward model and the Jacobian along with setting parameters α and Q is done only once at the start, while the reconstruction of the internal conductivity is performed on-line each time a voltage data set is acquired.
2.2 EIT Fabric Sensor and Hardware System
is an EEONTEX™ conductive stretchable fabric from Eeonyx Corporation; it is a knitted nylon coated with doped polypyrrole (PPY) which is an inherently conducting polymer.
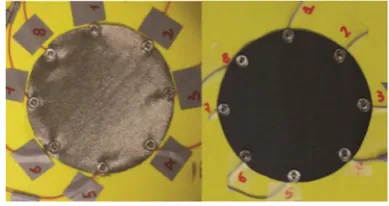
[image:4.439.128.323.166.269.2]Both sample materials were cut into a circular shape of 10 cm diameter, where 8 stainless steel electrodes were pierced equidistantly. The materials were then placed in a fixture presenting a soft foam support at the bottom in order to reduce the sensitivity to stretching in the vertical axis when a load is applied. The two sensors are shown in Fig. 1.
Fig. 1. On the left, conductive Medtex fabric and on the right EEONTEX™ conductive fabric.
A typical EIT hardware is made of a constant current generator, a switching mech‐ anism for current injection and a data acquisition (DAQ) unit for voltage measurements. The schematics of our hardware design are shown in Fig. 2. We developed a constant current source supplied with 5 V. The output of the circuit is connected to the multiplexer stage used for current injection switching. A National Instruments USB-6353 DAQ card
[image:4.439.86.370.383.561.2]was used for power supply, differential voltage readings and controlling multiplexers. Our hardware design guarantees a straightforward switch between drive patterns and change between different current amplitudes.
Being the calculated surface resistance of the sensors approximately 30 Ω for sensor #1 and 30 KΩ for sensor #2, current amplitudes of 0.9 mA and 0.9 μA were applied respectively.
In contrast to previous works [10, 11] where 4 multiplexers were used, we only used 2 for controlling the current injection pattern, while voltage readings were acquired in differential mode by the DAQ, therefore reducing settling time and electrical noise. The multiplexers are used for limiting current flow to one of their 8 channels; one of the multiplexers was used as a current sink, while the other one as a current source. Each of the multiplexers is controlled via 3 variables which are set using the DAQ at each injection step, by changing the output voltage on its digital lines.
In our work we will use three drive patterns made out of different combinations of current injection and voltage reading modalities: first, in the adjacent drive (AD) pattern, the current injection is performed between adjacent electrodes, while voltages are read on the remaining electrodes. This is performed progressively until each pair of adjacent electrodes has received a current injection. Secondly, in pseudo-polar (PP) drive patterns, the first injection is performed between a pair of electrodes, where the elec‐ trodes are opposite to each other, with one of them shifted one electrode to the side. The voltage readings are taken through pairs of neighbouring electrodes. Lastly, the PP-PP pattern is the one where the current injection and voltage readings have the same distri‐ bution of electrodes as when performing PP current injection.
2.3 Theoretical Considerations
One of the main aspects of an EIT system is the quality of the measured voltage changes. Three performance parameters inspired by [6] have been used for assessing the quality of the voltage data and the Jacobian, in order to evaluate the transducer sensitivity to the applied stimuli, prior to the image reconstruction stage.
The first parameter is the SNR which is extensively used for judging the quality of the signal and thus, the system performance. It is a ratio between the desired signal and the level of the unwanted background noise. The formula used is:
SNR= −20log10√|E[Vi]|
Var(Vi)] (3)
Where E[Vi] is the mean of multiple measurements on each channel and Var(Vi) the variance between these measurements.
The second parameter expresses the BVC, having V0 containing the voltage data set which was used as a reference and V1 the boundary voltages measured after a conduc‐ tivity change takes place due to an input stimuli. We consider that the preferred drive pattern is one that maximises the BVC. The BVC is calculated as:
BVC=‖‖V1−V0‖‖ (4)
Lastly, the third parameter is the rank of the Jacobian, accessible through SVD by looking at the singular values of the Jacobian. The rank is expected to be higher for the drive pattern which brings more information, thus showing a better accuracy of the inverse solution.
2.4 Experiments
We carried out 3 experiments on both sample materials, where we applied stimuli in 3 different positions using the presented drive patterns to determine which is optimal.
A 2 cm radius non-conductive load of 400 g is applied during each test in different locations. We will call P1 the experiment conducted with the load close to electrodes 1–2, P2 when the pressure is applied in the centre of the conductive medium and P3 when a two-point contact pressure is applied close to electrodes 1–2 and 5–6.
3
Results and Discussion
3.1 Performance Parameters
In Table 1, the mean SNR for the two sample materials is shown for the three drive patterns. The results indicate that the PP-PP pattern has the best performance in terms of SNR compared to the other patterns, since a current flowing crosswise in almost opposite electrodes presents an increased density, and so improves the SNR to the same extent of noise of the other drive modalities.
Table 1. SNR for sample material #1 and #2. All values are displayed in dB Sample #1 Sample #2
AD PP PP-PP AD PP PP-PP
Mean SNR 30.9 39.4 48.1 35.8 42.5 43.5
Table 2. BVC for sample material #1 and #2. All values are displayed in mV Experiment Sample #1 Sample #2
AD PP PP-PP AD PP PP-PP P1 6.8 3.5 7.3 16.3 7.9 14.2 P2 6.7 7.8 6.4 12.8 15.0 5.9 P3 10.8 12.9 15.3 9.2 15.2 15.4
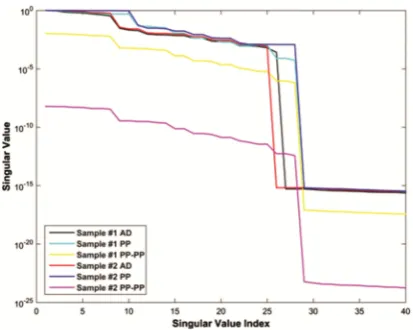
The SVD has been applied to show how different drive patterns influence to what extent the problem can be considered as ill-posed. The plots in Fig. 3 display a sharp decrease in the singular values, evidently showing that the PP pattern for both samples has less sensitivity of solution to small changes in the voltage data. The rank of the Jacobian is equal to the number of non-zero singular values; here, there is a certain amount of singular values that are close to zero, which have no numerical meaning and are indication of noise. For this reason, the rank of the Jacobian is calculated by inves‐ tigating the singular values spectra, and finding the singular value position where the fastest decrease in value results. The rank of J for the AD, PP and PP-PP patterns are respectively 26, 28, 28 for sample material #1, and 25, 28, 28 for sample material #2, thus confirming that the PP and PP-PP patterns present an inverse solution with better accuracy.
Fig. 3. Normalised SV of the Jacobian on a logarithmic scale for the two samples with AD, PP and PP-PP patterns.
3.2 Image Reconstruction
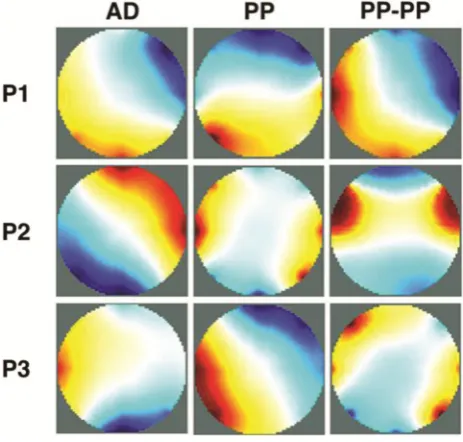
After performing the experiments, the voltage data were sent to an open source MATLAB toolkit (EIDORS software algorithm [12]), which through the use of the finite element method, reconstructs the image of the conductivity changes inside the transducer. Figure 4
experiments, where we see that the drive patterns that perform best at the different loading scenarios are the AD pattern for P1, PP for P2, and PP-PP for P3.
Fig. 4. Reconstructed images for different drive patterns in the case of P1, P2 and P3 load. The area in blue shows a decrease in conductivity due to the applied load. AD pattern shows an improved performance for P1, PP for P2 and PP-PP for P3. The blurred areas in the pictures are due to the high hysteresis of the materials. (Color figure online)
4
Conclusion
In this study, we compared the performance of three drive patters for EIT. Our experi‐ mental results indicate that, in order to improve the resolution and quality of the recon‐ structed image, it is preferable to dynamically change the injection and reading modal‐ ities accordingly to the location of the input stimuli. Therefore, the selection of the most appropriate drive pattern will result in more accurate excitations and readings over that specific region of the conductive material, enabling the performance optimisation of an EIT system. Our future work includes developing a 16 electrode system with a further investigation on the optimisation strategies of drive patterns which will lead to more accurate EIT systems.
References
1. Bodenstein, M., David, M., Markstaller, K.: Principles of electrical impedance tomography and its clinical application. Crit. Care Med. 37(2), 713–724 (2010)
2. Silvera-Tawil, D., Rye, D., Soleimani, M., Velonaki, M.: Electrical impedance tomography for artificial sensitive robotic skin: a review. IEEE Sens. J. 15(4), 2001–2016 (2015) 3. Tallman, T.N., Gungor, S., Wang, K.W., Bakis, C.E.: Damage detection and conductivity
evolution in carbon nanofiber epoxy via electrical impedance tomography. Smart Mater. Struct. 23(4), 045034 (2014)
4. Knight, R.A., Lipczynski, R.T.: The use of EIT techniques to measure interface pressure. In: Annual International Conference of the IEEE Engineering in Medicine and Biology Society, pp. 2307–2308 (1990)
5. Holder, D.S.: Electrical Impedance Tomography Methods. History and Applications. CRC Press, Boca Raton (2004)
6. Xu, C., Dong, X., Shi, X., Fu, F., Shuai, W., Liu, R., You, F.: Comparison of drive patterns for single current source EIT in computational phantom. In: 2nd International Conference on Bioinformatics and Biomedical Engineering, pp. 1500–1503 (2008)
7. Silvera Tawil, D., Rye, D., Velonaki, M.: Improved EIT drive patterns for a robotics sensitive skin. In: Australasian Conference on Robotics and Automation (2009)
8. Demidenko, E., Hartov, A., Soni, N., Paulsen, K.D.: On optimal current patterns for electrical impedance tomography. IEEE Trans. Biomed. Eng. 52(2), 238–248 (2005)
9. Lionheart, W.R.B.: EIT reconstruction algorithms: pitfalls, challenges and recent developments. Physiol. Measur. 25, 125–142 (2004)
10. Bera, T.K., Nagaraju, J.: A LabVIEW based data acquisition system for electrical impedance tomography (EIT). In: Pant, M., Deep, K., Nagar, A., Bansal, J.C. (eds.) Proceedings of the Third International Conference on Soft Computing for Problem Solving. AISC, vol. 259, pp. 377–389. Springer, New Delhi (2014). doi:10.1007/978-81-322-1768-8_34
11. Soleimani, M.: Electrical impedance tomography system: an open access circuit design. Biomed. Eng. Online 5(28), 28 (2006)
12. Adler, A., Lionheart, W.R.B.: Uses and abuses of EIDORS: an extensible software base for EIT. Physiol. Measur. 27(5), S25 (2006)