Munich Personal RePEc Archive
The role of NAFTA and returns to scale
in export duration
Besedes, Tibor
Georgia Institute of Technology
16 November 2011
Online at
https://mpra.ub.uni-muenchen.de/34779/
The Role of NAFTA and Returns to Scale in
Export Duration
∗
Tibor Besedeˇs
†Georgia Institute of Technology
November 16, 2011
Abstract
While exports within NAFTA face a lower hazard of ceasing, its onset has increased the hazard for Mexican and U.S. intra NAFTA exports. Intra NAFTA exports still enjoy a lower hazard relative to exports to non–members. While NAFTA did affect the hazard for Canada’s exports in the short run, its effect on Mexican and U.S. exports is persistent. Exports of IRS manufacturing products face the highest hazard in the case of Canada and Mexico, while IRS natural resource products have the highest hazard for Mexico. The effect of NAFTA on the returns to scale product types is exporter specific.
Keywords: hazard; export survival; returns to scale; NAFTA
JEL Codes: F10, F14
∗This paper was prepared for the CESifo Economic Studies Conference on Measuring Economic
Integration. I thank CESifo for financial assistance and Jeffrey Bergstrand, Yoto Yotov, and partic-ipants of the conference on useful suggestion. All remaining errors are my own.
†School of Economics, Georgia Institute of Technology, Atlanta, Georgia 30332-0615,
1
Introduction
The North American Free Trade Agreement (NAFTA) expanded the Canadian U.S.
Free Trade Agreement (CUSFTA) to include Mexico. One argument in favor of
CUSFTA was the well known source of welfare gains in trade models incorporating
economies of scale—namely that tariff–free access to the large U.S. market will allow
Canadian firms to expand production, take advantage of economies of scale, and
increase productivity resulting in welfare gains for both producers and consumers.
Trefler’s (2004) influential work has shown that the effect of CUSFTA was precisely
as predicted by economy of scale models. CUSFTA initiated a contraction of low
productivity plants resulting in a 12 percent decrease in employment, but also ushered
a period of rising labor productivity increasing it by 15 percent.
Creation and expansion of free trade areas create new opportunities for firms to
begin exporting their products. Little attention has been paid to NAFTA’s effect on
the ability of NAFTA members’ firms to successfully maintain their exports to the
NAFTA area. The goal of this paper is to assess the effect NAFTA has had on the
hazard exports ceasing for the three member countries and to assess whether the effect
of NAFTA is related to returns to scale in production, given one of the arguments in
favor of NAFTA was rooted in returns to scale. I use annual exports disaggregated
at the 6-digit Harmonized Schedule level between 1990 and 2007 for Canada, Mexico,
and the United States.
The effect of CUSFTA/NAFTA on productivity is one aspect of the agreements
to have been investigated. Trefler (2004) showed that Canadian industries that
ex-perienced the largest tariff cuts enjoyed largest productivity gains. Romalis (2007)
shows that the two free trade agreements have had a substantial effect on the
vol-ume of trade, but a much smaller effect on prices and welfare. Much work has been
devoted to identifying whether CUSFTA and NAFTA were trade creating or
divert-ing. Clausing (2001) found that CUSFTA was primarily trade creating, while Trefler
(2004) found evidence of both trade diversion and trade creation, with creation the
dominant force. Romalis (2007) raised the possibility of a substantial trade diversion
effect of NAFTA/CUSFTA which may be responsible for increased North American
output and prices in once highly protected sectors.
Other researchers have focused on the effects of NAFTA/CUSFTA on the
exten-sive margin. Kehoe and Ruhl (2009) found that especially in cases of thin trade
relationships, such as between Canada and Mexico prior to NAFTA, trade
liberaliza-tion is a key ingredient in sparking the growth of the extensive margin, an important
source of new trade. Debaere and Mostashari (2010) find a small effect of trade
lib-eralization on the extensive margin of U.S. imports for the 1989–1999 and 1996–2006
periods.
I begin by providing a descriptive analysis of the evolution of exports of NAFTA
members in a novel way. As the main focus of the paper is the hazard of exports
ceas-ing, only data on newly created trade relationships can be used to evaluate it. In the
descriptive analysis I differentiate between new and old export relationships, where
old are all relationships active in 1990, the first year in the data, while new are all
relationships created after 1990. After the descriptive analysis of new and old export
relationships, I present a simple motivating model along the lines of Melitz (2003)
and then estimate the hazard of exports ceasing.
I find that exports of each NAFTA member to other members face a much lower
hazard of ceasing than their exports to non-members. The onset of NAFTA itself
has increased the hazard of Mexican and U.S. exports to fellow NAFTA members
ceasing and had no net effect on the hazard of Canadian exports to other NAFTA
members ceasing. In terms of differences across the nature or returns to scale, exports
of increasing–returns–to–scale manufacturing products face the highest hazard in the
case of Canada and Mexico, while in the case of the U.S. that distinction belongs to
there significant differences in the hazard for all three product types, with increasing–
returns–to–scale products having the lowest hazard.
The intra NAFTA exports of the three returns–to–scale product types are affected
differently for each member by the onset of NAFTA. In the case of Canadian exports
NAFTA has increased the hazard for both increasing–returns–to–scale products, but
not in a statistically meaningful way. In the case of Mexico, NAFTA has had the
strongest effect on the hazard of exports of IRS manufacturing products ceasing,
increasing it, while it did not increase the hazard exports of IRS natural resource
and CRS products ceasing in a statistically significant manner. NAFTA has had the
strongest effect on every returns–to–scale type product exported by the U.S.,
signif-icantly increasing the hazard of exports of such products ceasing to other NAFTA
members, especially for both increasing returns to scale types. The effect of NAFTA
has not been consistent over time, as it has increased the hazard in some three–year
periods after its onset and not in others.
The role of returns to scale and free trade agreements in duration of exports has
not been examined to date. Thus, this paper makes a contribution to the duration of
trade literature in addition to making a contribution to the literature on the effects of
NAFTA. Duration of trade was first examined by Besedeˇs and Prusa (2006a, 2006b)
who noted that most U.S. import relationships are short lived and that differentiated
products are exported to the U.S. in longer lasting relationships than homogeneous
goods. Besedeˇs (2008) showed that uncertainty in international trade and its effect
on relationship formation as modeled by Rauch and Watson (2003) can account for
many features of duration data. Nitsch (2009) has found similar results for German
imports, while Brenton, Saborowski, von Uexkull (2010) and Fugazza and Molina
(2009) find similar conclusions for a larger set of countries. Cadot et al. (2010)
for four African economies and G¨org, Kneller, and Murak¨ozy (2008) for Hungary
reach similar conclusions for firm–level exports. Hess and Persson (2010a) examine
duration of EU imports, while Besedeˇs examines how the hazard of exports ceasing
of Eastern European transition economies was affected by the transition processes.
Jaud, Kukenova, and Stireborny (2009) examine the relationship between financial
constraints and duration of trade. Besedeˇs and Prusa (2010) provide a summary of
the duration of trade literature.
2
Data
I use data on Canadian, Mexican, and U.S. export flows recorded at the 6-digit
Harmonized Schedule (HS) level. Data for Canada and Mexico come from the UN
Comtrade database, while data for the U.S. were aggregated from 10-digit HS level
data available from the U.S. Census U.S. Exports CDs/DVDs. I use annual data
between 1990 and 2007 for all three countries. In each year I identify new export
relationships, converting annual data into spells of active exporting, and track them
until they cease to be active. A spell reflects the number of consecutive years during
which a relationship is active. A relationship is defined as the instance of a
coun-try exporting a 6-digit HS product to another councoun-try, such as Mexican exports of
“Monumental/building stone, cut/sawn” (HS 680221) to Argentina, Australia,
Bel-gium, Brazil, Canada, France, Italy, Japan, and the U.S. among others.
To identify the production technology and the nature of returns to scale for each
product, I use the classification developed by Antweiler and Trefler (2002). They
iden-tify four types of returns to scale: increasing–returns–to–scale (IRS) manufacturing,
increasing–returns–to–scale natural resources, constant–returns–to–scale (CRS), and
non–robust increasing–returns–to–scale industries for which they could not establish
the exact nature of the returns to scale. The latter group of industries are omitted
from the analysis. The share of export volumes and export relationships of products
22% of its volume and a half of its relationships in products with robustly identified
returns to scale. Mexico has 40% of its volume and 44% of its relationships, while
the U.S. has 65% of volume and 59% of relationships in such products.
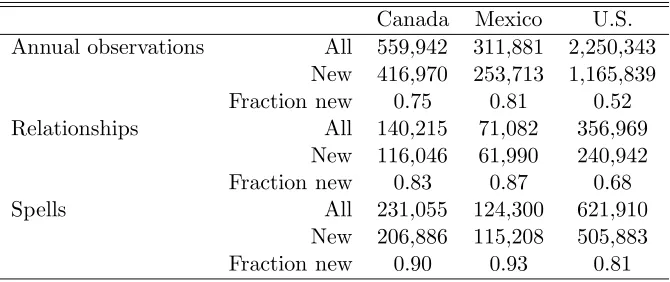
Canada Mexico U.S. Annual observations All 559,942 311,881 2,250,343
New 416,970 253,713 1,165,839 Fraction new 0.75 0.81 0.52
Relationships All 140,215 71,082 356,969
New 116,046 61,990 240,942 Fraction new 0.83 0.87 0.68
Spells All 231,055 124,300 621,910
[image:7.612.139.474.147.288.2]New 206,886 115,208 505,883 Fraction new 0.90 0.93 0.81
Table 1: Data Summary
Table 1 presents summary information for products with robustly identified
re-turns to scale for each country. Since I focus on exports created after 1990 the table
presents information for all exports as well as new exports. A note on the use of the
term ’new’ is in order – it refers to all export volumes or relationships created after
1990. For example, in 2005 new exports and relationships would be all those created
since 1990 and not only those created in 2005 alone. In all figures below old and
new values are normalized by the total 1990 values. Thus, values for new exports are
fractions of the 1990 value of total exports.
The U.S. has significantly more annual observations, export relationships, and
spells of service than Canada and Mexico put together. Perhaps the largest difference
across the three countries is in the fraction of observations in exports created since
1990. While Canada and Mexico have 75% and 81% of all annual observations created
after 1990, the U.S. has almost a half of all of its observations started prior to 1990.
These differences decrease as one looks at export relationships, 83% and 87% for
Canada and Mexico and 68% for the U.S., and spells of service, 90% and 93% for
Canada and Mexico versus 81% for the U.S.
2.1
New versus old exports
Figure 1 examines differences between exports started prior to 1990, old exports, and
those started afterwards, new exports. Top panels show the total volume of both
old and new exports, while bottom panels show the total number of both old and
new export relationships. For every country, new exports embody a significantly
lower volume, with the difference the largest for Mexico. While old exports embody
more value, they also grow at a much slower rate than new exports. For Canada
the 1991–2007 growth rate of the volume of old exports is 141% and 1,512% for new
exports. For Mexico the corresponding figures are 727% and 2,172%, while for the
U.S. they are only 13% for old exports and 1,372% for new exports. By 2007 some
15% of all Canadian, 12% of all Mexican, and 16% of all U.S. exports are embodied
in relationships started since 1990.
While the top row of Figure 1 shows that new exports are significantly smaller in
volume than old exports, the opposite is true for the number of export relationships
which carry that volume. The number of old relationships declines over time for
every country since their ranks cannot increase by definition. The rate of decline
from 1991 to 2007 is similar across the three countries: 66% for Canada and 57%
for both Mexico and the U.S. Both Canada and Mexico have slightly more than a
half of all relationships in 1991 in old exports, while the U.S. has almost 80% of its
relationships in old exports. Canada’s new relationships grow by 513%, followed by
Mexico at 469%, and the U.S. at 186%. While new exports account for a relatively
small share of total exports in 2007, new relationships account for a significant number
of all relationships in 2007: 91% for Canada, 92% for Mexico, and 68% for the U.S.
A final note on the growth in the number of relationships. The rate at which
new relationships are created exceeds the rate at which new relationships are ended.
0 .5 1 1.5 2 2.5 Normalized exports
1991 1993 1995 1997 1999 2001 2003 2005 2007
Year old new canada exports 0 2 4 6 8 Normalized exports
1991 1993 1995 1997 1999 2001 2003 2005 2007
Year old new mexico exports 0 .5 1 1.5 Normalized exports
1991 1993 1995 1997 1999 2001 2003 2005 2007
Year old new us exports 0 .5 1 1.5 2 2.5
Normalized relationship count
1991 1993 1995 1997 1999 2001 2003 2005 2007
Year old new canada relationships 0 .5 1 1.5 2 2.5
Normalized relationship count
1991 1993 1995 1997 1999 2001 2003 2005 2007
Year old new mexico relationships .2 .4 .6 .8
Normalized relationship count
1991 1993 1995 1997 1999 2001 2003 2005 2007
Year
old new
[image:9.612.80.712.69.511.2]us relationships
Figure 1: New and Old Exports and Relationships
started after 1990 grows in almost every year.1
These facts are supportive of the
broad conclusion of Besedeˇs and Prusa (2011), that, for at least some countries, the
extensive margin is relatively unimportant in the sense that over time it does not
account for much of the volume of exports, even though it accounts for a significant
share of relationships. There is a lot of churning at the extensive margin in terms of
the number of relationships, but much less in terms of the volume.
2.2
Intra NAFTA export shares
Top panels in Figure 2 illustrate NAFTA shares of export volumes and relationships
embodied in old exports, while bottom panels shows NAFTA shares of new exports.
In every country much of the effect of NAFTA is by far stronger in exports active in
1990. By 2000 almost 90% of Canada’s volume of exports was in old relationships
destined for Mexico and the U.S. The share of NAFTA destined old relationships
for Canada has quadrupled from 10% to 40%. Mexico has enjoyed an even stronger
dominance of NAFTA destined old exports, with the share of volume increasing to
more than 95% and the share of relationships increasing to 60%. The U.S. has the
most diversified structure of exports with the share of the volume of exports in old
relationships destined to NAFTA members doubling from 20% to 40% and the share
of relationships increasing by some two percentage points to 8%.
Patterns for new exports created after 1990 are more varied. While the share of
the volume of Canadian exports destined to NAFTA members has increased by a
factor of eight to 24%, the share of relationships displays an inverted U shape. For
Mexico the share of the volume has increased from 5% in 1991 to just under 20% by
2007, but having increased to as much as 40% in the intervening years. The share of
relationships was slightly lower in 2007 at roughly 6% than in 1991, but has increased
to as much as 9% in the intervening years. The decrease in both Canadian and
1
10 20 30 40 Relationship shares 75 80 85 90 Export shares
1991 1993 1995 1997 1999 2001 2003 2005 2007
Year exports relationships canada old 20 30 40 50 60 Relationship shares 80 85 90 95 100 Export shares
1991 1993 1995 1997 1999 2001 2003 2005 2007
Year exports relationships mexico old 5 6 7 8 9 10 Relationship shares 20 25 30 35 40 Export shares
1991 1993 1995 1997 1999 2001 2003 2005 2007
Year exports relationships us old 2.5 3 3.5 4 4.5 Relationship shares 0 5 10 15 20 25 Export shares
1991 1993 1995 1997 1999 2001 2003 2005 2007
Year exports relationships canada new 6 7 8 9 Relationship shares 0 10 20 30 40 Export shares
1991 1993 1995 1997 1999 2001 2003 2005 2007
Year exports relationships mexico new .4 .5 .6 .7 .8 Relationship shares 0 1 2 3 4 5 Export shares
1991 1993 1995 1997 1999 2001 2003 2005 2007
Year
exports relationships
[image:11.612.83.707.71.507.2]us new
Figure 2: New and Old Exports and Relationships to NAFTA Members
Mexican exports to NAFTA members in the latter part of this period may have been
caused by the displacement of trade due to the rising presence of Chinese exports in
the U.S., as investigated by Iacovone, Rauch, and Winters (2010). The U.S. has had
the smallest share of new exports destined to NAFTA members, a consequence of a
more diversified export structure.
2.3
Export shares across returns to scale
In Figure 3 I examine the evolution of shares of export volumes and relationships
across the three types of returns to scale. While the majority of Canadian exports
involve IRS manufacturing products, they have experienced a fair amount of change
since 1990. The creation of CUSFTA resulted in a rapid drop in the share of IRS
manufacturing products from 80% of exports to 50% by 1994. The addition of Mexico
to CUSFTA resulted in an increase in the share of IRS manufacturing products to
60% which has trended back towards 50% by 2007. The share of exports in CRS
products more than doubled from 20% to 45% by 1994, but has trended downward
ever since. The share of IRS natural resource products has increased rapidly from
less than 5% of exports to almost 20% by 2007.
Mexico has had a different experience. While the share of IRS manufacturing
products in exports has decreased to 55% immediately after NAFTA took effect, it
has since increased to about 65%. The share of CRS products has decreased from
slightly more than 40% to about 30% after an initial boost from NAFTA. The share
of IRS natural resource products has increased consistently, though to a much lesser
degree than for Canada. The U.S. has a more balanced distribution of exports across
the three types of products. Unlike Canada and Mexico the U.S. has the largest
share of its exports in CRS products. Following CUSFTA the share of CRS products
decreased from 44% to 35% by 1995, followed by a sharp increase to 60% by 1999. It
0 20 40 60 80 Export shares
1991 1993 1995 1997 1999 2001 2003 2005 2007
Year
IRS Manuf IRS Nat Res CRS
canada 0 20 40 60 80 Export shares
1991 1993 1995 1997 1999 2001 2003 2005 2007
Year
IRS Manuf IRS Nat Res CRS
mexico 10 20 30 40 50 60 Export shares
1991 1993 1995 1997 1999 2001 2003 2005 2007
Year
IRS Manuf IRS Nat Res CRS
us 0 20 40 60 80 Relationship Shares
1991 1993 1995 1997 1999 2001 2003 2005 2007
Year
IRS Manuf IRS Nat Res CRS
canada 0 20 40 60 Relationship Shares
1991 1993 1995 1997 1999 2001 2003 2005 2007
Year
IRS Manuf IRS Nat Res CRS
mexico 0 10 20 30 40 50 Relationship Shares
1991 1993 1995 1997 1999 2001 2003 2005 2007
Year
IRS Manuf IRS Nat Res CRS
[image:13.612.85.706.69.506.2]us
Figure 3: IRS Export and Relationship Shares
products has fluctuated from some 40% in 1991 and 1995 and has decreased to some
25% in 2007. IRS natural resource products decreased from more than 30% in 1994
to less than 15% in 2001 before increasing to roughly 30% by 2007.
NAFTA members are more similar in the distribution of relationships. In every
country IRS manufacturing products account for the largest share of exports and
have followed rather similar paths. For all three the share of IRS natural resources
has been relatively stable over time, being the largest for the U.S. at some 5%. As a
result shares of IRS manufacturing and CRS products largely look as mirror images
of each other. IRS manufacturing has increased slightly in Canada, and somewhat
more for Mexico and the U.S., though the total increase in the share from 1991 to
2007 is only several percentage points.
2.4
Intra NAFTA export shares and returns to scale
There are larger fluctuations in shares of exports destined for NAFTA members, as
seen in Figure 4. CRS products dominate the share of exports for each country.
For Canada, it has increased from some 40% in 1991 to almost 80% in 1995 before
collapsing to some 20% by 2007. For Mexico their share has fluctuated between some
40% in both 1991 and 2007 and more than 60% reached on several occasions. In the
U.S. their share has steadily increased from less than 40% to more than 75% by 2007.
Canada’s exports of IRS manufacturing goods rapidly decreased with the
forma-tion of CUSFTA from almost 60% in 1991 to less than 20% in 1995 before rebounding
under NAFTA to more than 30% in the early 2000s and settling at some 25% in 2007.
The share of IRS manufacturing products in Mexico’s exports to NAFTA members
has decreased from 60% to around 40%, while their share in U.S. exports to NAFTA
members has decreased from some 60% to around 20%. IRS natural resource
prod-ucts share in Canadian exports increased rapidly between 1991 and 1992, decreased
0 20 40 60 80 Export shares
1991 1993 1995 1997 1999 2001 2003 2005 2007
Year
IRS Manuf IRS Nat Res CRS
canada 0 20 40 60 80 Export shares
1991 1993 1995 1997 1999 2001 2003 2005 2007
Year
IRS Manuf IRS Nat Res CRS
mexico 0 20 40 60 80 Export shares
1991 1993 1995 1997 1999 2001 2003 2005 2007
Year
IRS Manuf IRS Nat Res CRS
us 0 10 20 30 40 50 Relationship Shares
1991 1993 1995 1997 1999 2001 2003 2005 2007
Year
IRS Manuf IRS Nat Res CRS
canada 0 20 40 60 Relationship Shares
1991 1993 1995 1997 1999 2001 2003 2005 2007
Year
IRS Manuf IRS Nat Res CRS
mexico 0 20 40 60 80 Relationship Shares
1991 1993 1995 1997 1999 2001 2003 2005 2007
Year
IRS Manuf IRS Nat Res CRS
[image:15.612.84.710.73.506.2]us
Figure 4: IRS Export and Relationship Shares in Exports to NAFTA Members
exports by 2007. In Mexico’s exports the share of IRS natural resource products
in-creased modestly until 2005 when they enjoyed a rapid increase to almost 20%. Their
share in U.S. exports has remained largely constant and small.
Fluctuations have been much smaller in the distribution of relationships. The
share of IRS natural resource product relationships has remained steady at or below
10% for all three NAFTA members. The share of CRS product relationships in
Canadian exports to NAFTA has increased from 50% to more than 60% in the late
1990s before returning to some 50%. The share of IRS manufacturing products has
mirrored that of CRS products, first decreasing from 60% before returning to that
level by 2007. The share of CRS product relationships in Mexican exports to NAFTA
members has fluctuated around 50% and that of IRS manufacturing has fluctuated
around 45%. The U.S. offers a different picture with CRS products relationships
accounting for a roughly constant 75% share of relationships and IRS manufacturing
products accounting for a roughly constant 18%.
3
Motivating Model
To motivate the estimation of the hazard exports ceasing consider the following
ex-tension of the Melitz (2003) model. Firms are subject to exogenous productivity or
product appeal shocks, µ, which are serially correlated over time. Firms that draw a
favorable parameterµ, one above the threshold required for exporting to be profitable,
will export. The length of the firm’s participation in export markets will depend on
the nature of the correlation of the firm’s µ over time. If the correlation is positive,
so that µincreases over time, the firm will be a long–lived exporter. If the firm’sµis
negatively correlated over time, then the firm will cease exporting at some point. How
quickly the firm’s µ falls below the level required for profitable exports will depend
result in the firm being a long–lived exporter ifµdecreases quickly over time. On the
flip side, a firm whose initial µ is favorable, but close to the export threshold level,
may turn into a long–lived exporter provided its µis positively correlated over time.
Clearly, an initialµclose to the threshold level coupled with negative correlation over
time will result in the firm quickly ceasing exporting. Thus, depending on the level of
the initialµand its correlation over time, one might observe firms of varying duration
of exporting.
A free trade agreement affects firms through its effect on µ. Free access to a
foreign market can either be attributed to a positive productivity shock or a positive
product appeal shock as it reduces costs of supplying a market. NAFTA may have had
a differential effect based on the nature of the returns to scale used in production.
Trade models with economies of scale argue that access to a large foreign market
increases firm productivity as Trefler (2004) has found for NAFTA. This would entail
an increase in the parameter µ, thus making it more likely firms would both start
exporting and export longer, even if theirµis negatively correlated over time. Thus,
NAFTA can reduce the hazard of exports ceasing. NAFTA may have had an offsetting
effect as well, as some firms may be induced to try to export, even though they should
not. Some firms may be overly optimistic about their ability to successfully export
and attempt to do so only to find themselves abandoning exports quickly. The overall
effect of NAFTA can therefore be seen as a the balance of these two opposing forces.
4
Hazard of Exports Ceasing
4.1
Econometric methodology and specification
I estimate the hazard of exports ceasing by estimating a probit model. As argued
by Hess and Persson (2010b), using a probit estimator is more appropriate for
dis-crete duration data, as annual trade data are, and does not impose the restrictive
proportional hazard assumption.2
Unobserved heterogeneity is another reason to use
a discrete–time model such as probit to estimate the hazard as it is more easily
addressed in such models than in the Cox proportional hazard model. To take
unob-served heterogeneity into account I estimate the random effects probit model of the
hazard rate with random effects at the spell level. I model the dependence of the
hazard rate on time by including a dummy for each year in the spell.
Advantages of the probit–estimated hazard model comes at the cost of a more
complicated interpretation of estimated coefficients. Neither coefficients nor the
asso-ciated marginal effects reveal the true effect of each covariate. Although a given
coef-ficient may be statistically significant, whether it makes a difference for the estimated
hazard depends on the standard error of every covariate, all pairwise covariances, and
the distributional specification of the probit model. To ascertain whether estimated
hazards for different values of covariates of interest are statistically different I plot
estimated hazards with the 95% confidence interval, which is denoted with dotted line
in every figure. All estimated hazards are estimated with covariates at their mean
levels, with the exception of covariates of interest.
I use several country– and product–level variables to estimate the hazard of
ex-ports ceasing. The gross domestic product of the importer is expected to reduce the
hazard, while distance to the importer is expected to increase the hazard. I use two
measures of common language; one capturing whether two countries share an official
language and the other whether more than 9% of the population speak the same
lan-guage. In as much as common language reduces costs, both are expected to reduce
the hazard. I use two measures at the country–product level to capture information
spillovers: one measures the number of products exported to the same country, while
the other measures the number of countries to which the same product is exported.
2
Brenton, Saborowski, and von Uexk¨ull (2010) and Hess and Persson (2010b) show that the
The former measures experience with a country, while the latter measures experience
with a product. Both are expected to reduce the hazard.
A lower economic risk of the importer is expected to reduce the hazard. The
volume of initial exports should reduce the hazard, reflecting the confidence exporters
(or their importing partners) have in their ability to consistently export their products
(Rauch and Watson 2003, Besedeˇs 2008). The coefficient of variation of unit values
measures the extent of the variation of unit values for each product across all export
destinations. It reflects the extent of product differentiation. I use a dummy to
capture any colonial relationship in the past. Finally, I use dummies to capture each
multiple instance of a relationship.
I use two dummies to capture the effect of returns to scale, one for IRS
manu-facturing products and one for IRS natural resource products with CRS products as
the baseline. Since spells of export relationships created after 1990 stretch across the
period prior to and after the establishment of NAFTA, it is possible to distinguish
between two NAFTA related effects. Therefore, I use two dummies. One simply
cap-tures exports to NAFTA members, while the other capcap-tures whether NAFTA itself
is in effect. Estimates of these four dummies are of main interest.
4.2
Basic results
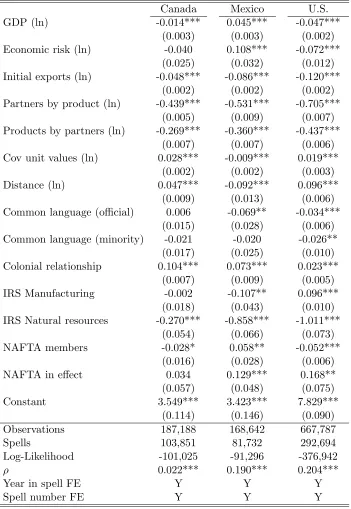
Table 2 collects the basic results. Most variables have identical qualitative effects
across all three exporters. Similar to other papers in the literature, the larger the
GDP of the importer the lower the hazard for both Canadian and U.S. exports. The
effect of importer’s GDP on the hazard of Mexican exports is positive – Mexican
exports to larger economies face a higher hazard. To the extent that Mexican exports
to larger and more developed economies are potentially of lower quality may result
in them experiencing a higher hazard than exports to smaller economies.
The economic risk variable offers a somewhat puzzling result. With higher values
Canada Mexico U.S.
GDP (ln) -0.014*** 0.045*** -0.047***
(0.003) (0.003) (0.002) Economic risk (ln) -0.040 0.108*** -0.072***
(0.025) (0.032) (0.012) Initial exports (ln) -0.048*** -0.086*** -0.120***
(0.002) (0.002) (0.002) Partners by product (ln) -0.439*** -0.531*** -0.705***
(0.005) (0.009) (0.007) Products by partners (ln) -0.269*** -0.360*** -0.437***
(0.007) (0.007) (0.006) Cov unit values (ln) 0.028*** -0.009*** 0.019***
(0.002) (0.002) (0.003)
Distance (ln) 0.047*** -0.092*** 0.096***
(0.009) (0.013) (0.006) Common language (official) 0.006 -0.069** -0.034***
(0.015) (0.028) (0.006) Common language (minority) -0.021 -0.020 -0.026**
(0.017) (0.025) (0.010) Colonial relationship 0.104*** 0.073*** 0.023***
(0.007) (0.009) (0.005)
IRS Manufacturing -0.002 -0.107** 0.096***
(0.018) (0.043) (0.010) IRS Natural resources -0.270*** -0.858*** -1.011***
(0.054) (0.066) (0.073)
NAFTA members -0.028* 0.058** -0.052***
(0.016) (0.028) (0.006)
NAFTA in effect 0.034 0.129*** 0.168**
(0.057) (0.048) (0.075)
Constant 3.549*** 3.423*** 7.829***
(0.114) (0.146) (0.090)
Observations 187,188 168,642 667,787
Spells 103,851 81,732 292,694
Log-Likelihood -101,025 -91,296 -376,942
ρ 0.022*** 0.190*** 0.204***
Year in spell FE Y Y Y
Spell number FE Y Y Y
[image:20.612.133.484.120.629.2]Robust standard errors clustered by relationships in parentheses with *, **, *** denoting significance at 10%, 5%, and 1%.
indicating a riskier economy, a negative coefficient implies that U.S. exports to riskier
economies face a lower hazard, rather than a higher one as one might expect. This
result highlights the presence of uncertainty in international trade as modeled by
Rauch and Watson (2003) and empirically investigated by Besedeˇs (2008). It is
possible exports to highly uncertain economies are undertaken only once the exporter
is relatively certain its exports will be long lived and will generate a profit. Such
a strategy minimizes costs associated with exporting especially in situations where
there is uncertainty as to whether exports will be profitable. Economic risk has no
significant effect on Canadian exports, while Mexican exports face a lower hazard
when destined for less risky markets, as expected.
The volume of exports at the start of a relationship has a significant negative
effect for all three countries resulting in longer lived spells for relationships starting
with a larger volume. Information spillovers have large negative effects – the more
products exported to a country or the more countries a product is exported to, the
lower the hazard. Both of these results are consistent with Cadot et al. (2010) and
Besedeˇs (2011). The more variable are the unit values for Canadian and U.S. exports
the higher the hazard. The effect for Mexican exports is the opposite, with more
variable unit values resulting in a lower hazard.
To the extent that distance reflects transportation costs, the further away the
export markets are the higher the hazard of Canadian and U.S. exports, as expected.
For Mexico the effect is the opposite – hazard is lower for exports destined for markets
further away from Mexico. Official common language has a significant negative effect
for Canadian and U.S. exports resulting in a reduced hazard. Mexican exports to
countries with Spanish as the official language face a higher hazard. The minority
common language has a statistically significant negative effect for Mexico and the
U.S., indicating longer duration and lower hazard, while it has no effect on Canadian
exports. Exports to countries with which Canada and Mexico share a colonial history
are no different form exports to other countries, while in the case of the U.S. such
exports face a lower hazard.
The relative importance of unobserved heterogeneity is reflected by estimates ofρ,
which can be interpreted as the fraction of individual spell variation due to variation
in unobserved factors. There are large differences in unobserved heterogeneity
be-tween Canada on one side and Mexico and the U.S. on the other. While unobserved
heterogeneity plays a statistically significant role in all three cases, the magnitude of
ρ is almost an order of magnitude larger in the case of Mexico and the U.S. (0.190
and 0.204 versus 0.022).
4.3
Effects of NAFTA
Exports to a NAFTA member face a significantly lower hazard for all three countries,
with the effect strongest for the U.S. and weakest for Canada. Surprisingly, the
establishment of NAFTA increased the hazard of Mexican and U.S. exports destined
to NAFTA markets, while it has no effect on Canadian exports. To properly evaluate
whether NAFTA has had a significant effect, I plot the estimated hazard of exports
ceasing for non–NAFTA members and for NAFTA members both in the absence and
presence of NAFTA in Figure 5. I include the 95% confidence interval around the
estimated hazard for non–members and members in the absence of NAFTA. If the
estimated hazard for members in the presence of NAFTA lies outside the confidence
interval, then NAFTA has had a significant effect.
The hazard of exports to NAFTA members ceasing is lower than to non-NAFTA
countries for all three members with differences statistically significant. The difference
between the hazard of exports ceasing to NAFTA members and non–members is
the largest for Mexico and the U.S. The pure effect of joining NAFTA is slightly
positive for Canada, increasing the hazard, but is not statistically significant. The
0
.1
.2
.3
.4
.5
.6
.7
1 2 3 4 5 6
Time
Non−NAFTA member, no NAFTA
NAFTA member
NAFTA member, NAFTA in effect canada
0
.1
.2
.3
.4
.5
.6
.7
1 2 3 4 5 6
Time
Non−NAFTA member, no NAFTA
NAFTA member
NAFTA member, NAFTA in effect mexico
0
.1
.2
.3
.4
.5
.6
.7
1 2 3 4 5 6
Time
Non−NAFTA member, no NAFTA
NAFTA member
[image:23.612.73.711.74.522.2]NAFTA member, NAFTA in effect us
Figure 5: The Effect of NAFTA on the Estimated Hazard
the hazard of exports to NAFTA members ceasing. In addition, the estimated hazard
for exports ceasing to NAFTA members with NAFTA in effect lies outside the 95%
confidence interval (dotted lines) for the estimated hazard for exports ceasing to
NAFTA members, with the difference larger for U.S. exports.
The onset of NAFTA has increased the hazard of exports to member countries
ceasing in the case of Mexico and the U.S. In neither case is this increase sufficiently
large to offset the lower hazard associated with exporting to a NAFTA member. One
explanation for the NAFTA effect is that its establishment may have induced too
many firms to try to take advantage of new opportunities created by NAFTA, thus
resulting in more failures. Essentially, NAFTA may have induced some firms who
otherwise would not export to do so, only to quickly realize they cannot compete in
the foreign market.
4.4
Effects of returns to scale
In terms of returns to scale, exports of increasing–returns–to–scale manufacturing
products face a higher hazard than constant–returns–to–scale products for Canadian,
Mexican, and U.S. exports. U.S. exports of increasing–returns–to–scale natural
re-source products face a higher hazard, while Mexican exports of IRS natural rere-source
products face a significantly lower hazard than their exports of CRS products. There
are no differences between the two types of products in the case of Canadian exports.
Figure 6 illustrates estimated hazard for the three types of returns to scale for
each country, along with corresponding 95% confidence intervals. There are virtually
no differences between CRS and IRS natural resource products for Canada, while
its exports of IRS manufacturing products face a statistically different and higher
hazard. In the case of Mexico, IRS manufacturing products also face a statistically
significantly different and highest hazard of exports ceasing. Mexican exports of
0
.1
.2
.3
.4
.5
.6
.7
1 2 3 4 5 6
Time
CRS
IRS manufacturing
IRS natural resources canada
0
.1
.2
.3
.4
.5
.6
.7
1 2 3 4 5 6
Time
CRS
IRS manufacturing
IRS natural resources mexico
0
.1
.2
.3
.4
.5
.6
.7
1 2 3 4 5 6
Time
CRS
IRS manufacturing
[image:25.612.90.704.71.524.2]IRS natural resources us
Figure 6: The Effect of Returns to Scale on the Estimated Hazard
returns to scale type products for Mexico are statistically different, especially for
the first few years in a spell. The ordering of estimated hazards is different for the
U.S. with IRS natural resource products facing the highest hazard of exports ceasing,
which is statistically different from the other two types. While IRS manufacturing
products exported by the U.S. face a higher hazard, it is not statistically different
from that for CRS products.
4.5
The effect of NAFTA over time
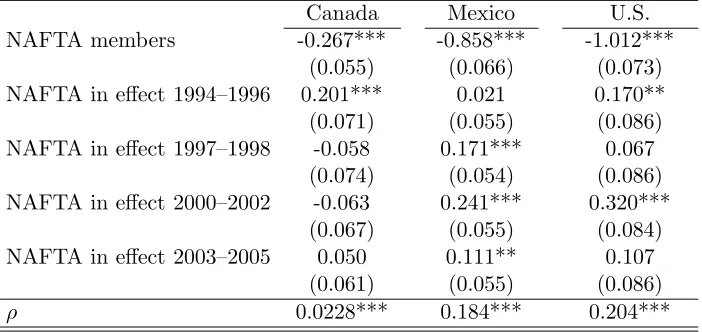
To better understand the nature of the effect of the implementation of NAFTA on
the hazard of exports ceasing, Table 3 shows the results with the NAFTA–in–effect
variable having a time–dependent effect, for three–year intervals starting in 1994. It
is possible NAFTA has had a different effect over time as firms adjust to it and since
some of its provisions were phased in over a period of time.3
Since the coefficients for
other variables are virtually unchanged, I only present the coefficients for the time–
dependent NAFTA–in–effect variable.4
These four dummies indicate in which years
did the existence of NAFTA affects the hazard.
While the onset of NAFTA has no net effect on Canadian exports, the time–
dependent coefficients indicate that the onset of NAFTA did increase the hazard of
Canadian exports to the other two NAFTA members immediately after the onset
of NAFTA and had no effect after 1997. The opposite holds for Mexico: there is
no effect in the first three years of Mexican participation in NAFTA, while in every
subsequent three–year period exports to other NAFTA members face a significantly
higher hazard. U.S. exports to NAFTA members face a higher hazard consistently
since the onset of NAFTA, with the exception of the three–year period between 1997
and 1999. 3
Baier and Bergstrand (2007) show in a gravity framework that the full effect of free trade agreements on the partners’ trade volume takes ten years to accrue.
4
Canada Mexico U.S. NAFTA members -0.267*** -0.858*** -1.012***
(0.055) (0.066) (0.073) NAFTA in effect 1994–1996 0.201*** 0.021 0.170** (0.071) (0.055) (0.086) NAFTA in effect 1997–1998 -0.058 0.171*** 0.067
(0.074) (0.054) (0.086) NAFTA in effect 2000–2002 -0.063 0.241*** 0.320***
(0.067) (0.055) (0.084) NAFTA in effect 2003–2005 0.050 0.111** 0.107
(0.061) (0.055) (0.086)
ρ 0.0228*** 0.184*** 0.204***
[image:27.612.133.484.74.240.2]Robust standard errors clustered by relationships in parentheses with *, **, *** denoting significance at 10%, 5%, and 1%; year in spell and spell number fixed effects included.
Table 3: Time–Dependent NAFTA Effect
Figure 7 plots the estimated hazard for exports to NAFTA members in absence
of NAFTA with the 95% confidence interval along with estimated hazards for the
four subperiods. In the case of Canada, the effect of NAFTA between 1994 and 1996
is outside the confidence interval indicating that during those three years NAFTA
did indeed increase the hazard of Canadian exports to NAFTA members ceasing. In
the case of Mexico, the effect is statistically significant between 1997 and 2002, while
the effect between 2003 and 2005 lies just inside the 95% confidence interval. In the
case of the U.S., NAFTA had a statistically significant effect immediately upon its
inception, between 1994 and 1996, and again between 2000 and 2002 when it increased
the hazard significantly (by almost ten percentage points at the start of a spell).
4.6
NAFTA and returns to scale
I have argued above that one might expect the hazard of exports ceasing for increasing–
returns–to–scale manufacturing products to be the lowest when destined to NAFTA
markets given advantages offered by access to larger markets. The above results that
IRS manufacturing products face the highest hazard are potentially indicative of the
opposite holding. However, the appropriate examination of such a hypothesis entails
0
.1
.2
.3
.4
.5
.6
.7
1 2 3 4 5 6
Time
NAFTA member, no NAFTA
NAFTA 1994−1996
NAFTA 1997−1999
NAFTA 2000−2002
NAFTA 2003−2005 canada
0
.1
.2
.3
.4
.5
.6
.7
1 2 3 4 5 6
Time
NAFTA member, no NAFTA
NAFTA 1994−1996
NAFTA 1997−1999
NAFTA 2000−2002
NAFTA 2003−2005 mexico
0
.1
.2
.3
.4
.5
.6
.7
1 2 3 4 5 6
Time
NAFTA member, no NAFTA
NAFTA 1994−1996
NAFTA 1997−1999
NAFTA 2000−2002
[image:28.612.74.714.73.518.2]NAFTA 2003−2005 us
Figure 7: The Effect of NAFTA across Time
comparing the hazard of exports to NAFTA members ceasing for each returns–to–
scale product separately, to which I now turn. Rather than introducing a number of
interacted variables to examine whether the effect of NAFTA is different for different
returns–to–scale products, I estimate the hazard of exports ceasing for each of the
three returns–to–scale types of products, focusing on the NAFTA–in–effect
coeffi-cients, and compare the fitted hazards for each country. In order to conserve space I
only present coefficients relevant to NAFTA.5
Table 4 collects the results.
Canada
IRS Manufacturing IRS Natural Resources CRS
NAFTA members -0.263*** -0.274*** -0.176***
(0.066) (0.086) (0.059)
NAFTA in effect 0.076 0.164* 0.033
(0.069) (0.089) (0.061)
ρ 0.0315*** 0.0259*** 0.0299***
Mexico
IRS Manufacturing IRS Natural Resources CRS
NAFTA members -0.703*** -0.624*** -0.773***
(0.063) (0.090) (0.067)
NAFTA in effect 0.182*** 0.082 0.025
(0.049) (0.071) (0.049)
ρ 0.161*** 0.174*** 0.203***
United States
IRS Manufacturing IRS Natural Resources CRS
NAFTA members -1.097*** -1.042*** -1.029***
(0.116) (0.126) (0.076)
NAFTA in effect 0.431*** 0.457*** 0.195***
(0.120) (0.130) (0.078)
ρ 0.119*** 0.135*** 0.239***
[image:29.612.117.496.245.549.2]Robust standard errors clustered by relationships in parentheses with *, **, *** de-noting significance at 10%, 5%, and 1%; year in spell and spell number fixed effects included.
Table 4: The Effect of NAFTA across Returns to Scale
Intra–NAFTA exports of all three countries in all three returns–to–scale types
face a lower hazard. In the case of Canada, the onset of NAFTA has no
signifi-cant effect on the hazard of exports increasing–returns–to–scale manufacturing and
5
Full results are available on request.
0 .1 .2 .3 .4 .5
1 2 3 4 5 6
Time
no NAFTA NAFTA in effect
canada irs manufacturing
0 .1 .2 .3 .4 .5
1 2 3 4 5 6
Time
no NAFTA NAFTA in effect
mexico irs manufacturing
0 .1 .2 .3 .4 .5
1 2 3 4 5 6
Time
no NAFTA NAFTA in effect
us irs manufacturing
0 .1 .2 .3 .4 .5
1 2 3 4 5 6
Time
no NAFTA NAFTA in effect
canada irs natural resources
0 .1 .2 .3 .4 .5
1 2 3 4 5 6
Time
no NAFTA NAFTA in effect
mexico irs natural resources
0 .1 .2 .3 .4 .5
1 2 3 4 5 6
Time
no NAFTA NAFTA in effect
us irs natural resources
0 .1 .2 .3 .4 .5
1 2 3 4 5 6
Time
no NAFTA NAFTA in effect
canada constant returns to scale
0 .1 .2 .3 .4 .5
1 2 3 4 5 6
Time
no NAFTA NAFTA in effect
mexico constant returns to scale
0 .1 .2 .3 .4 .5
1 2 3 4 5 6
Time
no NAFTA NAFTA in effect
[image:30.612.61.719.68.512.2]us constant returns to scale
Figure 8: The Effect of NAFTA and Returns to Scale on the Estimated Hazard
constant–returns–to–scale products ceasing, and only marginally increases the
haz-ard for increasing–returns–to–scale natural resource products. In the case of Mexico,
the net effect of NAFTA which was to increase the hazard associated with exports to
NAFTA members (see Table 2) seems to be driven by its effect on increasing–returns–
to–scale manufacturing products. The other two types are not affected by the onset
of NAFTA. In the case of the U.S., the onset of NAFTA increases the hazard for all
three types of returns to scale.
Figure 8 shows the estimated hazard of exports to NAFTA members ceasing for
the different types of returns to scale and the effect of NAFTA on the estimated
hazard. I include the 95% confidence interval for the estimated hazard of exports to
NAFTA members ceasing. The top panels examine increasing–returns–to–scale
man-ufacturing products, the middle panels increasing–returns–to–scale natural resource
products, and the bottom panels constant–returns–to–scale products. In the case of
Canadian exports, despite the fact that the effect of the onset of NAFTA is
esti-mated as significant, the estiesti-mated hazard for the onset of NAFTA is not statistically
significantly different from that for exports to NAFTA members, with the possible
exception of IRS natural resource products.
In the case of Mexico NAFTA does not have a significant effect of the hazard for
IRS natural resource and CRS products, as the two estimated hazard are within the
95% confidence interval. However, the effect of NAFTA is statistically significant for
IRS manufacturing products. The largest effect that NAFTA has had on the hazard of
exports ceasing is for U.S. products across the full spectrum of returns to scale. In the
case of each returns–to–scale product type, the difference between exports to NAFTA
members in the absence of NAFTA and after its onset is statistically significant. Thus,
NAFTA has increased the hazard of U.S. exports to NAFTA members ceasing, by
almost ten percentage points at the start of a spell in the case of IRS products and
some five percentage points in the case of CRS products.
Canada
IRS Manufacturing IRS Natural Resources CRS
NAFTA members -0.260*** -0.271*** -0.173***
(0.066) (0.086) (0.059)
NAFTA in effect 1994–1996 0.283*** 0.371*** 0.192**
(0.086) (0.112) (0.077)
NAFTA in effect 1997–1998 0.006 0.110 0.022
(0.088) (0.114) (0.079)
NAFTA in effect 2000–2002 -0.093 -0.065 -0.103
(0.079) (0.104) (0.072)
NAFTA in effect 2003–2005 0.110 0.227** 0.048
(0.072) (0.095) (0.066)
ρ 0.0318*** 0.0259*** 0.0306***
Mexico
IRS Manufacturing IRS Natural Resources CRS
NAFTA members -0.703*** -0.626*** -0.774***
(0.063) (0.090) (0.067)
NAFTA in effect 1994–1996 0.110* -0.040 -0.136**
(0.056) (0.082) (0.057)
NAFTA in effect 1997–1998 0.214*** 0.088 0.044
(0.056) (0.080) (0.056)
NAFTA in effect 2000–2002 0.325*** 0.289*** 0.196***
(0.057) (0.080) (0.056)
NAFTA in effect 2003–2005 0.098* 0.004 0.021
(0.057) (0.082) (0.057)
ρ 0.159*** 0.168*** 0.193***
United States
IRS Manufacturing IRS Natural Resources CRS
NAFTA members -1.092*** -1.041*** -1.035***
(0.116) (0.126) (0.076)
NAFTA in effect 1994–1996 0.525*** 0.463*** 0.135
(0.137) (0.151) (0.090)
NAFTA in effect 1997–1998 0.244* 0.500*** 0.115
(0.138) (0.148) (0.089)
NAFTA in effect 2000–2002 0.637*** 0.610*** 0.385***
(0.134) (0.147) (0.087)
NAFTA in effect 2003–2005 0.270* 0.232 0.146
(0.139) (0.152) (0.089)
ρ 0.118*** 0.135*** 0.238***
[image:32.612.90.528.93.653.2]Robust standard errors clustered by relationships in parentheses with *, **, *** denoting signifi-cance at 10%, 5%, and 1%; year in spell and spell number fixed effects included.
Table 5 contains the time–dependent effects of NAFTA for each returns to scale
type, shedding more light on the exact nature of the effect of NAFTA on the hazard of
exports ceasing. For Canada, NAFTA has increased the hazard of IRS manufacturing
and CRS products only during its first three years, while the hazard IRS natural
resource products was higher in the first three years as well as between 2003 and
2005. This is confirmed by plots in Figure 9 where the estimated hazard during these
periods is outside the 95% confidence interval.
For Mexico, NAFTA has increased the hazard for IRS manufacturing products
consistently ever since it was enacted, though the effect has declined in magnitude
after 2002. The effect is statistically significant for the 1997 to 2002 period, and only
marginally so for the other two periods (Figure 9). NAFTA has increased the hazard
for IRS natural resource products only between 2000 and 2002, which is statistically
significant as illustrated in Figure 9. NAFTA’s effect on the hazard of Mexican exports
of CRS products is the most varied. It has initially reduced it with the estimated
hazard right on the lower bound of the 95% confidence interval, and then increased
it between 1997 and 2002, a statistically significant effect. NAFTA has had no effect
since 2003.
NAFTA’s effect on the hazard of U.S. exports to NAFTA members is the most
consistent one, having increased the hazard for every type of product in almost every
year. Exports of CRS products have a higher hazard of ceasing in a statistically
meaningful manner only for the 2000–2002 period. Exports of IRS natural resource
products have had a higher hazard in every period, with differences statistically
sig-nificant, though only marginally for the 2003–2005 period. Exports of IRS
manufac-turing products had a statistically significant higher hazard in every period, with the
effect stronger immediately after NAFTA’s onset and between 2000 and 2002.
0 .1 .2 .3 .4 .5
1 2 3 4 5 6
Time no NAFTA NAFTA 1994−1996 NAFTA 1997−1999 NAFTA 2000−2002 NAFTA 2003−2005
canada irs manufacturing
0 .1 .2 .3 .4 .5
1 2 3 4 5 6
Time no NAFTA NAFTA 1994−1996 NAFTA 1997−1999 NAFTA 2000−2002 NAFTA 2003−2005
mexico irs manufacturing
0 .1 .2 .3 .4 .5
1 2 3 4 5 6
Time no NAFTA NAFTA 1994−1996 NAFTA 1997−1999 NAFTA 2000−2002 NAFTA 2003−2005
us irs manufacturing
0 .1 .2 .3 .4 .5
1 2 3 4 5 6
Time no NAFTA NAFTA 1994−1996 NAFTA 1997−1999 NAFTA 2000−2002 NAFTA 2003−2005
canada irs natural resources
0 .1 .2 .3 .4 .5
1 2 3 4 5 6
Time no NAFTA NAFTA 1994−1996 NAFTA 1997−1999 NAFTA 2000−2002 NAFTA 2003−2005
mexico irs natural resources
0 .1 .2 .3 .4 .5
1 2 3 4 5 6
Time no NAFTA NAFTA 1994−1996 NAFTA 1997−1999 NAFTA 2000−2002 NAFTA 2003−2005
us irs natural resources
0 .1 .2 .3 .4 .5
1 2 3 4 5 6
Time no NAFTA NAFTA 1994−1996 NAFTA 1997−1999 NAFTA 2000−2002 NAFTA 2003−2005
canada constant returns to scale
0 .1 .2 .3 .4 .5
1 2 3 4 5 6
Time no NAFTA NAFTA 1994−1996 NAFTA 1997−1999 NAFTA 2000−2002 NAFTA 2003−2005
mexico constant returns to scale
0 .1 .2 .3 .4 .5
1 2 3 4 5 6
Time no NAFTA NAFTA 1994−1996 NAFTA 1997−1999 NAFTA 2000−2002 NAFTA 2003−2005
[image:34.612.67.722.67.514.2]us constant returns to scale
Figure 9: The Effect of NAFTA and Returns to Scale Differences
5
Conclusion
In this paper I investigate how the North American Free Trade Agreement has
af-fected the members’ hazard of exports ceasing and how differences in returns to scale
manifest themselves in the hazard of exports ceasing for the three members: Canada,
Mexico, and the United States. NAFTA itself has not had a beneficial effect on the
hazard of exports ceasing. Rather, the effect has been negative for the U.S. and
Mex-ico, with the hazard of their exports ceasing to NAFTA members increasing with the
enactment of NAFTA. However, the said increase was not large enough to offset the
much lower hazard of exports ceasing to NAFTA members enjoy due to the geography
of the free–trade area and proximity of the members to each other. Canada, Mexico,
and the U.S. enjoy a significantly lower hazard on exports to each other without the
presence of NAFTA. Given the particular geography of NAFTA, the effect of common
borders between the members, a well known positive force in international trade, is
largely indistinguishable from the effect of NAFTA. The nature of the geography of
NAFTA makes it difficult to broadly conclude that free trade agreements increase
the hazard of exports between the members ceasing, calling for an investigation of
the effect of free trade agreements with less restrictive geographic characteristics, or
a broader set of such agreements.
The effect of NAFTA is much stronger once one scratches below the surface, in
terms of evaluating its effect on each returns to scale type. It has had the most
consistent effect on U.S. exports of all three types, particularly in the case of both
increasing returns to scale product types. In addition, it has had different effects
during different subperiods since its inception, likely reflecting the ability of firms to
adjust to new conditions and the fact that some of its provisions were phased in over
time.
I presented the first evidence of the effect of a free trade agreement on the hazard of
exports ceasing. While NAFTA increases the hazard, further investigation is needed
with free trade agreements among countries which are not as geographically clustered
as the NAFTA members are. Mercosur and the European Union are two free trade
areas which offer a different geography which could shed additional results on the role
of a free trade agreement. In addition, I presented the first evidence on the effect of
the returns to scale on the hazard of exports ceasing. Unlike differences along the
product differentiation dimension, which are largely consistent across a number of
countries, the identified effects of returns to scale are exporter specific. Since these
results are based on three exporters only, additional investigation of other countries
References
[1] Antweiler, Werner and Daniel Trefler (2002), “Increasing Returns and All That:
A View from Trade,” American Economic Review, 92(1):93–119.
[2] Baier, Scott L. and Jeffrey H. Bergstrand (2007), “Do Free Trade Agreements Actually Increase Members’ International Trade?,” 71(1):72–95.
[3] Besedeˇs, Tibor (2008), “A Search Cost Perspective on Formation and Duration
of Trade,” Review of International Economics, 16(5):835–849.
[4] Besedeˇs, Tibor (2011), “Export Differentiation in Transition Economies,”
Eco-nomic Systems, 35(1): 25–44.
[5] Besedeˇs, Tibor and Thomas J. Prusa (2006a), “Ins, Outs, and the Duration of
Trade,” Canadian Journal of Economics, 39(1):266–295.
[6] Besedeˇs, Tibor and Thomas J. Prusa (2006b), “Product Differentiation and
Du-ration of U.S. Import Trade,” Journal of International Economics, 70(2):339–
358.
[7] Besedeˇs, Tibor and Thomas J. Prusa (2010), “The Duration of Trade
Relation-ships,” in Bernard Hoekman and Guido G. Porto (eds), Trade Adjustment Costs
in Developing Countries: Impacts, Determinants and Policy Responses, Wash-ington, DC: World Bank, pp. 265–282.
[8] Besedeˇs, Tibor and Thomas J. Prusa (2011), “The Role of Extensive and
Inten-sive Margins and Export Growth,” Journal of Development Economics, 96(2):
371–379.
[9] Brenton, Paul, Christian Saborowksi, and Erik von Uexkull (2010), “What
Ex-plains the Low Survival Rate of Developing Country Export Flows?” World
Bank Economic Review, 24(3): 474–499.
[10] Cadot, Olvier, Leonardo Iacovone, Ferdinand Rauch, and Denisse Pierola (2010), “Success and Failure of African Exporters,” World Bank working paper.
[11] Clausing, Kimberly (2001), “Trade Creation and Trade Diversion in the Canada–
United States Free Trade Agreement,” Candian Journal of Economics, 92(4):
889–904.
[12] Debaere, Peter and Shalah Mostashari (2010), “Do Tariffs Matter for the
Exten-sive Margin of International Trade? An Empirical Analysis,” Journal of
Inter-national Economics, Vol. 81, No. 2, 163–169.
[13] Fugazza, Marco and Ana Cristina Molina (2009), “The Determinants of Trade Duration,” HEI Working Papers No. 5.
[14] G¨org, Holger, Richard Kneller, and B`alazs Murak¨ozy (2008), “What Makes a Successful Export? Evidence from Firm–product Level Data,” CeFiG Working Papers, No. 2.
[15] Hess, Wolfgang and Maria Persson (2010a), “Exploring the Duration of EU Im-ports,” Working Papers 2010:4, Lund University, Department of Economics.
[16] Hess, Wolfgang and Maria Persson (2010b), “The Duration of Trade Revisited: Continuous-Time vs. Discrete-Time Hazards,” Working Papers 2010:1, Lund University, Department of Economics.
[17] Iacovone, Leonardo, Ferdinand Rauch and Alan J. Winters (2010), “Trade as En-gine of Creative Destruction: Mexican Experience with Canadian Competition,” London School of Economics, mimeo.
[18] Jaud, M´elise, Madina Kukenova, and Martin Strieborny (2009), “Financial De-pendence and Intensive Margin of Trade,” Paris School of Economics Working Paper 2009–35.
[19] Kehoe, Timothy J. and Kim J. Ruhl (2009), “How Important is the New Goods Margin in International Trade?”, Federal Reserve Bank of Minneapolis Research Department Staff Report 324.
[20] Melitz, M. (2003), “The Impact of Trade on Intra-Industry Reallocations and
Aggregate Industry Productivity,” Econometrica, 71(6):1695–1725.
[21] Nitsch, Volker (2009), “Die Another Day: Duration in German Import Trade,”
Review of World Economics, 145(1):133–154.
[22] Rauch, James E. and Joel Watson (2003), “Starting small in an unfamiliar
en-vironment,” International Journal of Industrial Organization, 21(7):1021–1042.
[23] Romalis, John (2007), “NAFTA’s and CUSFTA’s Impact on International
Trade,” Review of Economics and Statistics, 89(3):416–435.
[24] Trefler, Daniel (2004), “The Long and Short of the Canada–U.S. Free Trade
A
Data Appendix
Data used in this paper are available from public sources.
Data Source
U.S. exports U.S. Census Bureau, U.S. Imports CDs and DVDs Canadian and Mexican UN Comtrade
exports
GDP World Bank’s World Development Indicators
Distance, contiguity, common CEPII
language and colonial http://www.cepii.fr/anglaisgraph/bdd/gravity.htm history
Returns to Scale classification Antweiler and Trefler (2002) Economic Risk International Risk Guide
http://www.prsgroup.com/ICRG.aspx