ISSN Online: 2327-5227 ISSN Print: 2327-5219
Convergence Analysis of Iterative Threshold
Decoding Process
Mohammed Lahmer
1, Mostafa Belkasmi
2, Abdallah Rhattoy
11Department of Computer Science, High School of Technologies, Meknes, Morocco 2Department of Network and Telecoms, ENSIAS, Rabat, Morocco
Abstract
Today the error correcting codes are present in all the telecom standards, in particu-lar the low density parity check (LDPC) codes. The choice of a good code for a given network is essentially linked to the decoding performance obtained by the bit error rate (BER) curves. This approach requires a significant simulation time proportional to the length of the code, to overcome this problem Exit chart was introduced, as a fast technique to predict the performance of a particular class of codes called Turbo codes. In this paper, we success to apply Exit chart to analyze convergence behavior of iterative threshold decoding of one step majority logic decodable (OSMLD) codes. The iterative decoding process uses a soft-input soft-output threshold decoding algo-rithm as component decoder. Simulation results for iterative decoding of simple and concatenated codes transmitted over a Gaussian channel have shown that the thre-sholds obtained are a good indicator of the Bit Error Rate (BER) curves.
Keywords
OSMLD, EXIT, BER, Mutual Information, Iterative Threshold Decoding Extrinsic Information, LLR
1. Introduction
Since its introduction, the iterative threshold decoding algorithm (ITDA) [1] of one step majority logic decodable codes has gained great interest [2] [3] [4] and this is for several reasons. In fact, OSMLD codes are a subclass of LDPC codes currently present in most telecoms standards, but can be decoded iteratively by ITDA which is less com-plex than belief propagation algorithm with approximatively the same performances. Getting the performance of these codes is carried out by simulation to evaluate the evolution of the BER compared to the SNR. However, this operation is very expensive
How to cite this paper: Lahmer, M., Bel-kasmi, M. and Rhattoy, A. (2016) Conver-gence Analysis of Iterative Threshold De-coding Process. Journal of Computer and Communications, 4, 98-107.
http://dx.doi.org/10.4236/jcc.2016.414008
Received: August 26, 2016 Accepted: November 25, 2016 Published: November 28, 2016
Copyright © 2016 by authors and Scientific Research Publishing Inc. This work is licensed under the Creative Commons Attribution International License (CC BY 4.0).
in terms of time, especially for long codes. To address this problem, different techniques have been proposed in the literature to analyze the iterative decoding of concatenated codes [5] [6] [7]. The most used method is based on mutual information known as the Exit (Extrinsic Information Transfer) Chart. Indeed, it has been shown by simulation (case of a frame of large size) [8] that the model used by the extrinsic exchanged be-tween the decoders is Gaussian. Moreover, the study of a single decoder is sufficient to predict the iterative decoding performances.
All work on the Exit chart have focused around the iterative decoding of convolution codes, however, in this paper, we propose to apply it to analyze the convergence beha-vior of the iterative decoding threshold of one step majority decodable codes. Our work is distinguished by the fact that the codes used are structural block codes completely different from that of convolutional codes and that are decoded by our iterative decod-ing algorithm [1] [2].
The organization of this article is as follows: Section 2 describes the iterative thre-shold decoding process. In Section 3, we begin with the presentation of the principle of calculating the Exit Chart and end with behavior analysis of convergence of ITDA when applied in both simple and concatenated OSMLD codes. Section 4 provides some con-clusions.
2. Iterative Threshold Decoding Process
In this section a brief description of our proposed iterative decoding algorithm [1] will be given. We will focus in particular on variables that will serve us for the calculation in the Exit chart.
2.1. Soft-In Soft-Out Threshold Decoder
First, Let us consider a transmission of code word C (n, k, d) of binary symbols {0, 1} using a BPSK modulation over AWGN channel, the decoder soft output for the jth bit position of a given soft input R (r1, r2 ··· rn) is defined as:
Extrinsic Information Soft in 0 4 * s
j j j
E
LLR r Le
N = + (1)
(
)
(
)
1 1 11 tanh 2
ln
1 tanh 2
i
i
n
J k ik
j i n
ik k L Le L = = = + = −
∏
∑
∏
(2)where J is the number of orthogonal parity check equations in code C, ni represents the number of elements in the ith orthogonal equation, ik represents the kth element of the ith parity check equation orthogonal to the jth bit and
0 4 s ik ik E L r N = .
The computation of extrinsic information can be approximated by replacing the formula (2) by:
{ }
1min
i
j ik k n
Le = L = (3)
and can be most easily implemented without undue deterioration in error performance. The algorithmic structure of the SISO threshold decoding can be summarized as fol-lows:
For each bit J=1,,n
Compute the extrinsic information Lej as (3) Compute the Soft-input
[image:3.595.194.555.565.707.2]Compute de Soft-output: LLRj = (4Es/N0) rj + Lej Correct de bit rj
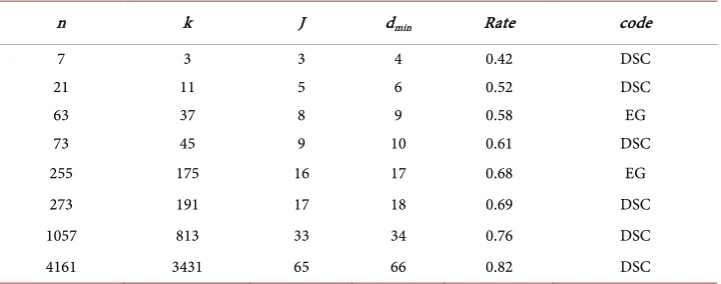
Table 1 shows some examples of OSMLD codes that can be decoded by theses codes are also known as self orthogonal codes. In this table we used the abbreviations DSC for Difference Set Cyclic codes, EG for Euclidean Geometry codes and BCH for Bose Chaudhuri and Hocquenghem codes. For an extensive description of projective geome-try codes and Euclidean geomegeome-try can be found in [9].
2.2. Iterative Threshold Decoding Process
The Iterative decoding process (see Figure 1) can be described as follows: In the first iteration, the decoder only uses the channel output as input, and generates extrinsic in-formation for each symbol. In subsequent iterations, a combination of extrinsic infor-mation and channel output is used as input.
The soft input respectively the soft output of the qth iteration is given by:
( )
( )
e( )R q = +R α q L q (4)
( )
( )
(
)
0
4
1
s
e
E
LLR q R q L q N
= + + (5)
where R represent the received data, Le(q) is the extrinsic information computed by the previous iteration. In our procedure we use a fixed value 1/J for the pparameter α
( )
qand this for all iterations. The value chosen for α
( )
q reacts as if one took an averageof all J estimators which contribute in the computation of Le.
Our iterative decoding process can also be applied to the concatenated codes; in this case R is a matrix whose rows are constructed from the C1 code and columns from C2
Table 1. Set of OSMLD Codes.
n k J dmin Rate code
7 3 3 4 0.42 DSC
21 11 5 6 0.52 DSC
63 37 8 9 0.58 EG
73 45 9 10 0.61 DSC
255 175 16 17 0.68 EG
273 191 17 18 0.69 DSC
1057 813 33 34 0.76 DSC
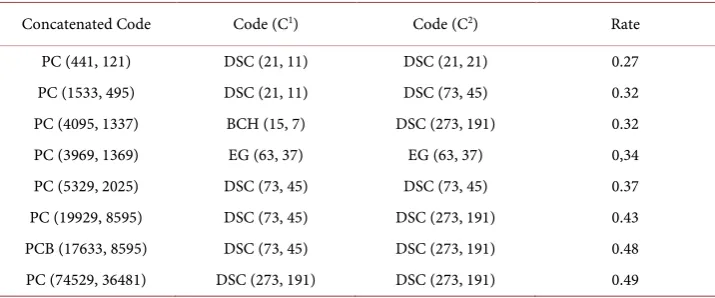
code. Extrinsic information computed by the SISO decoder of code C1 is given as a pri-ori information to the second SISO decoder of code C2. Table 2 shows some code built from the concatenation of OSMLD codes.
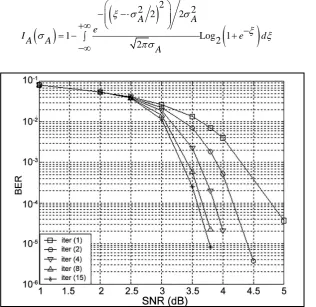
We wish to emphasize that our algorithm can be applied to simple majority decoding codes, product codes (PC) or parallel (PCB) [2], serial concatenated codes [4] and quasi-cyclic codes [3]. Indeed in [10] we showed that our algorithm has a good com-promise between complexity and performance compared to the belief propagation al-gorithm (BP). For example, for the code DSC (273, 191) our alal-gorithm is 5 times faster than BP. Figure 2 depicts the performance of iterative decoding of (1057, 813) DSC code with rate 0.69 on AWGN channel. We can see that the performance improves with each iteration and no improvement after 15th iteration, at this stage we can said that the decoding process has converged. The number of iterations for convergence as well as the SNR at which begins the enhancement (Point of separation of the different curves) will be predicted by the Exit chart.
3. Convergence Behavior Analysis
3.1. Exit Chart Computation
[image:4.595.211.537.427.499.2]EXIT chart [5] [6] [7] [8] has emerged as a useful tool for analyzing convergence beha-vior of iterative decoding of both Turbo codes and LDPC codes. Theses diagrams pro-pose a graphic visualization of the evolution of the quality of the extrinsic information exchanged between two SISO decoders (Turbo codes) or between variable nodes and check nodes in case of LDPC codes. We succeed to apply EXIT charts technique to our
Figure 1. The block diagram of the qth iteration.
Table 2. Set of concatenated codes.
Concatenated Code Code (C1) Code (C2) Rate PC (441, 121) DSC (21, 11) DSC (21, 21) 0.27 PC (1533, 495) DSC (21, 11) DSC (73, 45) 0.32 PC (4095, 1337) BCH (15, 7) DSC (273, 191) 0.32 PC (3969, 1369) EG (63, 37) EG (63, 37) 0,34 PC (5329, 2025) DSC (73, 45) DSC (73, 45) 0.37 PC (19929, 8595) DSC (73, 45) DSC (273, 191) 0.43 PCB (17633, 8595) DSC (73, 45) DSC (273, 191) 0.48 PC (74529, 36481) DSC (273, 191) DSC (273, 191) 0.49
R(q)
LLR(q+1)
Le(q+1)
R
Le(q)
Threshold
[image:4.595.194.552.558.707.2]iterative decoding process while only one SISO decoder is used. The evolution of ex-trinsic information at the output of our SISO decoder is visualized during iterations.
Figure 3 represents the simulation model to be implemented for calculation of EXIT chart. Let X denote the binary input to an additive white Gaussian noise AWGN chan-nel, X = {±1}, and LCH its corresponding output expressed as a log-likelihood ratio LLR. The soft-input/soft-output (SISO) decoder receives as its input both LCH and a priori information LA, which is also expressed as a LLR.
For purposes of the analysis, it is assumed that the sequences {LA} and {LCH} at the input to the decoder are infinitely long. One can easily show that { LCH } Gaussian (conditioned on X) with parameters (2/σ², 4/σ²) where σ² = N0/2Es. Under the
assump-tion that the a priori LLR {LA} follows a Gaussian distribution we have LA =
µ
X
+
η
where 2
2
A
µ σ
=
and η are a Gaussian variable of zero mean and variance 2 Aσ
. The mutual information IA = I (X; A) between X and A which can be expressed as:( )
(
)
(
)
2
2 2 2 2
1 Log2 1
2
A A
e
IA A e d
A
ξ σ σ
ξ
σ ξ
πσ
− − ⋅
+∞ −
= − ∫ +
−∞ (6)
[image:5.595.219.529.610.688.2]Figure 2. BER performance of (1057, 813) code on AWGN channel.
Figure 3. Exit chart computing model.
Coder AWGN SISO
Decoder
U
LA LCH
LE X
We put
( )
1
A J IA
σ = − (7)
where limσ →0J=0 and limσ →0J =1. The function J is monotonically increasing and can be calculated numerically only once because J and J−1 are the same for all codes.
On the other hand the mutual information between the extrinsic LLR of the IE and X, IE = I (X; E) can be expressed as:
On the other hand the mutual information between the extrinsic LLR of the IE and X, IE = I (X; E) can be expressed as:
(
)
(
)
1 1 log 1
E E
I +∞p
ξ
X e−ξ dξ
−∞
= −
∫
= + (8)It is impossible to express this relation in analytical form; the distributions pE is most conveniently determined by means of Monte Carlo simulation. Viewing IE as a function of IA and the signal to noise ratio SNR value, the extrinsic information transfer characteristics is defined as:
(
,SNR)
E A
I =T I (9)
For a concatenated constructed from C1 (n1, k1) and C2 (n2, k2) and a fixed SNR, the different steps of calculation can be summarized as follow:
Initialize a word w of size (k1 × k2) with bit 0 Initialize the maximum of iteration at Max Modulate w with Binary phase shift key (BPSK) Transmit de code word over an AWGN channel Do
Generate LA for columns (AWGN/σA) and compute IA Decode Lines of the received word and compute IE σA = σA + (σA/Max)
Iteration = Iteration + 1 While (iteration! = Max)
3.2. Convergence Analysis of ITD
In order to guarantee a good approximation of the graphical output, it is convenient to work with blocks of size of the order of 105. However, the approximation of the distribution of LE by a Gaussian variable is checked in the case of finite length codes (Figure 4). This assumption will allow us to validate curves Exits reports rated to the BER curves.
Figure 4 shows the evolution of the distribution of the extrinsic information at the output of the SISO threshold decoder of PC code (74529, 36481). We simulated the transmission of a frame without any approximation.
Transfer characteristics IE =T I
(
A,SNR)
for different SNR are shown in Figure 5.Figure 4. Evolution of the distribution of the extrinsic LE based on
itera-tions.
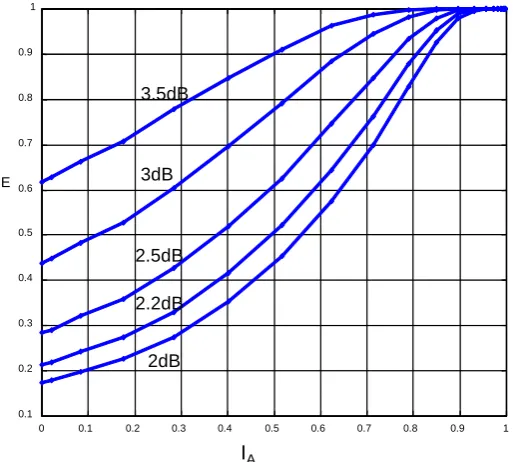
Figure 5. Extrinsic information transfer characteristics of SISO decoder
for code (819, 447) on AWGN channel.
To view the convergence behavior of the iterative decoding, we draw in the same fig-ure (see Figure 6) the exit charts of the two decoders. In the case of a symmetrical con-catenated code the curve of the second decoder is obtained by inverting the symmetry axis of the IE and IA.
Iteration 2
Iteration 4 Iteration 1
0 0.1 0.2 0.3 0.4 0.5 0.6 0.7 0.8 0.9 1
0.1 0.2 0.3 0.4 0.5 0.6 0.7 0.8 0.9 1
3.5dB
3dB
2.5dB 2.2dB 2dB
IA
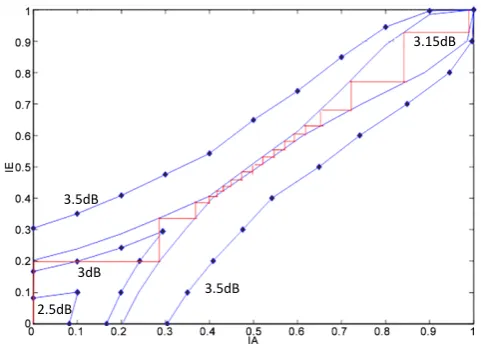
[image:7.595.244.501.364.595.2]Figure 6 depicts the Exit chart of the concatenated code PC (74529, 36481) con-structed from DSC (273, 191) for SNR 2.5, 3, 3.15 and 3.5 dB. The expected decoding trajectory is the “stairs”-like and can be explained as follows: Let q be the iteration in-dex. For q = 0 the decoding process starts at the origin with zero a priori knowledge IA,0 = 0. At iteration q, the extrinsic output IE,q = T (IA,q) is forwarded as a priori knowledge for the next decoder IA,q+1 = IE,q, and so on, until IA = IE = 1 after about 16 iterations. Each step of the staircase curve represents one iteration of the decoding process.
[image:8.595.258.491.484.676.2]Figure 7 shows the Exit chart curve for iterative decoding of asymmetric concate-nated code constructed from DSC (273, 191) and DSC (73, 45) at SNR 2.8 dB. In this case and contrary to the result obtained in the figure 6 we calculated and plotted the transfer curves for each Component elementary decoder. As we can see both transfer curves enters a tunnel at SNR = 2 dB away from the x = y − axis.
Figure 6. Exit charts of PC code (74529, 36481) and decoding
tra-jectory on a Gaussian channel.
Figure 7. Exit charts of asymmetric concatenated code (19929,
8595) at SNR = 2.8 dB.
2.5dB
3.15dB
3dB 3.5dB
3.5dB
0 0.1 0.2 0.3 0.4 0.5 0.6 0.7 0.8 0.9 1
0 0.1 0.2 0.3 0.4 0.5 0.6 0.7 0.8 0.9 1
BER chart vs. Exit chart
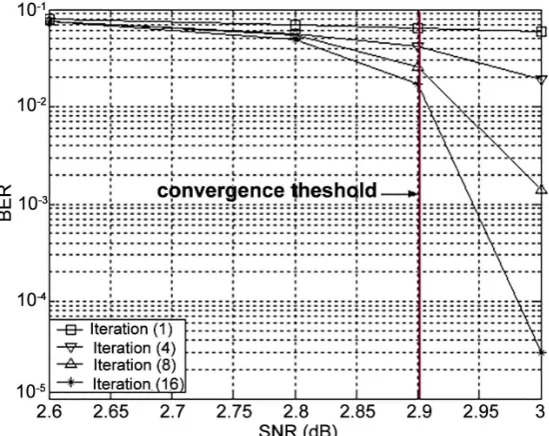
Two main regions can be defined from the curve of BER (see Figure 8). The first is called “pinch-off Region” (for SNR < 2.9 dB) whose BER remains constant and itera-tion has no effect. The second is called “waterfall Region” (SNR > 2.9 dB) here, the BER decreases excessively when the rate increases SNR. These three regions can be illu-strated using the exit chart (see Figure 6).
“Pinch-off Region” the two decoders transfer curves cross at small values of mutual information (no convergence).
“Waterfall Region”: the decoding trajectory enters a tunnel area [5] near the bisector with a slower convergence rate.
[image:9.595.235.510.456.674.2]For SNR = 3.15 dB we can observe that the decoding trajectory enters an area of tunnel close to the x = y − axis with a deceleration characteristic of convergence’s speed. The bit error rate (BER) versus SNR performance on AWGN channel is displayed in
Figure 8. As we can observe, the waterfall region appears to take shape at SNR > 2.9 dB, which is 0.25 dB away from Exit chart threshold. This uncertainty of estimate is due mainly to the fact that we use a code with finite length.
4. Conclusion
In this work, we applied Exit chart as a semi analytic method to predict convergence behavior of our iterative threshold decoding for simple and concatenated OSMLD codes with medium length and a gap of 0.3 dB was found compared to BER chart. This uncertainty of estimate is due mainly to the fact that we use a code with finite length. The great interest of Exit chart is mainly due to the time we gain compared to the si-mulation based on BER. Indeed if we assume that θ is the decoding time of one frame
Figure 8. BER performances of ITD of PC code (74529, 36481) on a
and frame it takes to generate the BER is 1000, then the gain is of the order of 1000 × θ. As future work, we plan to apply the Exit on a concatenation of OSMLD codes with a convolutional code of rate 1, but also we believe that the Exit Chart can be applied to other non-linear iterative process such as that used in learning neural network.
References
[1] Belkasmi, M., Lahmer, M. and Benchrifa, M. (2006) Iterative Threshold Decoding of Paral-lel Concatenated Block Codes. Turbo Coding 2006 Conference, Munich, 4-7 April 2006. [2] Lahmer, M. and Belkasmi, M. (2010) A New Iterative Threshold Decoding Algorithm For
One Step Majority Logic Decodable Block Codes. International Journal of Computer Ap-plications, 7, No. 7. https:/doi.org/10.5120/1265-1697
[3] Rkizat, K., Yatribi, A., Lahmer, M. and Belkasmi, M. (2016) Iterative Threshold Decoding of High Rates Quasi-Cyclic OSMLD Codes. International Journal of Advanced Computer Science and Applications, 7, No. 4. https:/doi.org/10.14569/IJACSA.2016.070468
[4] Ayoub, F., Farchane, A., Askali, M., Belkasmi, M. and Himmi, M. (2016) Serially Concate-nated OSMLD Codes Design and Iterative Decoding. Applied Mathematical Sciences, 10, 2179-2188.
[5] ten Brink, S. (1999) Convergence of Iterative Decoding. Electronics Letters, 35, 806-808.
https:/doi.org/10.1049/el:19990555
[6] Richardson, T. and Urbanke, R. (2000) Thresholds for Turbo Codes. Proceedings of ISIT
2000, Sorrento, Italy, June 2000, 317. https:/doi.org/10.1109/isit.2000.866615
[7] Richardson, T.J. and Urbanke, R.L. (2001) The Capacity of Low-Density Parity-Check Codes under Message-Passing Decoding. IEEE Transactions on Information Theory, 47, 599-618.
https:/doi.org/10.1109/18.910577
[8] ten Brink, S. (2001) Convergence Behavior of Iteratively Decoded Parallel Concatenated Codes. IEEE Transactions on Communications, 49, 1727-1737.
https:/doi.org/10.1109/26.957394
[9] Lin, S. and Costello, D.J. (1983) Error Control Coding, Fundamentals and Applications. Prentice-Hall, Englewood Cliffs, NJ.
Submit or recommend next manuscript to SCIRP and we will provide best service for you:
Accepting pre-submission inquiries through Email, Facebook, LinkedIn, Twitter, etc. A wide selection of journals (inclusive of 9 subjects, more than 200 journals)
Providing 24-hour high-quality service User-friendly online submission system Fair and swift peer-review system
Efficient typesetting and proofreading procedure
Display of the result of downloads and visits, as well as the number of cited articles Maximum dissemination of your research work