ISSN Online: 2167-9509 ISSN Print: 2167-9495
Himalayan Warming and Climate Change in India
Vadlamudi Brahmananda Rao
1, Sergio Henrique Franchito
1, Renato Orrú Pedroso Gerólamo
1,
Emanuel Giarolla
1, Surireddi Satyavenkata Venkata Siva Ramakrishna
2, Bodda Ravi Srinivasa Rao
2,
Chennu Vankateswara Naidu
21Center for Weather Prediction and Climate Studies, INPE, São José dos Campos, S.P., Brazil 2Department of Meteorology and Oceanography, Andhra University, Visakhapatanam, India
Abstract
Recent studies showed that the Himalayan glaciers are reducing alarmingly. This is attributed to global warming. Since the melt water of Himalayan glaciers and snow is the principal source of water for several rivers, a decrease of this source is a calamity for the large fraction of global population living in nearby regions such as India. In Asia for the 60% global population only 36% of global water is available. Any further decrease of this vital necessity makes the very existence of billions of people doubtful. Here we show, using both observations and one IPCC-AR4 model with high hori-zontal resolution, that the Himalayan region in fact underwent a maximum warming of 2.5˚C from 1950 to 1999 and would reach the highest temperature rise of 9˚C in 2100. Temperature and rainfall variations determine a simple climate classification proposed by Köppen. We show changes that occur in climate and biosphere using this classification. Also we discussed the impact of warming and resulting changes in Köppen climates on the floods and malaria in India.
Keywords
Himalayan Glaciers, Global Warming, Floods in India, Malaria in India, IPCC AR4 Model, Köppen Climates
1. Introduction
An inevitable consequence of most of the human activity such as industrial revolution is the burning of fossil fuels, a process which oxidizes carbon into carbon dioxide (CO2)
leading to increase of this greenhouse gas. Increase of CO2 enhances the trapping of
heat radiated from earth resulting in higher air temperatures, or to global warming. It is well known that in nearby regions response to global warming is not uniform and va-ries from one place to other. Warming over the mountains such as Andes and
Hima-How to cite this paper: Rao, V.B., Fran-chito, S.H., Gerólamo, R.O.P., Giarolla, E., Ramakrishna, S.S.V.S., Rao, B.R.S. and Nai-du, C.V. (2016) Himalayan Warming and Climate Change in India. American Journal of Climate Change, 5, 558-574.
http://dx.doi.org/10.4236/ajcc.2016.54038
Received: November 17, 2016 Accepted: November 25, 2016 Published: November 28, 2016
Copyright © 2016 by authors and Scientific Research Publishing Inc. This work is licensed under the Creative Commons Attribution International License (CC BY 4.0).
layas reduces the glaciers which are the main source of water for the populations that depend on melt water [1] [2] [3] [4]. [2] [3] [4] showed that Himalayan glaciers are re-treating alarmingly. These glaciers with warming release melt water that feeds the tri-butaries of several rivers such as Ganges, Indus, Brahmaputra, Mekarg, Yang-Tse, Iran-di and others with glacial melt contributing up to about 45% of the total river flow [5]. Presently in Asia for the 60% of global population only 36% of global water is availa-ble [6]. Thus, this vital necessity for human, animal and plant life is already scarce in this part of the globe. Any further decrease makes the very existence of life doubtful. Thus the mass loss of Himalayan glaciers due to warming is of great societal concern.
A simple and sure way of verifying the global warming is to check for temperature rise. There are some studies suggesting warming over the Himalayas [7] [8] [9] [10]. Over Tibetan Plateau, [7] noted a warming of 0.16˚C per decade and using 7 instru-mental records. [8] suggested that the western Himalayas (Karakoram glaciers) are cooling associated with thickening and expansion of some glaciers in contrast to decay and retreat of eastern Himalayas. However, in a recent study [11] found that Naimo-na’nyi glacier in the Himalaya (30˚27.06'N, 81˚91.94'E) not far from Karakoram glaci-ers is losing mass probably due to warming. [12] noted that the long term trends in the maximum, minimum and mean temperatures over northwest Himalaya during the twentieth century showed significant rise in the air temperature with winter warming occurring at a faster rate. [9] presented observational evidence to show that the surface air temperature on the eastern Himalayas or Tibetan Plateau has increased by about 1.8˚C over the period 1960-2007. [10], using the microwave satellite measurements, showed that the tropospheric temperature over western Himalayas has increased 2.7˚C in the period 1979-2007 during the premonsoon season (March, April and May).
In view of the strong societal implications of the Himalayan glacier mass loss due to increase of temperature, it is of crucial importance to know how the temperature varies in a warming scenario. This can only be provided by one of the latest generation of global climate models with some degree of reliability. In the present study we use a high resolution [13] Ocean Coupled Atmospheric General Circulation Model (GCM) to es-timate the temperature change over the Himalayan regions. Although in the beginning different GCMs gave different estimates of temperature change for a given concentra-tion of CO2, recently they seem to have become more reliable converging to the same
result [14]. Also it was shown that models that have higher fidelity for reproducing the present climate, predict higher values of global warming for doubled CO2[15].
In a simple climate classification proposed by Köppen, surface air temperature is the principal meteorological element (finer divisions are based on precipitation). Köppen’s classification can be effectively used to study biosphere changes [16]. In this paper we investigate the climate change, in particular, temperature variation and changes in bios-phere in India and surrounding regions. Also we analyze the impact of these changes on floods in rivers fed by Himalayan snow and glacier melt and a tropical disease, Malaria.
2. Data Sources
ob-tained from [17]. The horizontal resolution is 0.5˚ latitude and longitude. For the mod-el data, we used MIHR data [13]. The model results are for A1B Scenario (IPCC). The A1B scenario assumes significant innovations in energy technologies, which improve energy efficiency and reduce the cost of energy supply. Such improvements occur across the board and neither favor, nor penalize, particular groups of technologies. A1B scenario assumes, in particular, drastic reductions in power-generation cost, through the use of solar, wind and other modern renewable energies, and significant progress in gas exploration, production, and transport. This results in a balanced mix of technolo-gies and supply sources with technology improvements and resource assumptions such that no single source of energy is overly dominant.
Table 1 gives the horizontal resolution of all the 21 models used in [13] IPCC (2007). It can be seen that the MIHR model has the highest horizontal resolution (1.125 lati-tude and longilati-tude) compared to 20 others models of IPCC. Since the horizontal reso-lution of observed data source [17] is 0.5˚ latitude and longitude, we selected MIHR model data which has the best horizontal resolution. We used the Köppen classification for the biome distributions and bioclimatic classification. This simple climatic classifi-cation has advantages over complex dynamic vegetation models in that it is empirical and easy to apply for the prediction of future climates based mainly on temperature and rainfall. Here we used the Köppen vegetation types as given in Table 1 of [16] repro-duced here in Table 2.
Table 1. Horizontal resolution of 21 models.
MODEL RESOLUTION LAT × LON
BCM2 (Norway) 2.8˚ × 2.8˚
CGMR (Canada) 2.8˚ × 2.8˚
CNCM3 (France) 2.8˚ × 2.8˚
CSMK3–CSIRO (Australia) 1.875˚ × 1.875˚
ECHOG (Germany/Korea) 3.75˚ × 3.75˚
FGOALS (China) 2.8˚ × 2.8˚
GFCM2.0 (USA) 2˚ × 2.5˚
GFCM2.1 (USA) 2˚ × 2.5˚
GIAOM (USA) 3˚ × 4˚
GIEH–NASA (USA) 4˚ × 5˚
GIER–NASA (USA) 4˚ × 5˚
HADCM3 (UK) 2.5˚ × 3.75˚
HADGEM (UK) 1.25˚ × 1.875˚
INCM3 (Russia) 4˚ × 5˚
IPCM4 (France) 2.5˚ × 3.75˚
MIHR (Japan) 1.125˚ × 1.125˚
MIMR (Japan) 2.8˚ × 2.8˚
MPEH5 (Germany) 1.875˚ × 1.875˚
MRCGCM (Japan) 2.8˚ × 2.8˚
NCCCSM (USA) 1.4˚ × 1.4˚
Table 2. Köppen vegetation types, reproduced from Gnanadesikan and Stowfer (2006).
Type Name (nominal vegetation type) Criteria
1. Af Tropical wet (Tropical evergreen rainforest) Tmim > 18˚C, not BS or BW, Pmim > 6 2. Am Troipical moist (Tropical evergreen rainforest) Tmim > 18˚C, not BS or BW, 6 > Pmim > (250 - Pyear)/25 3. Aw Troipical dry (Savanna/Woodland) Tmim > 18˚C, not BS or BW, 6 (250 - Pyear)/25 > Pmim
4. BS Semiarid (Bush or grassland) 2 (Tave + Poff) > Pyear > (Tave + Poff) Poff = 0, >30% of rain in winter Poff = 7, no wet season Poff = 14, >30% of rain in summer
5. BW Desert (waste to cactus/seasonal vegetation) (Tave + Poff) > Pyear
6. Cs Temeprate winter wet (Evergreen broadleaf forest) Pmax > #3 Pmim winter max., summer mim. 18˚C > Tmim > −3˚C, not BS or BW,
7. Cfa Hot temperate moist (Broadleaf forest) 18˚C > Tmim > −3˚C, not BS or BW, Not Cs or Cw, Tmax > 22˚C
8. Cfb Warm temperate moist (Broadleaf forest) 18˚C > Tmim > −3˚C, not BS or BW, Not Cs or Cw, Tmax < 22˚C 4-months warmer than 10˚C
9. Cfc Cold temperate moist (Needle-tree forest) 18˚C > Tmim > −3˚C, not BS or BW, Not Cs or Cw, Tmax < 22˚C Less than 4 months warmer than 10˚C
10. Cw Temperate summer wet (evergreen forest) Pmax > 10 Pmim, summer max., winter mim 18˚C > Tmim > −3˚C, not BS or BW,
11. Dab Colder winters//warmer summers (Deciduous forest) Tmax > 10˚C, −3˚C > Tmim, not BS or BW, 4+ months warmer than 10˚C 12. Dc Cold winters/cool summers (Evergreen forest) −3˚C > Tmim, not BS or BW, 4-months warmer than 10˚C 13. Et Tundra (Tundra/dwarf trees, mosses) 10˚C > Tmax > 0˚C, Tmim < −3˚C
14, Ef Polar desert (Pernanent ice or rock, litle plant life) Tmax < 0˚C
3. Results and Discussion
To increase the confidence on regional climate prediction, particularly for a future sce-nario, validation is necessary. We now make an attempt to validate the model temper-ature with observed tempertemper-ature. Figure 1(a) and Figure 1(b) show the temperature in the model and observations respectively for the period 1961-1990. The pattern correla-tion between the model and observed temperature is 0.92. The total number of grid points used for the calculation of pattern correlation is 3286 and the area used is the same as shown in Figure 1.
(a)
(b)
Figure 1. (a) Surface air temperature from MIHR model, mean for the period 1961-1990, (b) Same as (a) but for the Delaware data (Willmott and Matsuura, 2001).
[image:5.595.205.545.77.597.2](a)
(b)
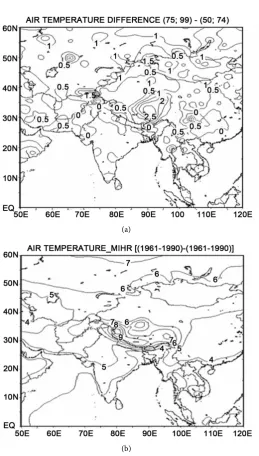
Figure 2. (a) Surface air temperature difference between the periods 1975-1999 and 1950-1974 from observations; (b) Same as (a) but for the period 2070-2099 and 1961-1990. Model data.
Figure 2(b) illustrates the temperature change between the periods 2070-2099 and 1961-1990 as obtained from MIHR. As mentioned earlier, this model shows a pattern correlation of 0.92 with the observed temperature. Thus it seems to be reliable to pre-dict future temperature rise for A1B scenario. Further the systematic errors are can-celled in the difference between the two periods. Over the entire Indian subcontinent
[image:6.595.246.506.59.516.2] [image:6.595.248.508.73.303.2]Himalayas in Figure 2(a) seems to be the cause of the decrease of the glaciers as men-tioned earlier. This together with the future increase of temperature is bound to reduce the water resources. In recent years during the summer monsoon intense rainfall events have increased and moderate rainfall events decreased [18]. The increase of intense events increases the surface runoff and less water is retained in the soil. Thus, the over-all picture of water availability is gloomy both for human consumption and food pro-duction.
Figure 3(a) and Figure 3(b) show, respectively, the surface air temperature trend (˚C/year) in the observations for the period 1950-1999 and in the model for the period
(a)
(b)
Figure 3. (a) Temperature tendency (˚C/year) in observations for the period, 1950-1999; (b)
[image:7.595.229.518.221.669.2]2001-2100. In Figure 3(a) we can see a clear increasing trend with a maximum of a 0.12˚C per year (significant at 99% level by a two sided Student “t” test) over the Hima-layas. In the model results for the future (Figure 3(b)) there is an increasing trend (sig-nificant at 99% level by a two sided Student “t” test) over Himalayas with maximum of around 0.1˚C per year (significant at 99% level by a two sided Student “t” test).
Figure 4(a) shows the monthly temperature variation for the period 2005-2100 in
the model averaged over the area 30˚N - 35˚N, 80˚E - 90˚E. This area approximately
(a)
(b)
[image:8.595.212.533.193.672.2] [image:8.595.219.527.200.433.2]covers the entire Himalayas. A clear rising trend of 0.084˚C per year (significant at 99% level by a two sided “t” test) is seen. The corresponding snow variation amount (kg m−2) for this area is shown in Figure 4(b). A clear decreasing trend of 0.645 kg∙m−2
(significant at 99% level by a two sided “t” test) is seen. However, the quantitative value of the rate of snow decrease is subjected to model uncertainties and errors (see the comment in the conclusion section).
In the model the amount of snow and ice is calculated as a function of increase of temperature. This increase of temperature and decrease of snow and ice amount is be-cause of the strong ice and snow-albedo feedback [19]. This feedback is a strong posi-tive feedback mechanism that is as the temperature increases the amount of snow and ice decreases, decreasing the albedo, which in turn favors higher absorption of solar radiation leading to further increase of temperature. This seems to be the mechanism which is responsible for the increase of temperature seen in Figure 3(a) and Figure 3(b) over the Himalayas. The initial increase of temperature is probably due to the in-crease of greenhouse gases. This small initial inin-crease of temperature has a drastic effect over the Himalayas reducing the snow and ice and because of the snow and ice albedo feedback mechanism, the temperature increases more sharply over the Himalayan re-gion than in other rere-gions.
3.1. Floods in India
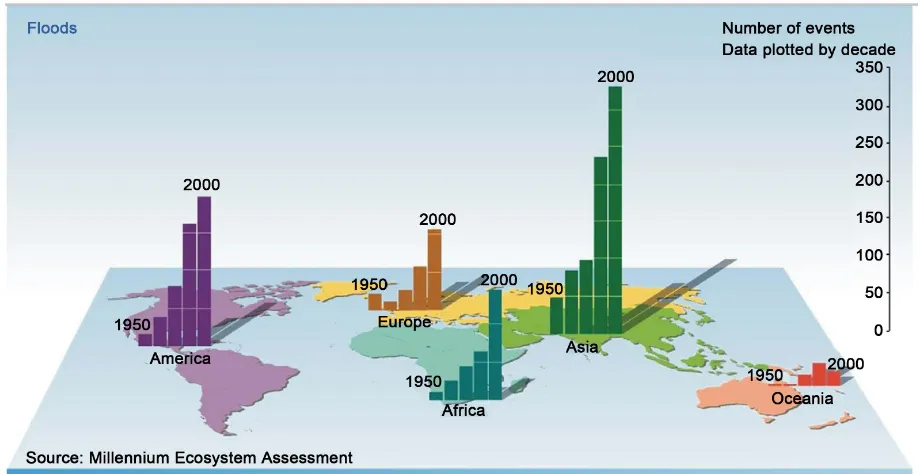
[image:9.595.93.553.445.682.2]In India northern rivers are snow fed and southern rivers are monsoon fed. India is the most flood-affected nation in the world after Bangladesh. It accounts for one fifth (1/5) of global deaths due to floods and on an average thirty million people are evacuated every year. These flood events in India are increasing (see Figure 5) [20].
Geographic regions where water supply is dominated by melting snow and ice are predicted to suffer severe reduction in water volume as a result of warming [21]. Strong negative impacts such as precipitation variability, seasonal shifts in water supply and increased flood risk will offset benefits incurred by short-term increases in runoff from glacier melts [22], such as Himalayan glaciers which form the headwaters for the Indus, Ganges, Brahmaputra and Kosi rivers. The increased warming over the Himalayan glaciers has left many glacier lakes. Rapid accumulation of water in these lakes due to warming might lead to sudden breaching of unstable dams behind which they are formed leading to floods.
Glacial Lake Outburst Floods (GLOFs) can occur because of the resultant discharge of large amounts of water and sediment. [23] noted that in the past 5 decades at least one GLOF event occurred between 3 to 10 years in this region. Bhutiyani et al. 2008
[24] noted a significant increase of high-magnitude flood events in the northwestern Himalayas. Liu et al. 2009 [25] noted that over the Tibetan Plateau annual runoff in-creased by 20% during the past decade and they also noted lake growth.
The ice and snow albedo feedback increases temperature as seen in Figure 2(a), Fig-ure 3(a) and Figure 4(a). The states of Bihar and Assam in India are worst hit by floods in the summer of 2008 and millions of people were affected. The Kosi river of Bihar and the Brahmaputra river of Assam are in spate partly due to the heavy mon-soon rains and partly due to the snowmelt because of the Himalayan warming. In the Arun-Kosi river basins there are several glaciers in Tibet and several glacier lakes, which formed due to the snowmelt because of Himalayan warming. The increase of volume of water caused floods. The Brahmaputra River has its origin in the Himalayan glaciers and thus is directly affected by glacier melting due to Himalayan warming. [26]
studied the floods in Brahmaputra river basin in India. They noted that floods in this river start from June, which probably may partly be due to the melt waters from Hima-layan glaciers. They found that in the Brahmaputra River during the period 1987-1998 at 6 gauges sites a large number of floods occurred.
Although initially ice and snow melt leads to swelling of rivers fed by the melt waters, later the decrease in volume of water leading to scarcity of this vital source is bound to happen.
3.2. Changes in Köppen Climates
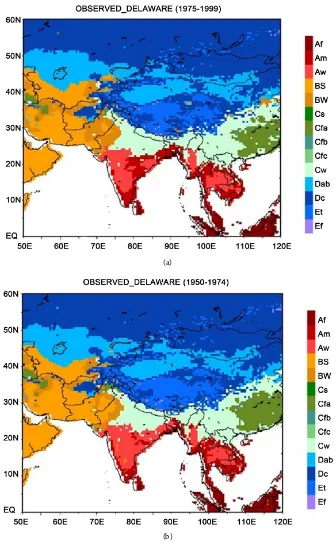
Figure 6(a) shows the real-word distribution of the Köppen climates as obtained from the Delaware temperature and rainfall data [17] for the period 1975-1999. The 14 Köppen climate types and vegetation types are the same as given in an earlier study [16]
(a)
(b)
Figure 6. (a) Observed Köppen climates for the period 1975-1999; (b) Same as (a) but for the pe-riod 1950-1974.
[image:11.595.205.541.71.621.2]south over Thailand, Malaysia and Indonesia, Af (Tropical wet, evergreen rainforest) climate is seen.
In the northwestern India and further west, dry climates Bs (Semiarid, bush to grass-land) and Bw (Desert, waste to cactus/seasonal vegetation) are noted. Further north, cold climates, Et (Tundra, dwarf trees, mosses), Dc (cold winters/cool summers, ever-green forest) and Dab (Cold winters/warm summers, deciduous forest) climates are seen.
A comparison of observed climates for the earlier period (1950-1974) (Figure 6(b)) shows that over the peninsular India Am climates occupied a larger area in recent years (1975-1999). Over northwestern India, the desert climate Bw extended in recent years. A careful examination of Figure 6(b) reveals that over Himalaya some regions were changed from Et to Dc climate, probably because of the increase of temperature, as seen in Figure 2(a). Over eastern China, Cfa climate area has reduced in recent years. This seems to be due to the decrease of temperature, as seen in Figure 2(a).
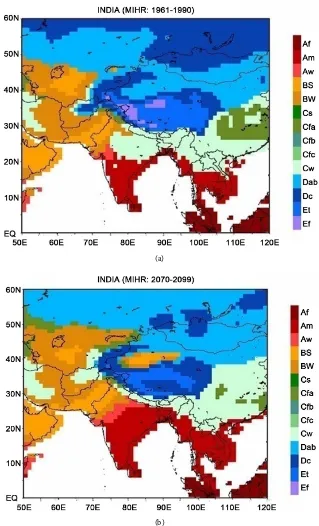
The corresponding model Köppen climates and vegetation types of MIHR are shown in Figure 7(a). The overall climates and vegetation types as observed, such as Am cli-mate of southern India and Sri Lanka, Cw clicli-mate in the north and dry clicli-mates, Bs and Bw in the northwest, seem to be reasonably well simulated. However, there are clear differences. In the peninsular India, observed climate shows a band of Am (monsoon climate) on the eastern side of the Western Ghats changing to Aw to the northeast, while in the model this change was not simulated except for a small part in the north-west. Part of this deficiency in the model could be due to the differences in the hori-zontal resolution, observations are on a 0.5˚ × 0.5˚ latitude and longitude grid while the model is 1.125˚ × 1.125˚ latitude and longitude grid. Cfa climate over eastern China and Am and Af climates over southeast Asia and Indonesia are reasonably well simu-lated, except for a small band of Aw climate observed over Myanmar. Over western Iran the model wrongly shows the Cw climate, which is not seen in observations.
In the simulation of future climate for years (2070-2099) (Figure 7(b)), the results suggest that a large area of Cw climate in the northeastern India and Bangladesh will be reduced and replaced by Am climate. Over northwestern India, Aw climate will be in-creased. An examination of temperature and rainfall showed that these changes are mainly due to increase of temperature and slight increase or decrease of rainfall. Over southeast Asia, also a part of the Cw climate is replaced by Am climate. Over eastern China, Cfa climate is likely to be replaced by Cw climate over a large area with Bs and Bw appearing over western China. Over northern China, Mongolia and eastern Russia, there is a change of Et climate to Dc and Dc climate to Dab climate. This is mainly due to the increase of temperature, as seen in Figure 2(b).
3.3. Malaria in India
(a)
(b)
Figure 7. (a) Model Köppen climates for the period 1961-1990, (b) Same as (a) but for the period 2070-2090.
[image:13.595.213.532.69.595.2]also mentioned that now 45% of all reported cases are due to PF.
A careful examination of our Figure 6(a) and Figure 6(b) shows that from 1975 onwards Am (tropical moist) climates replaced Aw (tropical dry) climates over a larger region in the peninsular India, particularly on the eastern side. It is not a coincidence that these are in fact the regions which contributed to a large part of Malaria in India (See Figure 3 and Figure 4 of [28]).
In future climate (2070-2099) our Figure 7(b) shows that a very large area over India will be occupied by Am climate. This shows the imminent danger of the increase of tropical diseases, in particular Malaria. In a recent study, [29] warned that on a global scale the increasing air temperatures are at odds with the decreasing global trends in endimicity and geographic extent of Malaria. However, we suggest here that there can be a connection between the regional climate change and increase of Malaria and the possible relation between the two is worth investigating. Also, some studies [30] suggest the incidence of Malaria is highly sensitive to climate change and the endemic areas in-creased in some regions.
4. Conclusions
Finally, in conclusion a word of caution should be written. The model projections have limitations because they are based on the lack of correct representation of some complex and still not completely understood processes such as tropical convection. Further, the future AR-4 scenarios assume some social behaviour, which is again un-certain. The results of the present study, however, indicate the imminent danger of ad-verse climate change assessed with the current state of knowledge on populations in this part of the globe. Obviously, it is always safer and prudent to be prepared for the adverse effects of climate change. If this change will not happen or happens to a lesser degree and less rapidly, the consequences on the populations can be less disastrous, of course, if they are prepared for the change.
References
[1] Hastenrath, S. and Ames, A. (1995) Recession of Yanamarey Glacier in Cordillera-Banc, Peru, during the 20th Century. Journal of Glaciology, 41, 191-198.
[2] Kulkarni, A.V., Bahuguna, I.M., Rathore, B.P., Singh, S.K., Randhawa, S.S., Sood, R.K. and Dhar, S. (2007) Glacial Retreat in Himalaya Using Indian Remote Sensing Satellite Data.
Current Science, 92, 69-74.
[3] Kulkarni, A.V., Rathore, B.P., Mahajan, S. and Mathur, P. (2005) Alarming Retreat of Par-bati Glacier, Beas Basin, Himachal Pradesh. Current Science, 88, 1844-1850.
[4] Oerlemans, J. (2005) Extracting Climate Signals from 169 Glacier Records. Science, 308, 675-677. http://dx.doi.org/10.1126/science.1107046
[5] (2003) World Resources Institute.
[6] (2002) UNESCO/International Hydrological Program (IHP). Regional Office of Latin Ame- rica and the Caribbean.
[7] Liu, X.D. and Chen, B.D. (2000) Climatic Warming in the Tibetan Plateau during Recent Decades. International Journal of Climatology, 20, 1729-1742.
http://dx.doi.org/10.1002/1097-0088(20001130)20:14<1729::AID-JOC556>3.0.CO;2-Y [8] Fowler, H.J. and Archer, D.R. (2006) Conflicting Signals of Climatic Changes in the Upper
Indus Basin. Journal of Climate, 19, 4276-4293. http://dx.doi.org/10.1175/JCLI3860.1 [9] Wang, B., Bao, Q., Hoskins, B., Wu, G. and Liu, Y. (2008) Tibetan Plateau Warming and
Precipitation Changes in East Asia. Geophysical Research Letters, 35, L14702. http://dx.doi.org/10.1029/2008gl034330
[10] Gautam, R., Hsu, N.C., Lau, K.-M., Tsay, S.-C. and Kafatos, M. (2009) Enhanced Pre- Monsoon Warming over the Himalayan-Gangetic Region from 1979 to 2007. Geophyisical Research Letters, 36, L07704. http://dx.doi.org/10.1029/2009gl037641
[11] Kehrwald, N.M., Thompson, L.G., Tandong, Y., Mosley-Thompson, E., Schotterer, U., Al-fimov, V., Beer, J., Eikenberg, J. and Davis, M.E. (2008) Mass Loss on Himalayan Glacier Endangers Water Resources. Geophysisical Research Letters, 35, L22503.
http://dx.doi.org/10.1029/2008gl035556
[12] Bhutiyani, M.R., Kale, V.S. and Pawar, N.J. (2007) Long Term Trends in Maximum, Mini-mum and Mean Annual Air Temperatures across the Northwestern Himalayas during the Twentieth Century. Climatic Change, 85, 169-177.
http://dx.doi.org/10.1007/s10584-006-9196-1
[14] Simmons, A.J. and Hollingsworth, A. (2002) Some Aspects of the Improvement in Skill of Numerical Weather Prediction. Quarterly Journal of the Royal Meteorological Society, 128, 647-677. http://dx.doi.org/10.1256/003590002321042135
[15] Shukla, J., Delsole, T., Fennessy, M., Kinter, J. and Paolino, D. (2006) Climate Model Fidel-ity and Projections of Climate Change. Geophysical Research Letters, 33, L07702. http://dx.doi.org/10.1029/2005GL025579
[16] Gnanadesikan, A. and Stowfer, R.J. (2006) Diagnosing Atmosphere-Ocean General Circula-tion Model Errors Relevant to the Terrestrial Biosphere Using the Köppen Climate Classi-fication. Geophysical Research Letters, 33, L22701.
http://dx.doi.org/10.1029/2006GL028098
[17] Willmott, C.J. and Matsuura, K. (2001) Terrestrial Air Temperature and Precipitation: Monthly and Annual Time Series (1950-1999) (Version 1.02). Center for Climatic Research, Department of Geography, University of Delaware.
[18] Goswami, B.N., Venugopal, V., Sengupta, D., Madhusoodanan, M.S. and Xavier, P.K. (2006) Increasing Trend of Extreme Rain Events over India in a Warming Environment.
Science, 314, 1442-1445. http://dx.doi.org/10.1126/science.1132027
[19] Schneider, S.H. and Dickinson, R.E. (1974) Climate Modeling. Review of Geophysical Space Physics, 12, 447-493. http://dx.doi.org/10.1029/RG012i003p00447
[20] http://maps.grida.no/go/graphic/number-of-flood-events-by-continent-and-decade-since-1 950
[21] Barnett, T.P., Adam, J.C. and Lettenmaier, D.P. (2005) Potential Impacts of a Warming Climate on Water Availability in Snow-Dominated Regions. Nature, 438, 303-309. http://dx.doi.org/10.1038/nature04141
[22] Cruz, R.V., Harasawa, H., Lal, M., Wu, S., Anokhin, Y., Punsalmaa, B., Honda, Y., Jafari, M., Li, C. and Huu Ninh, N. (2007) Climate Change 2007: Impacts, Adaptation and Vulne-rability. Edited by Parry, M.L., et al., Contribution of Working Group II to the Fourth As-sessment Report of the Intergovernmental Panel on Climate Change, Cambridge University Press, Cambridge, 469-506.
[23] Bajracharya, S., Mool, P.K. and Shrestha, B.R. (2006) International Symposium on Geo- Disasters, Infrastructure Management and Protection of World Heritage Sites. 25-26 No-vember 2006, Nepal Engineering College, Ehime College and National Society for Earth-quake Technology, 231-242.
[24] Bhutiyani, M.R., Kale, V.S. and Pawar, N.J. (2008) Changing Stream Flow Patterns in the Rivers of Northwestern Himalaya: Implications of Global Warming in the 20th Century.
Current Science, 95, 618-626.
[25] Liu, J., Wang, S., Yu, S., Yang, D. and Zhang, L. (2009) Climate Warming and Growth of High-Elevation Inland Lakes on the Tibetan Plateau. Global and Planetary Change, 67, 209- 217. http://dx.doi.org/10.1016/j.gloplacha.2009.03.010
[26] Dhar, O.N. and Nandargi, S. (2000) A Study of Floods in the Brahmaputra Basin in India.
International Journal of Climatology, 20, 771-781.
http://dx.doi.org/10.1002/1097-0088(20000615)20:7<771::AID-JOC518>3.0.CO;2-Z [27] Dash, A.P., Valecha, N., Anvikar, A.R. and Kumar, A. (2008) Malaria in India: Challenges
and Opportunities. Journal of Biosciences, 33, 583-583. http://dx.doi.org/10.1007/s12038-008-0076-x
[29] Gething, P.W., Smith, D.L., Patil, A.P., Tatem, A.J., Snow, R.W. and Hay, S.I. (2010) Cli-mate Change and the Global Malaria Recession. Nature, 465, 342-094.
http://dx.doi.org/10.1038/nature09098
[30] Martens, W.J.M., Jetten, T.H. and Focks, D.A. (1997) Sensitivity of Malaria, Schistomiasis and Denghe to Global Warming. Climatic Change, 35, 145-156.
http://dx.doi.org/10.1023/A:1005365413932
Submit or recommend next manuscript to SCIRP and we will provide best service for you:
Accepting pre-submission inquiries through Email, Facebook, LinkedIn, Twitter, etc. A wide selection of journals (inclusive of 9 subjects, more than 200 journals)
Providing 24-hour high-quality service User-friendly online submission system Fair and swift peer-review system
Efficient typesetting and proofreading procedure
Display of the result of downloads and visits, as well as the number of cited articles Maximum dissemination of your research work
Submit your manuscript at: http://papersubmission.scirp.org/