R E S E A R C H A R T I C L E
Open Access
Prediction of response to remission
induction therapy by gene expression
profiling of peripheral blood in Japanese
patients with microscopic polyangiitis
Akihiro Ishizu
1*, Utano Tomaru
2, Sakiko Masuda
1, Ken-ei Sada
3, Koichi Amano
4, Masayoshi Harigai
5,6,
Yasushi Kawaguchi
6, Yoshihiro Arimura
7, Kunihiro Yamagata
8, Shoichi Ozaki
9, Hiroaki Dobashi
10, Sakae Homma
11,
Yasunori Okada
12, Hitoshi Sugiyama
13, Joichi Usui
8, Naotake Tsuboi
14, Seiichi Matsuo
14, Hirofumi Makino
15and for
the Research Committee of the Intractable Vasculitis Syndrome and the Research Committee of the Intractable
Renal Disease of the Ministry of Health, Labour, and Welfare of Japan
Abstract
Background:Microscopic polyangiitis (MPA), which is classified as an anti-neutrophil cytoplasmic antibody (ANCA)-associated small vessel vasculitis, is one of the most frequent primary vasculitides in Japan. We earlier nominated 16 genes (IRF7,IFIT1,IFIT5,OASL,CLC,GBP-1,PSMB9,HERC5,CCR1,CD36,MS4A4A,BIRC4BP,PLSCR1,DEFA1/DEFA3,DEFA4, andCOL9A2) as predictors of response to remission induction therapy against MPA. The aim of this study is to determine the accuracy of prediction using these 16 predictors.
Methods:Thirty-nine MPA patients were selected randomly and retrospectively from the Japanese nationwide
RemIT-JAV-RPGN cohort and enrolled in this study. Remission induction therapy was conducted according to the Guidelines of Treatment for ANCA-Associated Vasculitis published by the Ministry of Health, Labour, and Welfare of Japan. Response to remission induction therapy was predicted by profiling the altered expressions of the 16 predictors between the period before and 1 week after the beginning of treatment. Remission is defined as the absence of clinical manifestations of active vasculitis (Birmingham Vasculitis Activity Score 2003: 0 or 1 point). Persistent remission for 18 months is regarded as a“good response,”whereas no remission or relapse after remission is regarded as a“poor response.”
Results:“Poor”and“good”responses were predicted in 7 and 32 patients, respectively. Five out of 7 patients with
“poor”prediction and 1 out of 32 patients with“good”prediction experienced relapse after remission. One out of 7 patients with“poor”prediction was not conducted to remission. Accordingly, the sensitivity and specificity to predict poor response was 85.7% (6/7) and 96.9% (31/32), respectively.
Conclusions:Response to remission induction therapy can be predicted by monitoring the altered expressions of the 16 predictors in the peripheral blood at an early point of treatment in MPA patients.
Keywords:Microscopic polyangiitis, Prediction of response to treatment, Gene profiling, Peripheral blood
* Correspondence:[email protected]
1Faculty of Health Sciences, Hokkaido University, Kita-12, Nishi-5, Kita-ku,
Sapporo 060-0812, Japan
Full list of author information is available at the end of the article
Background
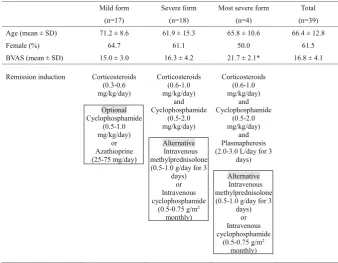
Microscopic polyangiitis (MPA), which is classified as an anti-neutrophil cytoplasmic antibody (ANCA)-associated small vessel vasculitis [1], is one of the most frequent primary vasculitides in East Asia. In Japan, Ozaki et al. conducted a prospective clinical trial on newly diagnosed patients with MPA in which they were administered the remission induction therapy according to disease seve-rity [2]. Briefly, the MPA patients were stratified into three categories based on disease severity, namely mild form, severe form, and most severe form. The mild form included patients with slight disorder of one or more or-gans, a renal-limited type (except rapidly progressive glomerulonephritis (RPGN)), and a pulmonary-limited type (except pulmonary hemorrhage). The severe form consisted of patients with a generalized type (MPA with involvement of more than two organs), pulmo-renal type (glomerulonephritis plus either limited pulmonary hemorrhage or extended interstitial pneumonia), and RPGN. The most severe form included patients with dif-fuse alveolar hemorrhage, intestinal perforation, acute pancreatitis, cerebral hemorrhage, or concurrent pres-ence of anti-glomerular basement membrane antibodies. After the establishment of diagnosis, the patients were treated according to the following protocols. 1) The mild form: low-dose corticosteroids (0.3–0.6 mg/kg/day) were administered; oral immunosuppressive agents (cyclo-phosphamide or azathioprine, 0.5–1.0 mg/kg/day or 25– 75 mg/day, respectively) were optional. 2) The severe form: high-dose corticosteroids (0.6–1.0 mg/kg/day) and oral cyclophosphamide (0.5–2.0 mg/kg/day) were given; intravenous methylprednisolone (0.5–1.0 g/day for 3 days) was considered as an alternative. Instead of oral administration, the use of intravenous cyclophosphamide (0.5–0.75 g/m2 monthly) was also allowed. 3) Most se-vere form: plasmapheresis (2.0–3.0 L/day for 3 days) was employed together with the regimen for the severe form described above.
After 18 months, the outcome of 47 patients, compris-ing of 22 with mild disease, 23 with severe disease, and 2 with the most severe disease, were analyzed. Remission, which is defined as the absence of clinical manifestations of active vasculitis (Birmingham Vasculitis Activity Score 2003: 0 or 1 point), was achieved in 42 out of 47 patients (remission rate, 89.4%). Among the 42 patients, 8 showed relapse of the disease, which is defined as the re-currence of at least one manifestation of vasculitis (re-currence rate, 19.0%). Ultimately, 5 out of 47 patients died (mortality rate, 10.6%).
These results demonstrate that the suggested thera-peutic protocols are applicable for patients with MPA, but the possibility of relapse is indicated and, in the worst case scenario, death may occur regardless of the treatment. We have considered that, if response
to the remission induction therapy would be pre-dicted at an early point during the therapy, meticu-lous follow-up or application of additional regimens to the treatment could expectedly improve the outcome. For this purpose, we focused on the typical alteration of gene expressions after treatment in
“good responders” who were conducted to persistent remission. We considered the prediction of “poor re-sponders” who would not be conducted to remission or would relapse after remission when such typical alteration of gene expressions was not observed in the peripheral blood. Based on the results obtained through the transcriptome analysis, we nominated 16 genes from the comprehensive 8793 genes as predic-tors of response to remission induction therapy in MPA [3]. The 16 predictors included interferon (IFN) regulatory factor (IRF)7, IFN-induced protein with tet-ratricopeptide repeats (IFIT)1, IFIT5, 2′-5′ -oligoadeny-late synthetase-like (OASL), Charcot-Leyden crystal protein (CLC), guanylate binding protein 1 (GBP-1),
proteasome (prosome macropain) subunit, beta type, 9 (PSMB9), hect domain and RLD (HERC)5, chemokine (C-C motif ) receptor 1 (CCR1), CD36, membrane-spanning 4-domains, subfamily A,member 4 (MS4A4A),
XIAP-associated factor-1 (BIRC4BP), phospholipid scramblase 1 (PLSCR1), defensin α1 and α3 (DEFA1/ DEFA3), defensin α4 (DEFA4), and collagen type IX α2 (COL9A2).
In the present study, we determined the accuracy of prediction with the use of the aforementioned 16 predic-tors on 39 MPA patients who were selected randomly and retrospectively from the Japanese nationwide RemIT-JAV-RPGN cohort [4].
Methods
Patient cohorts
of MPA. In both cohorts, only patients without any prior treatment for MPA were enrolled. Patients in the RemIT-JAV-RPGN cohort received remission in-duction therapy according to the Japanese MHLW Guidelines of Treatment for ANCA-Associated Vascu-litis that was reflected in the JMAAV protocol. Thirty-nine MPA patients were selected randomly and retrospectively from the RemIT-JAV-RPGN cohort and included in this study. The baseline characteris-tics of these MPA patients and the given remission induction therapy are shown in Table 1. Written informed consent was obtained from all the patients at their respective institutes where they were being treated. The study protocol was approved by the re-spective institutional ethics committees.
Blood samples and gene expression profiling
Peripheral blood samples (10 mL) were obtained before and 1 week after the beginning of remission induction therapy. Total RNAs were extracted using the PAXgene Blood RNA System (BD, Franklin Lakes, NJ, USA). High throughput real-time reverse transcription polymerase chain reaction (PCR; Applied Biosystems, Carlsbad, CA, USA) was applied to quantify the expression of the 16 genes (IRF7, IFIT1, IFIT5, OASL, CLC, GBP-1, PSMB9,
HERC5, CCR1, CD36, MS4A4A, BIRC4BP, PLSCR1,
DEFA1/DEFA3, DEFA4, andCOL9A2) which were iden-tified as predictors in the earlier study [3].
Regression formula for the prediction index that represents response to remission induction therapy
[image:3.595.126.465.445.708.2]Prior to this study, we have determined the regression formula that reflected the altered expression of the 16 genes by remission induction therapy and the response to the therapy by employing 22 MPA patients from the JMAAV cohort. For this purpose, the Ct value of real-time PCR was applied. The Ct value represents the cycle number in which the PCR products reach the threshold level. The expression level of the target gene was shown as ΔCt (ΔCt = Ct value of the target gene –Ct value of the housekeeping β-actin gene). Next, the changed amount of expression of the target gene by the treat-ment was shown asΔΔCt (ΔΔCt =ΔCt 1 week after the beginning of treatment – ΔCt before treatment). It is considered that when ΔΔCt is 1, the expression level of the target gene before treatment is twofold higher than 1 week after the beginning of treatment. Accordingly, when the expression level of the target gene before treat-ment is set as 1, the fold-expression of the target gene 1 week after the beginning of treatment is shown as 2–ΔΔCt. Subsequently, the response to the treatment was replaced by a dummy number, wherein “good response (persistent remission)” was regarded as 0 and “poor response (relapse after remission or no remission)” was regarded as 1. After these preparations, multiple regres-sion analysis was conducted concerning the 22 MPA patients, including 17 good responders and 5 poor
Table 1Baseline characteristics of MPA patients and given remission induction therapy
*p < 0.05 vs mild form
responders (4 patients relapsed after remission and remission was not achieved in 1 patient).
Prediction of response to remission induction therapy
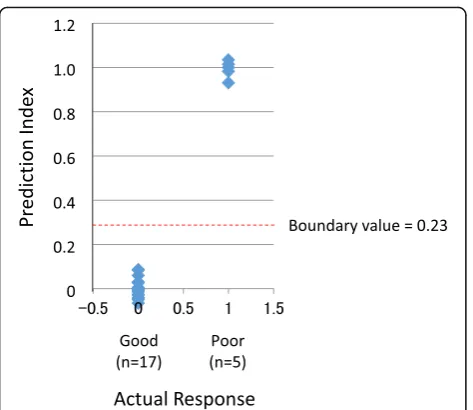
In this analysis, response to the remission induction therapy was replaced by dummy numbers, 0 and 1, wherein 0 means“good response”and 1 means“poor re-sponse.”For the next discrimination analysis, we plotted the receiver operating characteristic (ROC) curve. How-ever, the ROC curve was not suitable for this case (data not shown). Thus, we determined the boundary value as the mean value of the expected prediction indices of the 22 patients. Since 0 was applied to 17 patients and 1 was applied to 5 patients, the mean value of the total of 22 patients was 0.23. Therefore, the prediction index of less than 0.23 predicts “good response,” whereas the value greater than 0.23 predicts“poor response.”
Discrimination analysis
The accuracy of prediction was evaluated by employing another 39 MPA patients who were selected randomly and retrospectively from the RemIT-JAV-RPGN cohort. These patients were completely different from those en-rolled in the derivation of the regression formula for the prediction index.
Results
Determination of regression formula for the prediction index that represents response to remission induction therapy
In our earlier study, we conducted the comprehensive transcriptome analysis using peripheral blood samples obtained before and 1 week after the beginning of remis-sion induction therapy on 12 MPA patients selected ran-domly from the JMAAV cohort (Cohort 1) [3]. Results demonstrated that the expressions of 88 genes were significantly altered after the treatment in 9 “good re-sponders.” This characteristic alteration of gene expres-sion was not observed in 3 “poor responders.” We selected 30 genes that showed the statistically top values among the 88 genes.
Next, in order to identify the most valuable genes for prediction of response to the treatment, the logistic re-gression analysis with stepwise method was carried out on the 30 genes using the add-in Excel software 2012. For this purpose, we employed another cohort, Cohort 2, selected randomly from the JMAAV patients. In brief, 16 genes were selected randomly from the 30 genes at first, and then the influence of the genes on the predic-tion was calculated. Thereafter, the gene which showed the minimum influence on the prediction was replaced by another gene among the remaining 14 genes. This operation was repeated until all genes were used. Subse-quently, the gene with the minimum influence on the
prediction was excluded one by one until the last gene remained. All combinations of genes were examined for prediction of the response to the treatment. Ultimately, the 16 genes, including IRF7,IFIT1,IFIT5, OASL,CLC,
GBP-1,PSMB9,HERC5,CCR1,CD36,MS4A4A,BIRC4BP,
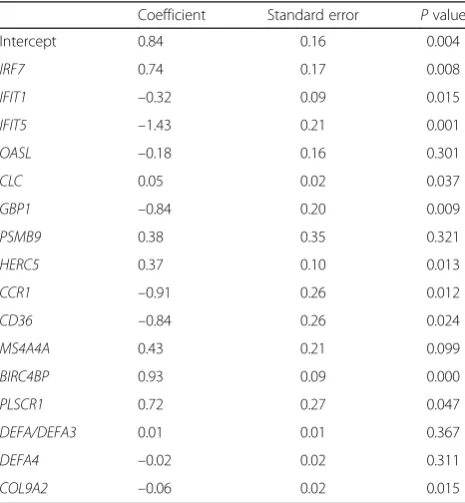
PLSCR1, DEFA1/DEFA3, DEFA4, and COL9A2, were nominated as the most valuable genes for prediction and, at the same time, the regression formula for prediction of response to remission induction therapy was determined as follows. The contribution of the 16 genes to prediction is shown in Table 2.
Prediction index = 0.84 + (0.74) × (2–ΔΔCt of IRF7) + (–0.32) × (2–ΔΔCt of IFIT1) + (–1.44) × (2–ΔΔCt of
IFIT5) + (–0.18) × (2–ΔΔCt of OASL) + (0.05) × (2–ΔΔCt of CLC) + (–0.84) × (2–ΔΔCt of GBP1) + (0.38) × (2–ΔΔCt of
PSMB9) + (0.37) × (2–ΔΔCtofHERC5) + (–0.91) × (2–ΔΔCtof
CCR1) + (–0.84) × (2–ΔΔCt of CD36) + (0.43) × (2–ΔΔCt of
MS4A4A) + (0.93) × (2–ΔΔCt of BIRC4BP) + (0.72) × (2–ΔΔCt of PLSCR1) + (0.01) × (2–ΔΔCt of DEFA1/DEFA3) + (– 0.02) × (2–ΔΔCtofDEFA4) + (–0.06) × (2–ΔΔCtofCOL9A2).
Relevance of regression formula and boundary value for the prediction of response to remission induction therapy
[image:4.595.305.538.479.731.2]In order to determine the relevance of the regression formula and the boundary value for the prediction of response to remission induction therapy, we plotted the prediction indices and actual responses of the 22 train-ing samples together with the boundary value (Fig. 1). Results demonstrate the relevance of the regression formula and the boundary value for prediction.
Table 2Contribution of 16 genes to prediction
Coefficient Standard error Pvalue
Intercept 0.84 0.16 0.004
IRF7 0.74 0.17 0.008
IFIT1 –0.32 0.09 0.015
IFIT5 –1.43 0.21 0.001
OASL –0.18 0.16 0.301
CLC 0.05 0.02 0.037
GBP1 –0.84 0.20 0.009
PSMB9 0.38 0.35 0.321
HERC5 0.37 0.10 0.013
CCR1 –0.91 0.26 0.012
CD36 –0.84 0.26 0.024
MS4A4A 0.43 0.21 0.099
BIRC4BP 0.93 0.09 0.000
PLSCR1 0.72 0.27 0.047
DEFA/DEFA3 0.01 0.01 0.367
DEFA4 –0.02 0.02 0.311
Accuracy of prediction of response to remission induction therapy
To evaluate the accuracy of prediction, the correlation between prediction indices and actual responses to the remission induction therapy was analyzed concerning the next 39 MPA patients (Fig. 2). As a result, “poor” and “good” responses were predicted in 7 and 32 pa-tients, respectively (Table 3). Five out of 7 patients with
“poor” prediction and 1 out of 32 patients with “good” prediction experienced relapse after remission. One out of 7 patients with “poor” prediction was not conducted to remission. Accordingly, the sensitivity and specificity to predict poor response was 85.7% (6/7) and 96.9% (31/ 32), respectively. We determined the 95% confidence in-tervals of the sensitivity and specificity as 0.421–0.996 and 0.838–0.999, respectively.
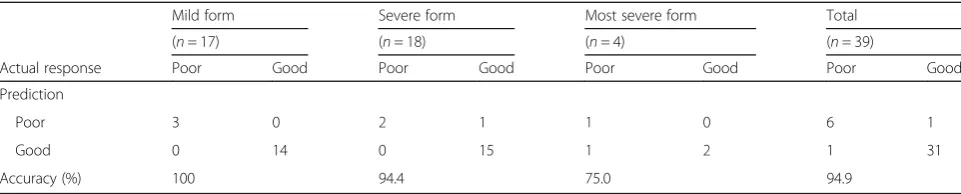
Table 4 demonstrates the detailed results with regard to disease severity. The overall accuracy of prediction is 94.9%, while the accuracy tends to decline as the disease severity increases.
Discussion
Lyons and colleagues reported that the transcriptome analysis of leukocyte subsets before treatment enabled the identification of gene signatures of ANCA-associated vasculitis, including MPA [8]. Similarly, McKinney et al.
reported that the transcription signature of CD8+T cells before treatment could predict prognosis in autoimmune diseases, including MPA [9]. On the contrary, we have focused on the altered gene expression in the peripheral blood of MPA patients between the period before and 1 week after the beginning of remission induction ther-apy. Therefore, it would seem likely that the prediction was based on the effects of the therapeutic reagents included in the remission induction regimen.
Among the 16 genes used as predictors in this study, the expressions ofIRF7,IFIT1,IFIT5,OASL,CLC,GBP-1,
PSMB9, HERC5, CCR1, CD36, MS4A4A, BIRC4BP, and
PLSCR1were decreased, whereas those ofDEFA1/DEFA3,
DEFA4, and COL9A2 were increased after treatment in
“good responders”[3]. The relation between the decrease in several IFN-related genes, such asIRF7[10],IFIT1[11],
IFIT5 [12], OASL [13], and GBP-1 [14], after the anti-inflammatory immunosuppressive treatment and the
“good response” could be profound. ANCA-associated vasculitis, including MPA, has not been regarded as a type 1 IFN-driven disease [8]. We consider the ex-pressions of the IFN-related genes as very sensitive to Fig. 1Relevance of regression formula and boundary value for
prediction of response to remission induction therapy. The prediction indices and actual responses of the 22 training patients, including 17 “good responders”and 5“poor responders,”were plotted together with the boundary value. The boundary value was determined as the mean value of expected prediction indices of the 22 patients. Since 0 was applied to 17 patients and 1 was applied to 5 patients, the mean value of the total of 22 patients was 0.23. Therefore, the prediction index of less than 0.23 predicts“good response,”whereas the value greater than 0.23 predicts“poor response”
[image:5.595.57.294.85.290.2]Fig. 2Prediction indices of 39 MPA patients. The prediction indices and actual responses of the 39 MPA patients, including 32“good responders”and 7“poor responders,”were plotted together with the boundary value.Red dotsrepresent patients whose prediction is inconsistent with actual response
Table 3Predicted and actual responses to remission induction therapy against microscopic polyangiitis (n= 39)
Prediction Actual response
Poor Good
Poor 6 1
[image:5.595.306.539.87.292.2] [image:5.595.305.539.676.732.2]immunosuppressive treatment. Thus, we assume that the alteration can be a good marker of the thera-peutic effects, though the expressions are not signa-tures of the disease.
In addition, we noted that the decrease in CLC gene expression after treatment reflected the“good response.” CLC proteins are mainly expressed in eosinophils [15], and the eosinophil count is rapidly reduced by cortico-steroid treatment; therefore, the reduction of eosinophils in the peripheral blood after treatment possibly predicts
“good response.”However, we could not assess the rela-tion between predicrela-tion and alterarela-tion of leukocyte counts or rates of subpopulations in the peripheral blood after the treatment. This is the limitation of this study. We hope to challenge the clarification of this issue in our future studies.
We have demonstrated that the response to remission induction therapy can be predicted by monitoring the al-tered expressions of the 16 predictors in the peripheral blood at an early point of treatment in MPA patients. On the other hand, the accuracy tends to decline according to the increase in disease severity, though there is no statistical power. A significantly bigger sample size can elucidate the benefits and disadvantages of the prediction in future studies.
Although improvement to increase the sensitivity to predict “poor responders” is needed, such prediction at an early point of treatment, if any, should be significant. This prediction can help us consider meticulous follow-up or application of additional regimens to the treat-ment for the patients who are predicted as “poor responders.”
Conclusions
The response to remission induction therapy can be pre-dicted by monitoring the altered expressions of the 16 predictors in the peripheral blood at an early point of treatment in MPA patients.
Abbreviations
ANCA:Anti-neutrophil cytoplasmic antibody; BIRC4BP: XIAP-associated factor-1; CCR1: Chemokine (C-C motif) receptor factor-1; CLC: Charcot-Leyden crystal protein; COL9A2: Collagen type IXα2; DEFA1/DEFA3/DEFA4: Defensinα1,α3, andα4; EMEA: European Medicines Agency; GBP-1: Guanylate binding
protein 1; HERC5: Hect domain and RLD; IFIT: Interferon-induced protein with tetratricopeptide repeats; IFN: Interferon; IRF: Interferon regulatory factor; MHLW: Ministry of Health, Labour, and Welfare; MPA: Microscopic polyangiitis; MS4A4A: Membrane-spanning 4-domains, subfamily A, member 4; OASL: 2′-5′-Oligoadenylate synthetase-like; PCR: Polymerase chain reaction PLSCR1, Phospholipid scramblase 1; PSMB9: Proteasome (prosome macropain) subunit, beta type, 9; ROC: Receiver operating characteristic; RPGN: Rapidly progressive glomerulonephritis
Acknowledgements
Not applicable.
Funding
This study was supported by grants from the Ministry of Education, Culture, Sports, Science and Technology of Japan (26293082), Ministry of Health, Labour, and Welfare of Japan (Research on Rare and Intractable Vasculitis), and Japan Agency for Medical Research and Development (15ek0109104 and 15ek0109121).
Availability of data and materials
Not applicable.
Authors’contributions
AI designed the study, performed the experiments, analyzed the data, and wrote the manuscript. UT participated in the conception of the study, analysis of the data, discussion of the significance of the study, and writing the manuscript. SM participated in the analysis of the data and discussion of the significance of the study. KS participated in the conception of the study, provided the patient samples, and discussed the significance of the study. KA, MH, YK, and YA provided the patient samples and discussed the significance of the study. SO participated in the conception of the study and discussion of the significance of the study. HD, SH, YO, HS, JU, NT, SM, and HM participated in the analysis of the data and discussion of the significance of the study. All authors read and approved the final manuscript.
Authors’information
Not applicable.
Competing interests
HM is a consultant for AbbVie and Teijin, receives speaker honoraria from Astellas, Boehringer-Ingelheim, Daiichi Sankyo, Dainippon Sumitomo, Kyowa Hakko Kirin, MSD, Pfizer, Takeda, and Tanabe Mitsubishi, and receives grant support from Astellas, Boehringer-Ingelheim, Daiichi Sankyo, Dainippon Sumitomo, Kowa, Kyowa Hakko Kirin, MSD, Novartis, Novo Nordisk, Ono, Otsuka, Pfizer, Taishyo-Toyama, Takeda, Teijin, and Tanabe Mitsubishi. The remaining authors declare that they have no competing interests.
Consent to publication
Not applicable.
Ethical approval and consent to participate
[image:6.595.57.538.98.195.2]Written informed consent was obtained from all the patients at their respective institutes where they were being treated. The study protocol was approved by the respective institutional ethics committees: Ethics Committee of St. Marianna University School of Medicine; Ethics Committee of the Okayama University Graduate School of Medicine, Dentistry and Table 4Accuracy of prediction
Mild form Severe form Most severe form Total
(n= 17) (n= 18) (n= 4) (n= 39)
Actual response Poor Good Poor Good Poor Good Poor Good
Prediction
Poor 3 0 2 1 1 0 6 1
Good 0 14 0 15 1 2 1 31
Pharmaceutical Sciences; Ethics Committee of Kyorin University School of Medicine; Medical Research Ethics Committee of Tokyo Medical and Dental University; Saitama Medical Center Hospital Ethics Committee; Ethics Committee of Tokyo Women’s Medical University.
Publisher’s Note
Springer Nature remains neutral with regard to jurisdictional claims in published maps and institutional affiliations.
Author details
1Faculty of Health Sciences, Hokkaido University, Kita-12, Nishi-5, Kita-ku,
Sapporo 060-0812, Japan.2Department of Pathology, Hokkaido University Graduate School of Medicine, Sapporo, Japan.3Department of Nephrology, Rheumatology, Endocrinology and Metabolism, Okayama University Graduate School of Medicine, Dentistry and Pharmaceutical Sciences, Okayama, Japan.4Department of Rheumatology and Clinical Immunology, Saitama Medical Center, Saitama Medical University, Saitama, Japan. 5Department of Pharmacovigilance, Graduate School of Medical and Dental
Sciences, Tokyo Medical and Dental University, Tokyo, Japan.6Institute of Rheumatology, Tokyo Women’s Medical University, Tokyo, Japan. 7Nephrology and Rheumatology, First Department of Internal Medicine,
Kyorin University School of Medicine, Tokyo, Japan.8Department of Nephrology, Faculty of Medicine, University of Tsukuba, Ibaraki, Japan. 9
Division of Rheumatology and Allergology, Department of Internal Medicine, St. Marianna University School of Medicine, Kawasaki, Japan. 10Division of Hematology, Rheumatology and Respiratory Medicine,
Department of Internal Medicine, Faculty of Medicine, Kagawa University, Kagawa, Japan.11Department of Respiratory Medicine, Toho University Omori Medical Center, Tokyo, Japan.12Department of Pathology, Keio University School of Medicine, Tokyo, Japan.13Department of Human Resource Development of Dialysis Therapy for Kidney Disease, Okayama University Graduate School of Medicine, Dentistry and Pharmaceutical Sciences, Okayama, Japan.14Department of Nephrology, Internal Medicine, Nagoya University Graduate School of Medicine, Nagoya, Japan.15Okayama University Hospital, Okayama, Japan.
Received: 1 February 2017 Accepted: 11 May 2017
References
1. Jennette JC, Falk RJ, Bacon PA, Basu N, Cid MC, Ferrario F, et al. 2012 revised International Chapel Hill Consensus Conference Nomenclature of Vasculitides. Arthritis Rheum. 2013;65:1–11.
2. Ozaki S, Atsumi T, Hayashi T, Ishizu A, Kobayashi S, Kumagai S, et al. Severity-based treatment for Japanese patients with MPO-ANCA-associated vasculitis: the JMAAV study. Mod Rheumatol. 2012;22:394–404.
3. Ishizu A, Tomaru U, Murai T, Yamamoto T, Atsumi T, Yoshiki T, et al. Prediction of response to treatment by gene expression profiling of peripheral blood in patients with microscopic polyangiitis. PLoS One. 2013;8, e63182.
4. Sada KE, Harigai M, Amano K, Atsumi T, Fujimoto S, Yuzawa Y, et al. Comparison of severity classification in Japanese patients with antineutrophil cytoplasmic antibody-associated vasculitis in a nationwide, prospective, inception cohort study. Mod Rheumatol. 2016;26:730–7. 5. Ozaki S. ANCA-associated vasculitis: diagnostic and therapeutic strategy.
Allergol Int. 2007;56:87–96.
6. Watts R, Lane S, Hanslik T, Hauser T, Hellmich B, Koldingsnes W, et al. Development and validation of a consensus methodology for the classification of the ANCA-associated vasculitides and polyarteritis nodosa for epidemiological studies. Ann Rheum Dis. 2007;66:222–7.
7. Sada KE, Yamamura M, Harigai M, Fujii T, Dobashi H, Takasaki Y, et al. Classification and characteristics of Japanese patients with antineutrophil cytoplasmic antibody-associated vasculitis in a nationwide, prospective, inception cohort study. Arthritis Res Ther. 2014;16:R101.
8. Lyons PA, McKinney EF, Rayner TF, Hatton A, Woffendin HB, Koukoulaki M, et al. Novel expression signatures identified by transcriptional analysis of separated leucocyte subsets in systemic lupus erythematosus and vasculitis. Ann Rheum Dis. 2010;69:1208–13.
9. McKinney EF, Lyons PA, Carr EJ, Hollis JL, Jayne DR, Willcocks LC, et al. A CD8+T cell transcription signature predicts prognosis in autoimmune disease. Nat Med. 2010;16:586–91.
10. Xu WD, Zhang YJ, Xu K, Zhai Y, Li BZ, Pan HF, et al. IRF7, a functional factor associates with systemic lupus erythematosus. Cytokine. 2012;58:317–20. 11. Ye S, Pang H, Gu YY, Hua J, Chen XG, Bao CD, et al. Protein interaction for
an interferon-inducible systemic lupus associated gene, IFIT1. Rheumatology (Oxford). 2003;42:1155–63.
12. Katibah GE, Lee HJ, Huizar JP, Vogan JM, Alber T, Collins K. tRNA binding, structure, and localization of the human interferon-induced protein IFIT5. Mol Cell. 2013;49:743–50.
13. Hovnanian A, Rebouillat D, Levy ER, Mattei MG, Hovanessian AG. The human 2′,5′-oligoadenylate synthetase-like gene (OASL) encoding the interferon-induced 56-kDa protein maps to chromosome 12q24.2 in the proximity of the 2′,5′-OAS locus. Genomics. 1999;56:362–3.
14. Prochazka M, Staeheli P, Holmes RS, Haller O. Interferon-induced guanylate-binding proteins: mapping of the murine Gbp-1 locus to chromosome 3. Virology. 1985;145:273–9.
15. Pantanowitz L, Balogh K. Charcot-Leyden crystals: pathology and diagnostic utility. Ear Nose Throat J. 2004;83:489–90.
• We accept pre-submission inquiries
• Our selector tool helps you to find the most relevant journal
• We provide round the clock customer support
• Convenient online submission
• Thorough peer review
• Inclusion in PubMed and all major indexing services
• Maximum visibility for your research
Submit your manuscript at www.biomedcentral.com/submit