AGC in Multi Area Multi Source Deregulated
Power Systems with AC & DC Tie
K. Hari Krishna
1, Dr. K.Chandrasekhar
2Associate Professor, Dept. of EEE, Kallam Haranadhareddy Inst. of Tech., Guntur, Andhra Pradesh, India1
Prof. & H.O.D., Dept. of EEE, R.V.R & J.C. College of Engg. , Guntur, Andhra Pradesh, India2
ABSTRACT: A suitable mathematical model of Thermal-Hydro (T-H), Thermal-Hydro-Gas (T-H-G) Automatic Generation Control (AGC) system under deregulated environment was presented in this paper. The variable power consumption as well as intermittent load variation may cause large fluctuations on system frequency. To reduce the system oscillations, HVDC transmission link between two areas which can allow sudden variation of tie line power can be applied. The system transfer function model comprises thermal, hydro and gas power generations with governor models and system load for studying the dynamic response for small load perturbations along with the model of HVDC transmission link. Integral controllers have been considered in both the areas whose optimal values are obtained by minimising the Integral Squared Error (ISE) technique. The particle swarm optimization (PSO) is applied to solve the control problem to achieve the controller parameters and also to optimize the Integral Controllers of two area power system in deregulated environment. The dynamic responses without and with HVDC link are compared. Simulation studies reveal that with the application of the HVDC link, there is an improvement in AGC in terms of peak amplitudes and deviations in frequencies of both the areas.
KEYWORDS: Automatic Generation control, Particle swarm optimization, HVDC Link.
I.INTRODUCTION
In the traditional power systems, the generation, transmission and distribution are owned by a single entity called a vertically integrated utility (VIU), which supplies power at regulated rates. Such VIUs are interconnected by tie lines to other VIU‘s to enhance reliability. Following a load disturbance within a VIU, the frequency of that VIU experiences a transient change, and the feedback mechanism comes into play and generates an appropriate rise/lower signal to the turbine to make the generation follow the load. In steady state, the generation is matches with the load, driving the tie line power and frequency deviations to zero.
As deregulation in electric industry is a fast approaching reality, the operation and regulation of the power system in this new type of environment will be different from as it was in the regulated scheme. The deregulated power system consists of GENCOs, TRANSCOs, and DISCOs with an open assess policy. In the newly emerged structure, the GENCOs may or may not participate in the LFC task. As a matter fact, Independent system operator leads to make the LFC scheme more reliable. The power system models based on deregulated scenarios has been proposed in [1-15]. Most of the study considers the control problem issue associated with thermal power plants. The LFC study in deregulated structure of three-area power system is presented in [1-3]. The present paper focuses on control problems associated with thermal hydro gad power plants.
For the transmission of electric power over long distances, The HVDC transmission is used as an alternate link in the power system scenario, due to its numerous technical and economical advantages [17-21]. Several models of two area or three area AGC systems with AC and DC tie line between different areas are presented in [72]. The parallel combination of AC and DC transmission lines in two area power systems are considered in [17,21]. Effect of HVDC link on the performance of thermal hydro gas AGC system in deregulated power system is studied in this paper.
design of multi objective PID controller for LFC based on adaptive weighted particle swarm optimization in two-area power system is described in [24,25]. Since PSO is less susceptible to local optima unlike GA, SA, the heuristic evolutionary search technique based hybrid particle swarm optimization has been adopted for determination of optimal PID gains for LFC in four-area power systems having deregulation environments [26].
The main objective of the paper is to consider the three types of generators to be part of AGC (Thermal, Hydro, Gas) and study the improvement in AGC of two area power system under deregulated environment when HVDC transmission link is used to improve the dynamic performance of the system. The performance of the system is compared with the two area deregulated AGC system without HVDC link. To achieve the controller parameters, the Particle Swarm Optimization (PSO) [22-26] is used to solve the objective function. This paper is organized as follows, In section 2 we first briefly present the AGC model proposed in [16] and which overcomes the limitations of the earlier models proposed in [1-15]. Dynamic model of the Gas generating station is also includes as a part of the considered model. In the section 3 we present the dynamic model of HVDC transmission line used for the improvement of the system response. Particle Swarm Optimization algorithm used for the optimization of controller parameters is discussed in section 6. Simulation results are given in section 5, to highlight the difference between the performance of the Thermal-Hydro-Gas AGC systems with and without HVDC transmission line system inclusion.
II. CONVENTIONAL AGC SYSTEM
The conventional model, that‘s being used by several researchers [1-15] is essentially a simple extinction of traditional Elgerd model [1]. In this AGC model, the concept of disco participation matrix (DPM) is included to the conventional AGC model to incorporate the bilateral load contracts. The DPM gives the extent of consumption of a DISCO from a particulate GENCO. In a power system with m DISCOs and n GENCOs, the DPM is given as
11 12 13 14
21 22 23 24
31 32 33 34
41 42 43 44
cpf
cpf
cpf
cpf
cpf
cpf
cpf
cpf
DPM
cpf
cpf
cpf
cpf
cpf
cpf
cpf
cpf
ij
cpf
is the ―generation participation factor‖, which shows the participation factor of GENCO i in the load following ofDISCO j. The sum of all the entries in a column in this matrix is unity (
1
1
n
ij i
cpf
). Whenever a load demandedby a DISCO changes, it is reflected as a local load in the area to which this DISCO belongs.
These information signals which are not present in the conventional AGC. In [1] introduction of these signals are justified arguing that these signals give an indication regarding which generator has to follow to which DISCO.
As there are many GENCOs in each area, AGC signal has to be distributed among them according to their participation in the AGC. ―ACE (Area Control Error) participation factors (apf)‖ are the coefficient factors which distributes the ACE among GENCOs. If there are ‗m‘ number of GENCOs then 𝑚𝑖=1𝑎𝑝𝑓𝑖 = 1.In this model, the
scheduled value of steady state tie line power is given as
1 2, (demand of DISCOs in area II from GENCOs in area I)
(demand of DISCOs in area I from GENCOs in area II)
scheduled P
Then the tie line power error
P
1 2, error is expressed as1 2,error 1 2,actual 1 2,scheduled
P
P
P
1 2,error
P
is used to generate the respective ACE signals instead of ΔPtie in traditional power systems. ACE of ith area
will be given as
1 1 1 1 2tie error,
ACE
B F
P
2 2 2 2 1tie error,
The two area AGC system considered has two individual areas connected with a tie line. The deviation in each area frequency is determined by considering the dynamics of the governors, turbines, generators and loads represents in that area. The tie line deviation between the areas is computed as the product of the tie line constant and the frequency deviation difference between two areas. Figure 1 shows the AGC model of the two area system considered. Figure 2 shows dynamic models of the generators in the modeling of each area. The state space representation of AGC model is given by
(1) xAxBu p q
Where x is state vector, u is control vector and p is disturbance vector. A, B and Γ and β are the constant matrices associated with state, control, disturbance and bilateral contract vectors respectively. The tie line power in two area AGC is given as
12
12 1 2 (2) T
P f f
tie s
The scheduled power on the tie line in the direction from area I to area II is
2 4 4 2
1 2 ,
1 3 3 1
tie scheduled ij Lj ij Lj
i j i j
P
cpf
P
cpf
P
From the AGC model, frequency and tie line power error signals are used to generate the ACE signal in respective area [1]. This ACE of the area is written as
.
1 1 1 12
(3)
ACE B f P
tie error
.
2 2 2 21
(4)
ACE B f P
tie error
III. HVDC LINK DESIGN
HVDC link is used to transmit electric power for long distance. Effect of transmission line reactance and charging currents are absent in HVDC transmission system and this makes it possible to have stability without consideration of line length. HVDC is also preferred for underground and submarine cable transmission over long distance at high voltage. In case of AC cable the temperature rises due to charging current forms a limit for loading. That is beyond certain limit AC cable cannot be used due to thermal limit and the HVAC interconnection between the power systems produces many problems particularly in case of long distance transmission [3, 7-8]. By the use of HVAC lines, large oscillations are produced which make frequent tripping and increases fault current level. These problems reduce the overall system dynamic performance.
When the HVDC link is used in parallel with the HVAC line, the above problems are reduced and the dynamic performance of the system is also improved. The important features of HVDC transmission lines are fast controllability of line power and improvement of transient stability in HVAC lines. HVDC system has three basic parts such as AC to DC converter station, transmission line and DC to AC converter station. Converters used in both ends are much expensive and HVDC transmission system is economical for long distances and also converters produce a lot of harmonics which may cause interference with communication lines requiring filters which increase the cost. The
transfer function model of HVDC link is given by
1
dc dc
dc dc
P
K
U
sT
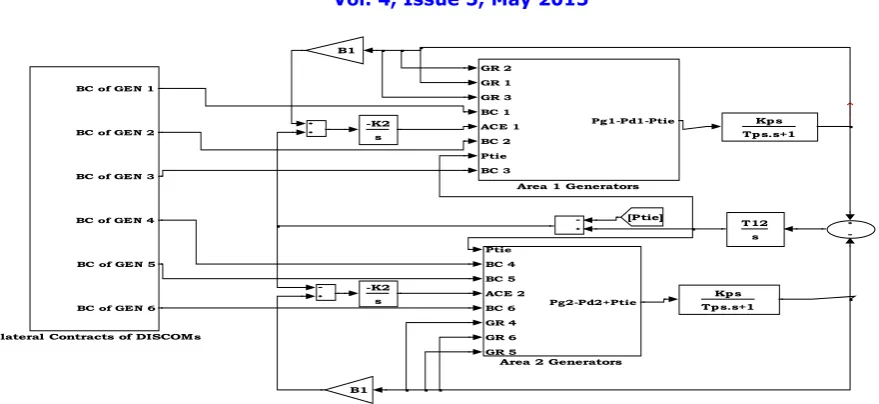
Fig 1 : Modified model of AGC in deregulated power systems with Thermal, Hydro and Gas generators
Fig 2. Sub system of the area 1 generator
IV. PARTICLE SWARM OPTIMIZATION
Particle swarm optimization is a population-based stochastic optimization algorithm which is first introduced by Kennedy and Eberhart in 1995 [9, 10]. It can be obtained high quality solutions within shorter calculation time and stable convergence characteristics by PSO than other stochastic methods such as genetic algorithm [11]. PSO uses particles which represent potential solutions of the problem. Each particles fly in search space at a certain velocity which can be adjusted in light of proceeding flight experiences. The projected position of ith particle of the swarm xi, and the velocity of this particle vi at (t+1)th iteration are defined and updated as the following two equations:
1
1 1 2 2
t t t t t t
i i i i i i
v
v
c r p
x
c r g
x
1 1
t t t
i i i
x
x
v
where, i = 1, ..., n and n is the size of the swarm, c1 and c2 are positive constants, r1 and r2 are random numbers which
are uniformly distributed in [0, 1], t determines the iteration number, pi represents the best previous position (the position giving the best fitness value) of the ith particle, and g represents the best particle among all the particles in the swarm. The flowchart of standard PSO algorithm is depicted in Fig.2. At the end of the iterations, the best position of the swarm will be the solution of the problem. It cannot always possible to get an optimum result of the problem, but
Kp s Tp s.s+1
-K2 s -K2
s
T12 s
Kp s Tp s.s+1 B1
B1
[Ptie]
BC of GEN 1
BC of GEN 2
BC of GEN 3
BC of GEN 4
BC of GEN 5
BC of GEN 6
Bilateral Contracts of DISCOMs
Ptie BC 4 BC 5 ACE 2 BC 6 GR 4 GR 6 GR 5
Pg2-Pd2+Ptie
Area 2 Generators
GR 2 GR 1 GR 3 BC 1 ACE 1 BC 2 Ptie BC 3
Pg1-Pd1-Ptie
Area 1 Generators
Load in Area 1
Thermal Plant
Hydero Plant
Gas Plant
1 Pg1-Pd1-Ptie
-Tcrs+1 Tf.s+1 a
b.s+c X.s+1
Y.s+1
-Tws+1 0.5*Tws+1 1
Tgh.s+1 TR.s+1
Trh.s+1
1 Tr.s+1
1 Tcd.s+1 Kr*Tr.s+1
Tt.s+1 1
Tg.s+1
apf3 apf2 apf1
-1/Rg -1/Rhy
-1/Rth
0.2
8 BC 3
7 Ptie 6
BC 2 5
ACE 1
4 BC 1
3 GR 3
2 GR 1
the obtained solution will be an optimal one. Because of the standard PSO algorithm can fall into premature convergence especially for complex problems with many local optima and optimization parameters, the craziness based PSO algorithm which is particularly effective in finding out the global optimum in very complex search spaces is developed [12]. The main difference between PSO and crazy-PSO is the propagation mechanism to determine new velocity for a particle as follows:
1
2 3
1
3 1 11
2 21
1t t t t t t
i i i i i
v
r sign r v
r c r p
x
r c
r g
x
1 1
4 4
t t t
i i i cr
x
x
v
P r sign r V
Where pi is the local best position of particle i, and gi is the global best position of the whole swarm. r1, r2, r3 and r4 are
random parameters distributed uniformly in [0, 1], and c1, c2 are I-named step constants and are taken 2.05 generally.
The sign is a function defined as follows for r3 and r4,
3 33
1
0.05
1
0.05
r
sign r
r
4 44
1
0.05
1
0.05
r
sign r
r
In birds flocking or fish schooling, since a bird or a fish often changes directions suddenly, in the position updating formula, a craziness factor, Vcr, is used to describing this behaviour. In this study, it is decreased linearly from 10 to 1. P (r4) is defined as
4 44
1
0
cr cr
r
P
P r
r
P
Where Pcr is a predefined probability of craziness and is introduced to maintain the diversity of the particles. It is taken 0.3 in this study. The crazy-PSO algorithm can prevent the swarm from being trapped in local minimum, which would cause a premature convergence and lead to fail in finding the global optimum [12, 13].
The two area system in the deregulated case with identical areas can be optimized with respect to system parameters to obtain the best response. The parameter involved in the feedback is the integral controller (KI). The optimal value of KI
depends upon the cost function used for optimization. The integral of squared error criterion (ISE) is used in this case; The objective of this controller is achieved by minimizing a performance index (J). Where J is given as
2 2 2
1 2 tie12 error
J
f f P dtV.SIMULATION RESULTS
Case 1:
Two area AGC model is used to illustrate the performance of the present model. To study this model, consider a case where all the DISCOs contract with the GENCOs for power as per the bellow DPM:
0.1 0 0.2 0
0.2 0.1 0.1 0.5 0.3 0.2 0.3 0.1 DPM=
0.2 0.1 0 0.2 0.2 0.2 0.3 0.2
0 0.4 0.1 0
1 2 3 4
5 6
0.03; 0.09; 0.09; 0.05;
0.09; 0.05
m m m m
m m
P P P P
P P
The total local load in area 1
1 2
L1,LOC
ΔP =Load of DISCO + Load of DISCO =0.2 pu MW (no un contracted load)
Similarly, the total local load in area 2
L2,LOC 3 4
ΔP
=Load of DISCO +Load of DISCO
=0.2 pu MW (no un contracted load)Tie line power can be calculated by using the formula given in the above section and is given by 0.01pu as shown in the results.
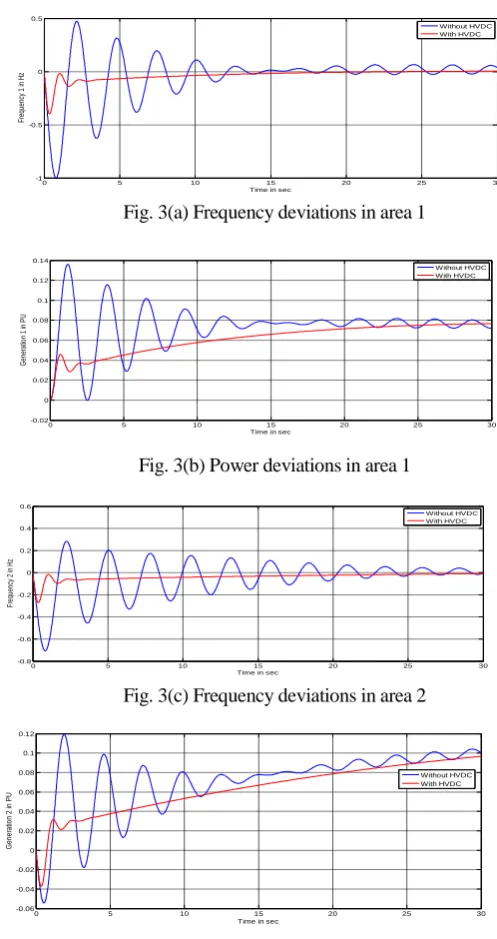
The response of the system is shown in figure 3.
Fig. 3(a) Frequency deviations in area 1
Fig. 3(b) Power deviations in area 1
Fig. 3(c) Frequency deviations in area 2
Fig. 3(d) Power deviations in area 2
0 5 10 15 20 25 30
-1 -0.5 0 0.5
Time in sec
F
re
qu
en
cy
1
in
H
z
Without HVDC With HVDC
0 5 10 15 20 25 30
-0.8 -0.6 -0.4 -0.2 0 0.2 0.4 0.6
Time in sec
Fr
eq
ue
nc
y
2
in
H
z
Without HVDC With HVDC
0 5 10 15 20 25 30
-0.02 0 0.02 0.04 0.06 0.08 0.1 0.12 0.14
Time in sec
G
en
er
at
io
n
1
in
P
U
Without HVDC With HVDC
0 5 10 15 20 25 30
-0.06 -0.04 -0.02 0 0.02 0.04 0.06 0.08 0.1 0.12
Time in sec
G
e
n
e
ra
tio
n
2
in
P
U
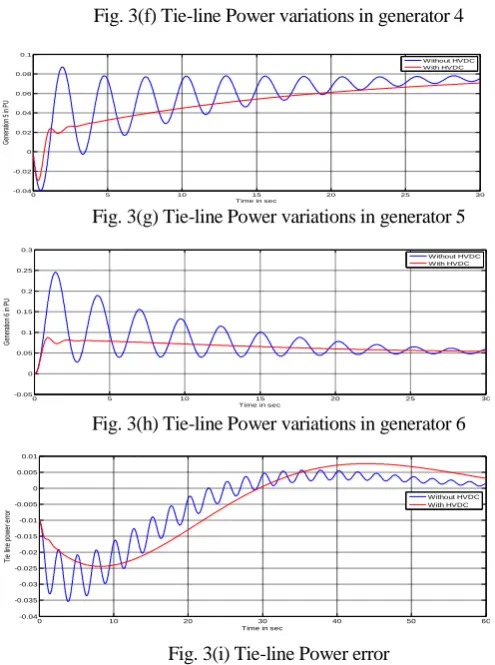
Fig. 3(e) Tie-line Power variations in generator 3
Fig. 3(f) Tie-line Power variations in generator 4
Fig. 3(g) Tie-line Power variations in generator 5
Fig. 3(h) Tie-line Power variations in generator 6
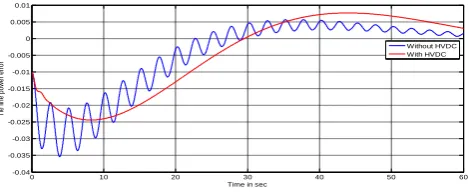
Fig. 3(i) Tie-line Power error
Results in the figure 3 shows that, to meet the DISCOs demand each generator is generating power according to their participation matrix mentioned in the DISCO participation matrix. Due to power balance between the generated power by the GENCOs and load demand by the DISCOs, the frequency in each area is settled to its rated value (frequency deviation in the response is settled to zero). The tie line power is also observed to be at its calculated value is also observed to be at its calculated value from the simulation results. This testifies that the designed controller is succeeded in controlling the generation and frequencies of the system to maintain the system balance. Variation in frequency,
0 5 10 15 20 25 30 -0.04
-0.02 0 0.02 0.04 0.06 0.08 0.1
Time in sec
G
en
er
at
io
n
5
in
P
U
Without HVDC With HVDC
0 5 10 15 20 25 30
-0.05 0 0.05 0.1 0.15 0.2 0.25 0.3 0.35 0.4
Time in sec
G
en
er
at
io
n
3
in
P
U
Without HVDC With HVDC
0 5 10 15 20 25 30
-0.05 0 0.05 0.1 0.15 0.2 0.25 0.3
Time in sec
G
en
er
at
io
n
6
in
P
U
Without HVDC With HVDC
0 5 10 15 20 25 30 0
0.02 0.04 0.06 0.08 0.1 0.12
Time in sec
G
en
er
at
io
n
4
in
P
U
Without HVDC With HVDC
0 10 20 30 40 50 60
-0.04 -0.035 -0.03 -0.025 -0.02 -0.015 -0.01 -0.005 0 0.005 0.01
Time in sec
T
ie
li
ne
p
ow
er
e
rr
or
generators generation and tie line power shows that HVDC transmission line connecting both areas is improving the dynamic performance of the system.
Case 2: Contract Violation
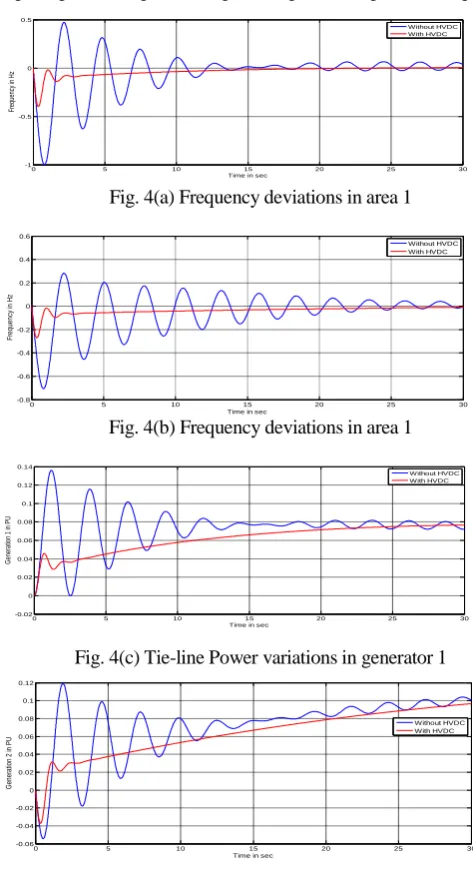
It may happen that a DISCO violates a contract by demanding more power than that specified in the contract. This excess power is not contracted out to any GENCO. This un contracted power must be supplied by the GENCOs in the same area as the DISCO. It must be reflected as a local load of the area but not as the contract demand. Consider that DISCOs in area 1 are violating contracts and demanding an excess power as shown in figure 4. The response of the system is shown in figure 4 with this contract violation for the disturbance shown in the figure 3 and for the DPM as follows:Each GENCO participated in AGC as defined by following apfs: apf1=0.2, apf2=0.5, apf3=3, apf4=0.3, apf5=0.45, apf6=0.25.
Fig. 4(a) Frequency deviations in area 1
Fig. 4(b) Frequency deviations in area 1
Fig. 4(c) Tie-line Power variations in generator 1
Fig. 4(d) Tie-line Power variations in generator 2
0 5 10 15 20 25 30
-1 -0.5 0 0.5
Time in sec
Fr
eq
ue
nc
y
in
H
z
Without HVDC With HVDC
0 5 10 15 20 25 30
-0.8 -0.6 -0.4 -0.2 0 0.2 0.4 0.6
Time in sec
F
re
qu
en
cy
in
H
z
Without HVDC With HVDC
0 5 10 15 20 25 30
-0.02 0 0.02 0.04 0.06 0.08 0.1 0.12 0.14
Time in sec
G
en
er
at
io
n
1
in
P
U
Without HVDC With HVDC
0 5 10 15 20 25 30
-0.06 -0.04 -0.02 0 0.02 0.04 0.06 0.08 0.1 0.12
Time in sec
G
en
er
at
io
n
2
in
P
U
Fig. 4(e) Tie-line Power variations in generator 3
Fig. 4(f) Tie-line Power variations in generator 4
Fig. 4(g) Tie-line Power variations in generator 5
Fig. 4(h) Tie-line Power variations in generator 6
Fig. 4(i) Tie-line Power error
0 10 20 30 40 50 60
-0.04 -0.035 -0.03 -0.025 -0.02 -0.015 -0.01 -0.005 0 0.005 0.01
Time in sec
T
ie
li
n
e
p
o
w
e
r
e
rr
o
r
Without HVDC With HVDC
0 5 10 15 20 25 30
-0.05 0 0.05 0.1 0.15 0.2 0.25 0.3 0.35 0.4
Time in sec
G
en
er
at
io
n
3
in
P
U
Without HVDC With HVDC
0 5 10 15 20 25 30
0 0.02 0.04 0.06 0.08 0.1 0.12
Time in sec
G
en
er
at
io
n
4
in
P
U
Without HVDC With HVDC
0 5 10 15 20 25 30
-0.04 -0.02 0 0.02 0.04 0.06 0.08 0.1
Time in sec
G
en
er
at
io
n
5
in
P
U
Without HVDC With HVDC
0 5 10 15 20 25 30
-0.05 0 0.05 0.1 0.15 0.2 0.25 0.3
Time in sec
G
e
n
e
ra
tio
n
6
in
P
U
The simulation results in figure 4 shows that the disturbance in area 1 causes frequency variation in area 1 to be more than the same area 2. From the response of the generators it is clear that, as a primary action generators in both the areas are responding at the beginning for the disturbance in area 1. But when the secondary control comes in to action, generators in area 1 are only responding for the disturbance in the corresponding area and remaining generators are ineffective in steady state. The tie line power is also unchanged in the steady state because there is no contribution of area 2 generators for the disturbance in area1. Variation in frequency, generators generation and tie line power shows that HVDC transmission line connecting both areas is improving the dynamic performance of the system.
VI.CONCLUSION
Simulation model for automatic generation control in deregulated power systems is presented which includes three types of generating systems (Thermal-Hydro-Gas). Frequency variation due to bilateral contracts has been studied with the help of DISCO participation matrix. Dynamic model of HVDC transmission link systems used in the analysis is presented in the paper. Dynamic model to study the effect of a HVDC transmission link in AGC of Deregulated power system is proposed. Controller parameters are also selected using PSO algorithm in multi area AGC system with HVDC transmission link.
Further to improve the system performance, particularly using HVDC transmission link robust frequency controllers are successfully implemented in two area power systems. Finally comparative studies have been made between AGC system with and without CES. Simulation results show that HVDC transmission link is successful in damping the frequency variations during the load disturbances.
REFERENCES
[1] R. Christie and A.bose, Load-freqency control issues in power system operations after deregulation, IEEE transactions power systems, Vol.11, pp.1191-1200,Aug. 1996.
[2] Christie RD,Bose A, Load frequency control issues in power system opera-tions after deregulation, IEEE Transactionson Power Systems
1996;11 (3):1191–200.
[3] KumarJ,NgKah Hoe, Sheble G. ―AGC Simulator for price based operation part 1: a model‖, IEEE Transactions on Power Systems 1997;12(2):527–32.
[4] Kumar Jayant, NgKah Hoe, Sheble Gerald, ― AGC simulator for price-based operation part- I: case study results‖, IEEE Transactions on Power Systems 1997;12(2):533–8.
[5] Bakken BH, Grand OS. Automatic generation control in a deregulated power system. IEEE Transactions on Power Systems1998;13(4):1401. [6] Donde V, Pai M A, Hiskens IA. Simulation and optimization in an AGC system after deregulation. IEEE Transactions on Power
Systems2001;16(3):481–9.
[7] Delfino B,FornariF,MassuccoS.Load-frequency control and in advertent interchange evaluation in restructured power systems. IEE Proceedings- Generation, Transmission and Distribution 2002; 149(5):607–14.
[8] Shayeghi Hossein, Shayanfar HeidarAli. Design of decentralized robust LFC in a competitive electricity environment. Journal of Electrical Engineering 2005;56(9-10):225–36.
[9] Shayeghi Hossein, Shayanfar Heidar Ali, Jalili Aref. Multistage fuzzy PID load frequency controller in a restructured power system. Journal of Electrical Engineering 2007;58(2):61–70.
[10] Shayeghi H. A robust decentralized power system load frequency control. Journal of Electrical Engineering 2008; 59(6):281–93.
[11] [Hosseini, Etemadi.Adaptiveneuro fuzzy inference system based automatic generation control. Electric Power Systems Research 2008; 78:1230–9.
[12] Abraham RJ, Das D, Patra A. Load following in a bilateral market with local controllers. Electrical Power and Energy Systems 2011; 33:1648–57.
[13] Debbarma S,SaikiaLC,SinhaN.AGCofamulti-area thermal system under deregulated environment using non-integer controller. Electrical Power Systems Research 2013;95:175–83.
[14] Bhatt P, RoyR, GhoshalSP. Optimized multi area AGC simulation in restructured power systems. Electrical Power and Energy Systems2010;32: 311–22.
[15] Tan Wen, Zhang H, Yu M. Decentralized load frequency control in deregulated environments. Electrical Power and Energy Systems 2012;41:16–26.
[16] K Hari Krishna, Dr.K. Chandra Sekhar, ―Modelling and Analysis of AGC in Multi Source Deregulated Power Systems‖, Proc. Of International Journal of Electrical Engineering and Technology Volume 5, Issue 7, July (2014), pp. 56-66.
[17] Aggarwal R P, Bergseth F R. Large signal dynamics of load-frequency control systems and their optimization using non linear programming: II. IEEE Transactionson Power Apparatus and Systems 1968;87(2):532–8 PAS-vol..
[18] Yoshida Y, MachidaT. Study of the effect of the DC link on frequency control in inters connected AC systems. IEEE Transactions on Power Apparatus and Systems 1969; 88(7): 1036–42 PAS-vol.
[20] Ibraheem P, Kumar, Ahmad S. Dynamic performance enhancement of hydro power systems with asynchronous tie-lines. IE(I) Journal—EL 2004;85.
[21] braheem, Kumar P K. Study of dynamic performance of power systems with asynchronous tie lines considering parameter un certainties. IE(I) Journal— EL 2004;85:35–42.
[22] Juang CF, Lu CF. Load frequency control by hybrid evolutionary fuzzy PI controller. IEE Proceedings Generation, Transmission and Distribution 2006;153(2):196–204.
[23] Hosseini, Etemadi. Adaptive neuro fuzzy inference system based automatic generation control. Electric Power Systems Research 2008; 78:1230–9.
[24] Sharifi A, etal.. Load frequency control in inter connected power system using multi objective PID controller 2008. In: IEEE conference on softcomputing in industrial applications, Muroran, Japan; June2008.p.25–27.
[25] Sabahi K, etal. Load frequency control in inter connected power system using multi objective PID controller. Journal of Applied Sciences 2008;8 (20):3676–82.
[26] Bhatt P, Roy R, Ghoshal S P. Optimized multi area AGC simulation in restructured power systems. Electrical Power and Energy Systems2010;32: 311–22.
BIOGRAPHY
K. Hari Krishna received B.Tech & M.Tech, degrees in Electrical &Electronics Engg. From Jawaharlal Nehru Technological University & Acharya Nagajuna University in 2003 & 2006 respectively. He is having 10 years of teaching experience and pursuing Ph.D. in A.N.U.. Currently he is an Associate Professor in the Department of E.E.E., KALLAM HARANADHA REDDY Institute of Technology, Guntur. His teaching and research interest include power system operation and stability.