Visualizing Input-Output Data: Some
New Techniques Applied to the Amazon
Region1
Guilhoto, Joaquim José Martins and Sesso Filho, Umberto
Antonio
University of São Paulo, State University of Londrina
2005
Joaquim José Martins Guilhoto
University of São Paulo, São Paulo, Brazil
Regional Economics Applications Laboratory (REAL) at The University of Illinois at Urbana-Champaign, USA
CNPq Scholar
e-mail: [email protected]
Umberto Antonio Sesso Filho
State University of Londrina, Paraná, Brasil
e-mail:[email protected]
ABSTRACT
Since the initial input-output models conceived by Leontief in the 1930’s, the
input-output theory has gone through a lot of development at the theoretical as well as
applied point of view. However, despite all the progress, there is still one point that
needs further consideration into the analysis, i.e., how to visualize, and to analyze, in an
easy way the vast amount of data and information contained into input-output systems.
In this paper two different ways to look at input-output data are presented, i.e.,
landscapes and electroeconograms. The examples are conducted using as the main
source of data an interregional input-output system consisted of 10 regions (nine
Amazon states and the Rest of Brazil region) constructed for the year of 1999 by
Guilhoto et al. (2002) for the Amazon Bank (BASA).
JEL Classification: R15, C67
Key Words: Productive Structure, Input-Output, Amazon Region.
1
The first author would like to thank FAPESP (Fundação de Amparo à Pesquisa do Estado de São Paulo) for the financial support that made possible to attend and to present a previous version of this paper at the 43rd Congress of the European Regional Science Association in Jyväskylä, Finland.
Visualizando la Matriz de Insumo Producto:
Algunas Nuevas Técnicas Aplicadas para la Región Amazónica
Joaquim José Martins Guilhoto
Universidade de São Paulo, São Paulo, Brasil
Regional Economics Applications Laboratory (REAL) at The University of Illinois at Urbana-Champaign, USA
Pesquisador de CNPq
e-mail: [email protected]
Umberto Antonio Sesso Filho
Universidade Estadual de Londrina, Paraná, Brasil
e-mail:[email protected]
RESUMEN
Desde los modelos de insumo producto concebidos por Leontief en la década de
1930, la teoría de insumo producto y su práctica han pasado por muchos cambios y
avances. Sin embargo, a pesar de todo este adelanto hay un punto que necesita mejor
análisis y atención, es decir, cómo visualizar y cómo analizar de una manera fácil, la
gran cantidad de números y informaciones contenidas en un sistema de insumo
producto. En este trabajo son presentados dos modos de interpretación para las
informaciones encerradas en el sistema de insumo producto, o sea, topografía
económica y electroeconogramas. Los ejemplos realizados están basados en
informaciones procedentes de un sistema interregional de insumo producto construido
para 10 regiones (nueve Estados de Amazonia y el Resto de Brasil) por Guilhoto et al.
(2002), para el Banco de Amazonia (BASA), para el año de 1999.
Clasificación JEL: R15, C67
1. INTRODUCTION
In assessing the economic impact of a sector or group of sectors on a single or
multiregional economy, input-output analysis has proven to be a popular method.
However, there has a problem in displaying all the information that can be obtained
from this analytical approach. In this paper, we have tried to set new directions in the
use of input-output analysis by presenting an improved way of looking at it, by using
electroeconograms and landscapes. Essentially, it will now be possible to visualize, in a
simple picture, all the relations in the economy as well as being able to view how one
sector is related to the other sectors/regions in the economy. These relations can be
measured in terms of structural changes, production, value added, employment, imports,
etc. While all the possibilities cannot be explored in this paper, the basic idea is given
here and the smart reader can uncover all the various possibilities.
To illustrate the power of analysis provided by the electroeconograms and the
economic landscapes, an application is made to an interregional input-output system
consisted of 10 regions (nine Amazon states and the Rest of Brazil region) constructed
for the year of 1999 by Guilhoto et al. (2002) for the Amazon Bank (BASA).
In the next section it is presented the methodology used in the analysis, the third
section will present a brief overview of the Amazon region. The results are presented in
the fourth section and the final comments in the last section.
2. THEORETICAL BACKGROUND
The intersectoral flows in a given economy can be represented by the following
system
X = AX +Y (1)
where X is a (nx1) vector with the value of the total production in each sector, Y is a
(nx1) vector with values for the final demand, and A is a (nxn) matrix with the technical
coefficients of production (Leontief, 1951). In this model, the final demand vector can
be treated as exogenous to the system, such that the level of total production can be
determined by the final demand, i.e.,
X =BY (2)
where B is a (nxn) matrix of the Leontief inverse.
2.1.Multipliers
From the multipliers results it is possible to measure the direct and indirect effects
of a change in the final demand over production, income, employment, etc. (see Miller and
Blair, 1985).
From the Leontief inverse matrix (B) defined above one has that the production
multiplier of type I for each economic sector is given by:
(4) P b j j i i n = = =
∑
1 1,...,n jwhere Pj is the production multiplier for sector j and bij is an element of matrix B.
2.2. The Rasmussen/Hirschman Approach
The work of Rasmussen (1956) and Hirschman (1958) led to the development
of indices of linkage that have now become part of the generally accepted procedures
for identifying key sectors in the economy. Define as a typical element of the
Leontief inverse matrix,
ij b
B
;B
* as the average value of all elements ofB
, and if B•jand Bi• are the associated typical column and row sums, then the indices may be
developed as follows:
Backward linkage index (power of dispersion):
.
/
/
*
U
j=
B
•jn B
(5)
Forward linkage index (sensitivity of dispersion):
.
/
/
*
U
i=
B
i•n B
(6)
One of the criticisms of the above indices is that they do not take into
consideration the different levels of production in each sector of the economy, what it is
2.3. The Pure Linkage Approach
As presented by Guilhoto, Sonis and Hewings (1996) the pure linkage approach
can be used to measure the importance of the sectors in terms of production generation
in the economy.
Consider a two-region input-output system represented by the following block
matrix, A, of direct inputs:
A A A
A A
jj jr
rj rr
=
F
H
G
I
K
J
(7)
where and are the quadrate matrices of direct inputs within the first and second
region and and are the rectangular matrices showing the direct inputs purchased
by the second region and vice versa.
Ajj Arr
Ajr Arj
From (7), one can generate the following expression:
B
I
A
B BB B I A A I jj jr rj rr jj rr j r jr r rj j
= −
−=
F
=
H
G
I
K
J F
H
G
I
K
JF
H
G
I
K
JF
H
G
I
K
J
(
)
1 00 0 0 Δ Δ Δ Δ Δ Δ (8) where:
Δ
j=
c
I
−
A
jjh
−1(9)
Δ
r= −
a
I
A
rrf
−1 (10)Δ
jj= −
c
I
Δ
jA
jrΔ
rA
rjh
−1(11)
Δ
rr= −
c
I
Δ
rA
rjΔ
jA
jrh
−1(12)
By utilizing this decomposition (equation 8), it is possible to reveal the process
of production in an economy as well as derive a set of multipliers/linkages.
From the Leontief formulation:
X
= −
a f
I
A
−1Y
and using the information contained in equations (8) through (12), one can derive a set
of indexes that can be used: a) to rank the regions in terms of its importance in the
economy; b) to see how the production process occurs in the economy.
From equations (8) and (13) one obtains:
X X I A A I Y Y j r jj rr j r jr r rj j j r
F
H
GIK
J F
=
H
G
ΔJF
K
I
H
G
I
K
JF
H
G
I
K
JF
H
GIK
J
Δ Δ Δ Δ Δ 0 0 0 0 (14)
which leads to the definitions for the Pure Backward Linkage (PBL) and for the Pure
Forward Linkage (PFL), i.e.,
PBL A Y
PFL A Y
r rj j j
j jr r r
= =
Δ Δ
Δ Δ
(15)
where the PBL will give the pure impact on the rest of the economy of the value of the
total production in region j,
d i
ΔjYj : i.e., the impact that is free from a) the demandinputs that region j makes from region j , and b) the feedbacks from the rest of the
economy to region j and vice-versa. The PFL will give the pure impact on region j of
the total production in the rest of the economy
b g
Δr rY .As the PBL and PFL are show in current values, the pure total linkage (PTL) can
be obtained by adding the two previous indices, i.e.,
PTL= PBL+PFL (16)
The pure linkage indices can also be normalized by the average value of the
sectors in the economy such that the normalized indices show how many times a sector
is bigger or smaller than the average sector in the economy. In such a way it is possible
to use these indices to a direct comparison of the productive structure of economies with
different sizes and currencies. In the same way they do allow for a time comparison in
economies with inflation or that have changed their currency.
3. A BRIEF OVERVIEW OF THE AMAZON REGION
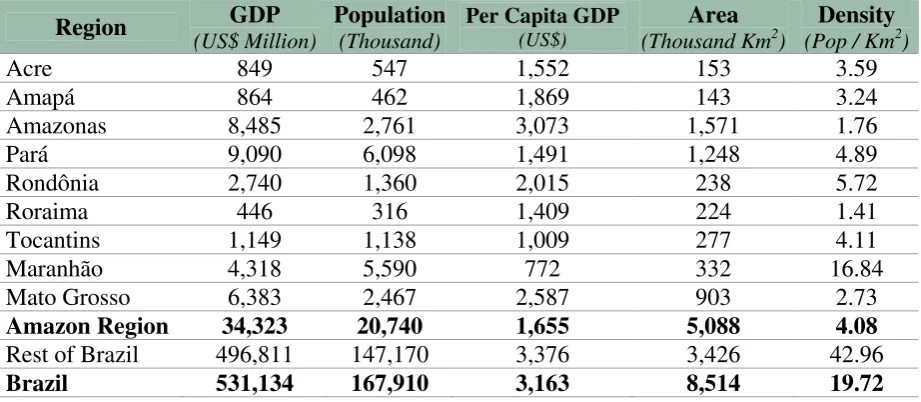
The main indicators of the Amazon region are presented in Table 1. The
Amazon region consists of nine (Acre, Amapá, Amazonas, Pará, Rondônia, Roraima,
Tocantins, Maranhão, and Mato Grosso) out of the 27 Brazilian States (Brazil is a
characterized by having a great share of the Brazilian territory, however, with a small
population, and a low density of population per Km2. The Amazon region has a share of 6.5% of the Brazilian GDP, and the values for the per capita income are below the
national average.
Following Guilhoto et al (2002) the service sector is the most important one for
the Amazon region, with a share of 61.2% of its GDP, against a share of 59.7% for
Brazil as a whole. For the agricultural and industrial sectors the shares are respectively,
16.0% and 22.8% for the Amazon Region, and 8.0% and 32.3% for the Brazilian
[image:8.595.68.529.299.500.2]Economy.
Table 1. Main Indicators of the Amazon Region for 1999
Region GDP
(US$ Million)
Population
(Thousand)
Per Capita GDP
(US$)
Area
(Thousand Km2)
Density
(Pop / Km2)
Acre 849 547 1,552 153 3.59
Amapá 864 462 1,869 143 3.24
Amazonas 8,485 2,761 3,073 1,571 1.76
Pará 9,090 6,098 1,491 1,248 4.89
Rondônia 2,740 1,360 2,015 238 5.72
Roraima 446 316 1,409 224 1.41
Tocantins 1,149 1,138 1,009 277 4.11
Maranhão 4,318 5,590 772 332 16.84
Mato Grosso 6,383 2,467 2,587 903 2.73
Amazon Region 34,323 20,740 1,655 5,088 4.08
Rest of Brazil 496,811 147,170 3,376 3,426 42.96
Brazil 531,134 167,910 3,163 8,514 19.72
Source: IBGE (2002a), IBGE (2002b)
4. THE PRODUCTIVE STRUCTURE OF THE AMAZON REGION
Using the visual techniques of landscapes and electroeconograms, this section
presents the main results obtained by applying the above methodology in the
interregional input-output model constructed by Guilhoto et al (2002) for 91 industries
(sectors) and 141 commodities for 10 regions (Acre, Amapá, Amazonas, Pará,
Rondônia, Roraima, Tocantins, Maranhão, Mato Grosso, and Rest of Brasil) for the year
First it is presented and analysis of how the flow of goods and services take
place among the region, then it is made a comparative study of the productive structure
of the states of the Amazon region.
4.1. Flow of Goods and Services
Table 2 shows how the shares of total imports (intermediate and final
consumption) made by one region are distributed among the source regions. It is
possible to see the great dependence on the imports from the Rest of Brazil region, over
85%, showing a small level of trade among the states of the Amazon region. This can be
explained, in part, by the low level of industrialization found in the region as well as by
transportation problems. The Rest of Brazil region buys products mainly from the states
of Amazonas, Mato Grosso and Pará. The electronic goods produced in the Free Zone
of Manaus can explain the great share of the Amazonas state, given that the industries
producing in the Free Zone of Manaus can import the electronic components, used in
production, free of duties.
The low flow and dependence among the Amazon region is confirmed by
looking at Figures 1 to 3 that show the landscapes of the Leontief inverse for the
interregional system, first considering the whole system (Figure 1), them removing the
columns and rows corresponding to the Rest of Brazil region (Figure 2), and finally
removing the values for the main diagonal matrices, which correspond to the
intraregional flows (Figure 3).
The states that have the most of the few links within the Amazon region are the
ones of Amazonas and Mato Grosso, and to a less extent the states of Pará, Rondônia,
Table 2. Share (%) of Interregional Imports in the Total Imports of a Given Region.
Region AC AP AM PA RO RR TO MA MT RBR
Acre (AC) 0.07 0.07 0.03 0.20 0.06 0.04 0.05 0.05 0.74 Amapá (AP) 0.04 0.04 0.08 0.02 0.05 0.04 0.05 0.01 0.65 Amazonas (AM) 4.30 3.05 4.08 6.97 9.29 1.45 2.07 3.22 49.55 Pará (PA) 0.47 0.98 1.76 0.43 0.55 2.02 3.78 0.34 13.04 Rondônia (RO) 3.61 0.24 3.20 0.13 0.81 0.15 0.17 0.71 3.83 Roraima (RR) 0.02 0.02 0.08 0.01 0.01 0.01 0.02 0.02 0.53 Tocantins (TO) 0.07 0.08 0.08 1.11 0.03 0.07 1.39 0.06 2.09 Maranhão (MA) 0.46 0.48 0.42 2.15 0.15 0.40 4.29 0.10 6.57 Mato Grosso (MT) 3.14 0.69 3.60 0.86 6.80 0.85 1.24 0.54 22.99 Rest of Brazil (RBR) 87.89 94.38 90.75 91.54 85.39 87.92 90.75 91.95 95.49
Total 100.00 100.00 100.00 100.00 100.00 100.00 100.00 100.00 100.00 100.00
Source: Research Data
Figure 1: Landscape of the Leontief Inverse for the Interregional System
Row and Column Order: AC, AP, AM, PA, RO, RR, TO, MA, MT, RBR
[image:10.595.85.491.334.638.2]Figure 2: Landscape of the Leontief Inverse for the Interregional System, Without the Columns and Rows for the Rest of Brasil Region.
Row and Column Order: AC, AP, AM, PA, RO, RR, TO, MA, MT
Figure 3: Landscape of the Leontief Inverse, Without: a) the Columns and Rows for the Rest of Brazil Region; and b) the Values for the Intraregional Flows.
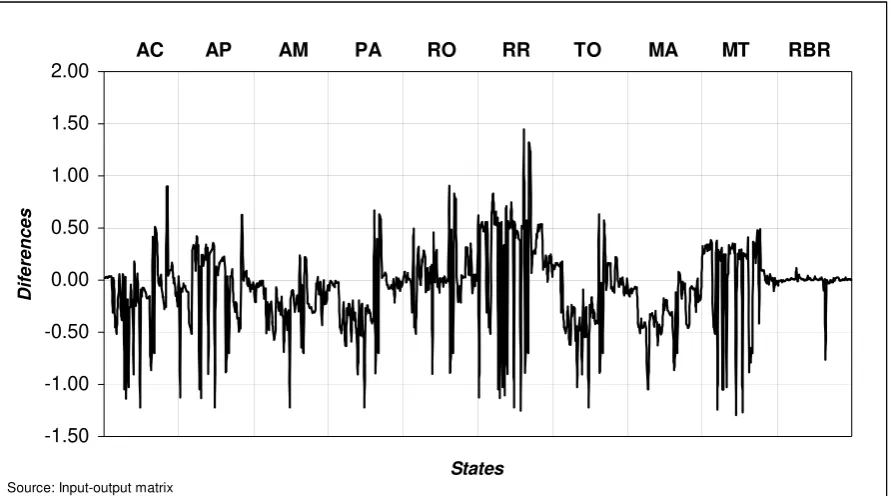
[image:11.595.87.483.476.772.2]4.2. Differences in the Productive Structure, The Electroeconograms
Figures 4 to 9 show the Electroeconograms of the productive structure of the
Amazon region. The concept of Electroeconogram is similar to the one for the
electrocardiogram or the electroencephalogram in medicine that are used to measure the
differences from a given standard. In that sense, using the Brazilian economy as a
“numeraire” it is possible to examine how the results from a given region differ from
the ones for the Brazilian economy. Then, one has that the higher the amplitude of the
waves in the figures, the greater the difference in the productive structures.
In general one can observe that the Rest of Brazil region has values near zero,
showing a greater similarity of this region with the country considered as a whole. This
result was already expected given that the Rest o Brazil region has a share of around
93.5% of the Brazilian GDP.
The Amazon region shows states that differ in their productive structure, but it
can also be observed similarities among the productive structure of the following states:
Acre and Amapá; Amazonas and Pará; Rondônia, Roraima and Tocantins. The sates of
Maranhão and Mato Grosso have, visually, productive structures relatively different
Figure 4. Electroeconogram of Production Multipliers, Type I, for the Amazon Region Interregional System.
-1.50 -1.00 -0.50 0.00 0.50 1.00 1.50 2.00
States
Diferences
AC AP AM PA RO RR TO MA MT RBR
Figure 5. Electroeconogram of the Hirschman-Rasmussen Backward Linkages for the Amazon Region Interregional System.
Figure 6. Electroeconogram of the Hirschman-Rasmussen Forward Linkages for the
-0.80 -0.60 -0.40 -0.20 0.00 0.20 0.40 0.60 0.80 1.00
States
Diferences
AC AP AM PA RO RR TO MA MT RBR
Source: Input-output matrix
Amazon Region Interregional System.
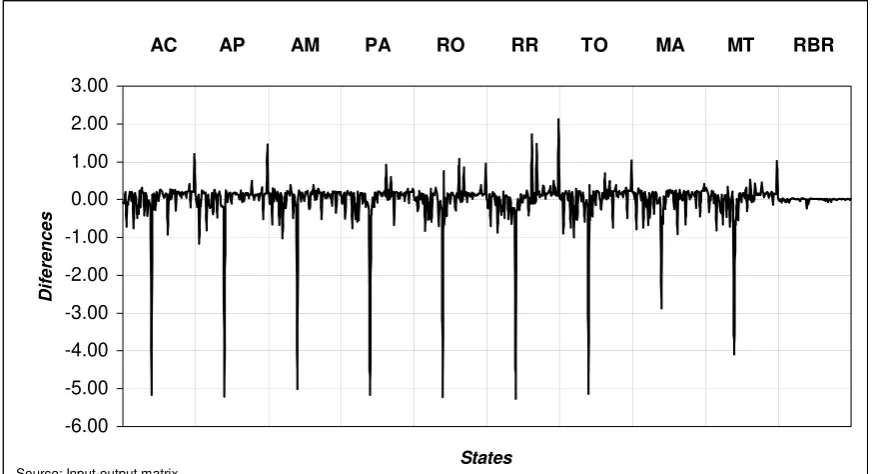
-6.00 -5.00 -4.00 -3.00 -2.00 -1.00 0.00 1.00 2.00 3.00
States
Diferences
AC AP AM PA RO RR TO MA MT RBR
[image:14.595.88.525.467.704.2]Figure 7. Electroeconogram of the Pure Normalized Backward Linkages for the Amazon Region Interregional System.
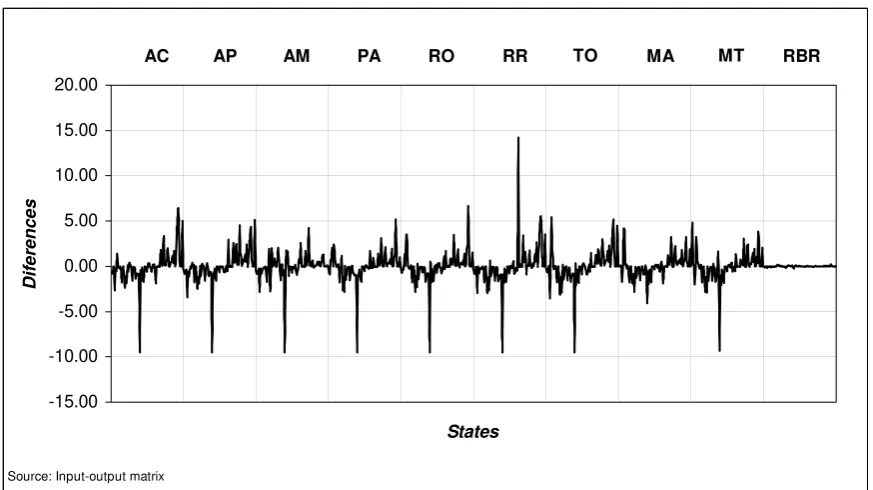
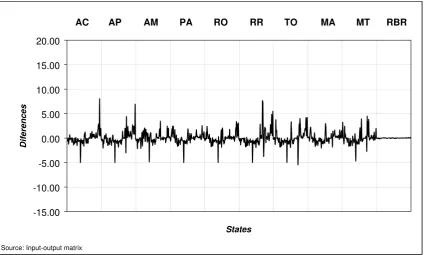
Figure 8. Electroeconogram of the Pure Normalized Forward Linkages for the Amazon
-15 -10 -5 0 5 10 15 20
States
Diferences
AC AP AM PA RO RR TO MA MT RBR
Source: Input-output matrix
Region Interregional System.
-15.00 -10.00 -5.00 0.00 5.00 10.00 15.00 20.00
States
Diferences
Source: Input-output matrix
[image:15.595.88.525.484.729.2]Figure 9. Electroeconogram of the Pure Normalized Total Linkages for the Amazon Region Interregional System.
6. FINAL COMMENTS
whole.
As a final remark, it must be stressed that the use of electroeconograms and
economic landscapes in the analysis do not replace previous methods of analysis used
-15.00 -10.00 -5.00 0.00 5.00 10.00 15.00 20.00
States
Diferences
Source: Input-output matrix
AC AP AM PA RO RR TO MA MT RBR
This paper presented new concepts of analysis through the use of
electroeconograms and economic landscapes. These concepts can be used to better
understand, in a visual way, how the structural changes take place in the economy as a
whole, and how the transactions vary in magnitude and direction among the regions.
The use of electroeconograms and economic landscapes is illustrated in this
paper through an application to the Brazilian Amazon region.
This study has show that the states of the Amazon region show a dependence on
the Rest of Brazil region, given that the flow of goods and services between the region
states and the Rest of Brazil are more intense than the flow among the region states.
There is a relative heterogeneity in the productive structure of the states of the
Amazon region, however, a closer look of the data can show that some economic
with input-output systems; it only uncovers a new and better way of showing
information contained in an input-output table that otherwise would be difficult to
udience of non input-output specialists.
para
liers in a pproaches.”. Discussion Pap
e
IBGE (
Oxford University Press.
Miller, Eng
analyze and to show to a broader a
REFERENCES
Guilhoto, J.J.M. et al (2002). “Projeto de Estimação de Matrizes de Insumo-Produto a Região e os Estados da Amazônia Legal”. Banco da Amazônia – BASA.
Guilhoto, J.J.M., M. Sonis, M., G.J.D. Hewings (1996). “Linkages and Multip Multiregional Framework: Integrations of Alternative A
er, 96-T-8 Regional Economics Applications Laboratory, University of Illinois, Urbana.
Hirschman, A.O. (1958) The Strategy of Economic Development. New Haven, Yal University Press.
2002a). Contas Regionais do Brasil, 1985-2000. Rio de Janeiro.
IBGE (2002b). Brasil em Números 2002. Rio de Janeiro. Vol. 10.
Leontief, W. (1951). The Structure of the American Economy. Second Edition. New York:
R.E., e P.D. Blair (1985). Input-Output Analysis: Foundations and Extensions. lewood Cliffs: Prentice-Hall.