http://dx.doi.org/10.4236/ojmi.2015.52012
How to cite this paper: Sarah, S., Prodhan, M.H., Hamid, K. and Huq, F. (2015) Effect of Source to Camera Distance and Count Rate on Intrinsic Uniformity of SPECT Gamma Camera. Open Journal of Medical Imaging, 5, 78-84.
http://dx.doi.org/10.4236/ojmi.2015.52012
Effect of Source to Camera Distance and
Count Rate on Intrinsic Uniformity of
SPECT Gamma Camera
Sabrina Sarah1, Mahidul Haque Prodhan2*, Kawsar Hamid2, Fazlul Huq2
1Department of Applied Physics, Electronics and Communication Engineering, University of Dhaka, Dhaka, Bangladesh
2Department of Nuclear Engineering, University of Dhaka, Dhaka, Bangladesh
Email: *[email protected]
Received 17 May 2015; accepted 7 June 2015; published 10 June 2015
Copyright © 2015 by authors and Scientific Research Publishing Inc.
This work is licensed under the Creative Commons Attribution International License (CC BY). http://creativecommons.org/licenses/by/4.0/
Abstract
In this research, the excellent parameter for regular Quality Control (QC) testing of intrinsic unifor-mity for dual-head Single Photon Emission Computed Tomography (SPECT) gamma camera is de-termined. The integral and differential intrinsic uniformity tests for both Useful Field Of View (UFOV) and Centre Field Of View (CFOV) were done by insertion a point-source of 99mTc in front of the de-tectors with detached collimators to measure the effect of source to camera distance and a count rate on intrinsic uniformity. The result reveals that the best intrinsic uniformity image is obtained at source-to-camera distance of 3 m and a count rate between 16 and 60 M.
Keywords
Quality Control (QC), Intrinsic Uniformity, Useful Field of View (UFOV), Centre Field of View (CFOV), Source to Camera Distance, Count Rate
1. Introduction
Gamma camera is a diagnostic instrument which presents an exquisite genus of imaging. It has developed out of the necessity in nuclear medical imaging to view and analyze images of the anthropoid body or the distribution of physically injected, inhaled, or ingested radionuclides radiating gamma rays [1]. In the arrangement for measur-ing the value of intrinsic uniformity of a gamma camera, the gamma ray spectrometry system is very essential.
ment [2] [3]. Many authors have proposed various protocols for carrying out QC tests for intrinsic uniformity [4]-[9]. According to National Electrical Manufacture Association (NEMA) [4] and International Atomic Energy Agency (IAEA) [5], the evaluation of detector non-uniformity is the most prevalent practice in present day qual-ity control procedures of gamma camera. Before using gamma camera, day-to-day evaluation and judgment of flood-field uniformity are mandatory for patient testing [10] [11]. Any non-uniformity must be rejected and re-solved before patient testing to diminish artifacts and false-positive or false-negative patient consequences. We favor intrinsic uniformity testing because a 99mTc point source is freely available.
The majority of imaging in general nuclear medicine is performed with the gamma camera. Scintillation oc-curs when γ photons emitted from the source or patient interacts with the sodium iodide crystal to produce light. The primary components of the scintillation camera include the collimator, scintillation crystal, photomultiplier tube, positioning logic network, pulse height analyzer, and display [12].
Two types of uniformity parameters are considered in SPECT imaging. Among them, the Integral Uniformity (IU) is calculated as [13] [14],
( )
% 100% Max Min IUMax Min −
= ± ×
+ (1)
The maximum and the minimum pixel counts are found from the smoothed data. On the other hand, the Dif-ferential Uniformity (DU) is calculated as [15],
( )
% 100% High LowDU
High Low −
= ± ×
+ (2)
We performed quality test in accordance to intrinsic uniformity for SPECT gamma camera [11]. The main purpose of this current research work is to determine the best parameters for daily quality control testing of trinsic uniformity for dual head SPECT gamma camera from Siemens E. Cam signature series, Germany, in-stalled at Institute of Nuclear Medicine and Allied Sciences (INMAS), Dhaka Medical College Hospital (DMCH), Dhaka. The integral and differential intrinsic uniformity test for both useful field of view (UFOV) and central field of view (CFOV) was done by placing a point source of 99mTc in front of the detectors with removed colli-mators to measure the effect of source to camera distance and count rate on intrinsic uniformity. The intrinsic uniformity of the system is measured for the CFOV and UFOV [13]. The measured values are compared with the specification. The effects of source to camera distance and count rate have been investigated using intrinsic uniformity to assure quality control of SPECT gamma camera.
2. Methodology
2.1. Source Materials
99mTc radionuclide was used to measure intrinsic uniformity in this research work. The gamma camera used in this research was a dual head fickle angle system, model E. Cam series, manufactured by Siemens (Model No. 7823946).
2.2. Experimental Procedure and Data Acquisition System
The collimator has been detached from the camera. The camera has been set with its face vertical to the floor. Source container has been settled on the gantry arm facing the center of detectors with wide-ranging detachment. Camera apparent and the room have been prepared to confirm that there is no contagion. Then, later eliminating all existing sources from the room, the background radiation of the room has been carefully measured using the NaI (TI) crystal of the gamma camera, which was 140 countper second. Activity of a 99mTc source in a syringe has been measured in the dose calibrator afterward sex changing the needle.
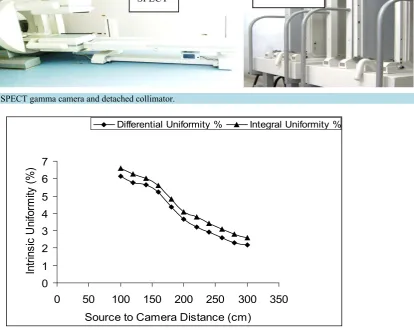
Un-iformity (DU) & Integral Uniformity (IU) has been determined using Inter View and medical software where the extreme and least pixel values were determined. Figure 1 shows the schematic picture of SPECT gamma cam-era and detached collimator.
3. Results and Analysis
Table 1 and Table 2 show how the intrinsic uniformity varies with source to camera distance and count rate for
[image:3.595.92.538.356.469.2]detectors 1 and 2 with respect to both UFOV and CFOV.
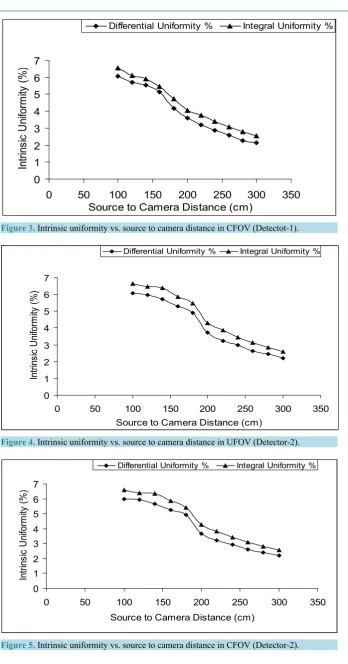
Figure 2 and Figure 3 show the integral and differential intrinsic uniformity of Detector-1 and Figure 4 and
Figure 5 show the integral and differential intrinsic uniformity of Detector-2 respectively of the scheme versus
the source to camera distance where the counting rate for acquiring the flood image was kept in the range of 50 - 60 kcps and the number of acquired counts for each flood image was 16 M. From the figure we found that both of the integral and differential intrinsic uniformity of the scheme enriched with increasing point source to cam-era distance. In our research 3.0 meter was the maximum distance.
Figure 6 and Figure 7 show the effect of the number of acquired counts on intrinsic uniformity of Detector-1
and Figure 8 and Figure 9 show the effect of the number of acquired counts on intrinsic uniformity of
[image:3.595.123.538.378.708.2]Detec-tor-2 respectively of the scheme when 95 MBq point source was used for all flood-field images, the intrinsic flood-field uniformity enhanced as the number of acquired counts for the flood-field image improved. The error bars on the figure shows the statistical variation. We demonstrated that by increasing the number of acquired counts (elongated stage to acquire the flood image), in both cases the differential and integral intrinsic unifor-mity for the UFOV and the CFOV improved because there were fewer statistical fluctuations. However, the in-cremental gain in intrinsic uniformity from 16 to 60 M was least.
Figure 1. SPECT gamma camera and detached collimator.
Figure 2. Intrinsic uniformity vs. source to camera distance in UFOV (Detector-1). 0
1 2 3 4 5 6 7
0 50 100 150 200 250 300 350 Source to Camera Distance (cm)
In
trin
sic
U
nif
or
m
ity
(%)
Figure 3. Intrinsic uniformity vs. source to camera distance in CFOV (Detectot-1).
Figure 4. Intrinsic uniformity vs. source to camera distance in UFOV (Detector-2).
Figure 5. Intrinsic uniformity vs. source to camera distance in CFOV (Detector-2). 0
1 2 3 4 5 6 7
0 50 100 150 200 250 300 350
Source to Camera Distance (cm)
In
trin
sic
U
nif
or
m
ity
(%)
Differential Uniformity % Integral Uniformity %
0 1 2 3 4 5 6 7
0 50 100 150 200 250 300 350
Source to Camera Distance (cm)
In
trin
sic
U
nif
or
m
ity
(%)
Differential Uniformity % Integral Uniformity %
0 1 2 3 4 5 6 7
0 50 100 150 200 250 300 350
Source to Camera Distance (cm)
In
trin
sic
U
nif
or
m
ity
(%)
[image:4.595.128.467.515.702.2]Figure 6. Intrinsic uniformity vs. number of acquired counts in UFOV (Detector-1).
[image:5.595.141.454.411.535.2]Figure 7. Intrinsic uniformity vs. number of acquired counts in CFOV (Detector-1).
Figure 8. Intrinsic uniformity vs. number of acquired counts in UFOV (Detector-2).
Figure 9. Intrinsic uniformity vs. number of acquired counts in CFOV (Detector-2).
0 1 2 3 4 5 6 7 8
0 5 10 15 20 25 30 35 40 45 50 55 60 Acquired Counts (milions)
In trin sic U nif or m ity
(%) Differential Uniformity % Integral Uniformity %
0 1 2 3 4 5 6 7 8
0 5 10 15 20 25 30 35 40 45 50 55 60 Acquired Counts (milions)
In trin sic U nif or m ity (%)
Differential Uniformity % Integral Uniformity %
0 1 2 3 4 5 6 7 8
0 5 10 15 20 25 30 35 40 45 50 55 60 Acquired Counts (milions)
Int rins ic U ni for m ity (%
) Differential Uniformity % Integral Uniformity %
0 1 2 3 4 5 6 7 8
0 5 10 15 20 25 30 35 40 45 50 55 60 Acquired Counts (millions)
Int rins ic U ni for m ity (%
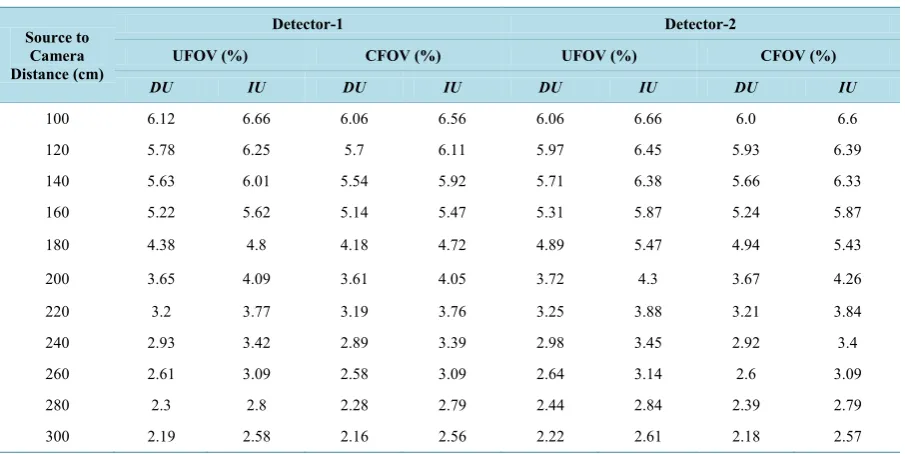
[image:5.595.142.454.565.700.2]Table 1.Intrinsic uniformity vs. source to camera distance.
Source to Camera Distance (cm)
Detector-1 Detector-2
UFOV (%) CFOV (%) UFOV (%) CFOV (%)
DU IU DU IU DU IU DU IU
100 6.12 6.66 6.06 6.56 6.06 6.66 6.0 6.6
120 5.78 6.25 5.7 6.11 5.97 6.45 5.93 6.39
140 5.63 6.01 5.54 5.92 5.71 6.38 5.66 6.33
160 5.22 5.62 5.14 5.47 5.31 5.87 5.24 5.87
180 4.38 4.8 4.18 4.72 4.89 5.47 4.94 5.43
200 3.65 4.09 3.61 4.05 3.72 4.3 3.67 4.26
220 3.2 3.77 3.19 3.76 3.25 3.88 3.21 3.84
240 2.93 3.42 2.89 3.39 2.98 3.45 2.92 3.4
260 2.61 3.09 2.58 3.09 2.64 3.14 2.6 3.09
280 2.3 2.8 2.28 2.79 2.44 2.84 2.39 2.79
300 2.19 2.58 2.16 2.56 2.22 2.61 2.18 2.57
Note: UFOV = Useful Field Of View; CFOV = Centre Field Of View; DU = Differential Uniformity; IU = Integral Uniformity.
Table 2.Intrinsic uniformity vs number of acquired counts.
Number of Acquired
Counts (Millions)
Detector-1 Detector-2
UFOV (%) CFOV (%) UFOV (%) CFOV (%)
DU IU DU IU DU IU DU IU
1 4.87 5.67 4.78 5.56 5.16 6.1 5.08 5.92
5 4.49 5.24 4.43 5.18 4.83 5.67 4.72 5.52
10 3.86 4.81 3.75 4.69 4.64 5.48 4.55 5.37
16 2.65 3.41 2.6 3.33 3.37 4.21 3.28 4.13
20 2.39 3.22 2.36 3.14 3.12 3.93 3.0 3.8
30 2.25 3.04 2.19 2.95 2.85 3.62 2.71 3.49
60 1.96 2.44 1.96 2.32 2.41 2.84 2.24 2.73
Note: UFOV = Useful Field Of View; CFOV = Centre Field Of View; DU = Differential Uniformity; IU = Integral Uniformity.
4. Conclusion
From this research, the QC parameters in accordance with intrinsic uniformity, the results ensemble the fact that the intrinsic uniformity is apt as long as it is maintained to the minimum level i.e. the lower the intrinsic unifor-mity is, the better the imaging and diagnosis are. The result confirms that the best intrinsic uniforunifor-mity image is attained at source to camera distance of 3 m and a count rate between 16 and 60 M. If one can maintain this re-sult in case of SPECT gamma camera imaging, then best images will be investigated to perform better diagnosis.
Acknowledgements
[image:6.595.89.538.361.525.2]References
[1] Paris, P., Hine, G.L. and Adams, R. (1981) BRH Test Pattern for the Evaluation of Gamma-Camera Performance. The Journal of Nuclear Medicine, 22, 468-470.
[2] Lewellen, T.K. and Grahan, M.M. (1981)A Low-Contrast Phantom for Daily Quality Control. The Journal of Nuclear Medicine, 22, 279-282.
[3] Hasegawa, B.H., Kirch, D.L., Lefree, M.T., Vogel, R.A., Steele, P.P. and Hendee, W.R. (1981) Quality Control of Scintillation Cameras Using a Minicomputer. The Journal of Nuclear Medicine, 22, 1075-1080.
[4] National Electrical Manufacturers Association (2001) NEMA NU 1-2001: Performance Measurements of Scintillation Cameras. http://www.nema.org/stds/nu1.cfm
[5] IAEA-TECDOC-602 (1991) Quality Control of Nuclear Medicine Instruments. http://www-pub.iaea.org/MTCD/Publications/PDF/te_602_web.pdf
[6] International Electrotechnical Commission IEC Standard 61675-2 (2005) Radionuclide Imaging Devices—Characteristics and Test Conditions—Part 2: Single Photon Emission Computed Tomographs.
http://webstore.iec.ch/preview/info_iec61675-2%7Bed1.1%7Den.pdf
[7] O’Connor, M.K., Clinic, M. and Rochester, M.N. (1999) Quality Control of Scintillation Cameras (Planar and SPECT). http://www.aapm.org/meetings/99AM/pdf/2741-51264.pdf
[8] American Association of Physicists in Medicine-Nuclear Medicine Committee (1980) Scintillation Camera Acceptance Testing and Performance Evaluation. AAPM Report No. 6. American Institute of Physics, AIP Publishing, One Phys-ics Ellipse College Park, MD 20740 (301) 209-3100.
https://www.aapm.org/pubs/reports/rpt_06.pdf
[9] Zobly, S.M.S. and Osman, A.O. (2010) Effect of Different Parameters on Intrinsic Uniformity Test for MEDISO Sin-gle-Head Gamma Camera. Journals of University of Gezira, 5, 1-9.
[10] Bushberg, J.T., Seibert, J.A., Leidholdt, E.M. and Boone, J.M. (2002) Essential Physics of Medical Imaging. 2nd Edi-tion, Lippincott Williams & Wilkins, Philadelphia.
[11] Ejeh, J.E., Adedapo, K.S., Akinlade, B.I. and Osifo, B.O.A. (2011) Gamma Camera Intrinsic Uniformity in an Unsta-ble Power Supply Environment. Hellenic Journal of Nuclear Medicine, 14.
[12] Anger, H.O. (1964) Scintillation Camera with Multichannel Collimators. The Journal of Nuclear Medicine, 5, 515-531. [13] Cherry, S.R., Sorenson, J.A. and Phelps, M.E. (2012) Physics in Nuclear Medicine. 4th Edition, Elsevier Inc.,
Philadel-phia.
[14] Abdelhalim, M.A.K., Rizk, R.A.M., Farag, H.I. and Reda, S.M. (2009) Effect of Energy Window Width on Planer and SPECT Image Uniformity. Journal of King Saud University—Science, 21, 145-150.
http://dx.doi.org/10.1016/j.jksus.2009.06.001