http://dx.doi.org/10.4236/ajps.2015.69147
How to cite this paper: Panthee, D.R., Perkins-Veazie, P., Anderson, C. and Ibrahem, R. (2015) Diallel Analysis for Lycopene Content in the Hybrids Derived from Different Colored Parents in Tomato. American Journal of Plant Sciences, 6, 1483-1492. http://dx.doi.org/10.4236/ajps.2015.69147
Diallel Analysis for Lycopene Content in the
Hybrids Derived from Different Colored
Parents in Tomato
Dilip R. Panthee1*, Penelope Perkins-Veazie2, Candice Anderson1, Ragy Ibrahem1
1Department of Horticultural Science, North Carolina State University, Mountain Horticultural Crops Research
and Extension Center, Mills River, NC, USA
2Department of Horticultural Science, North Carolina State University, Plants for Human Health Institute,
Kannapolis, NC, USA
Email: *[email protected]
Received 26 May 2015; accepted 6 June 2015; published 23 June 2015
Copyright © 2015 by authors and Scientific Research Publishing Inc.
This work is licensed under the Creative Commons Attribution International License (CC BY).
http://creativecommons.org/licenses/by/4.0/
Abstract
Lycopene is a red pigment in tomato with purported antioxidant properties. As the amount of ly-copene has been reported to differ in different colored tomatoes or even absent in non-red toma-toes, the objective of this study was to investigate the inheritance of lycopene content and the col-or parameters of hybrids using a 10 parent diallel excluding reciprocals. Parents differed in gen-eral combining ability (GCA) for lycopene and color parameters. “Chocolate Stripe” (purple and brown striped) had the highest lycopene content followed by NC 1CS (red colored with the crim-son gene) with the best general combining ability among parental lines. Hybrids differed in lyco-pene content and color parameters across two summer and greenhouse experiments, with no in-teraction between experiments indicating that the lycopene content was consistent. Narrow-sense heritability for lycopene was only 9% whereas broad-sense heritability was estimated to be 25%. The order of dominance for lycopene content was found as purple-brown > red > blue > yellow > green. Heritability estimates for color parameters were close to those for lycopene. This informa-tion may be useful in developing specialty type tomatoes or increasing lycopene content in toma-toes.
Keywords
Diallel, General Combining Ability (GCA), Heritability, Lycopene, Tomato, Specific Combining Ability (SCA)
*
1. Introduction
Consumers tend to make initial purchases of tomatoes based on external features such as color and appearance, making tomato fruit color an important trait. While red fruit color is dominant in most of the cases, there is a special demand for different colored tomatoes, especially: pink, bicolor (combination of two colors), yellow, orange, green and blue [1]. Tomato fruit color can largely be explained by mutations in the carotenoid pathway. A brief overview of the pathway follows (for a more complete review see Lu and Li [2]): yellow flesh (r-mutants) caused by a mutation in phytoene synthase (PSY) [3] [4], tangerine flesh color (t-mutants) caused by mutations in prolycopene isomerase (CrtISO), accumulation of lycopene resulting in deep red fruit (og/ogc) caused by muta-tions in β-cyclase [5] [6] and pink tomatoes caused by the y mutation which makes the fruit epidermis clear in-stead of yellow [7]. Lycopene is an important color pigment since the amount of lycopene is determined based on color intensity, particularly red component of the tomato. Lycopene has been shown to have: anti-cancer and an-ti-oxidant properties [8]-[10], and prevent cardio-vascular diseases [11] and diabetes [12]. The increased con-sumer awareness and the demand for food containing bioactive compounds, make lycopene a key trait for tomato breeders to select for [13]. As the importance of the interrelated traits of color and bioactive compounds increase for consumers, the genetics of fruit color becomes increasingly important for tomato breeders—a subject that has not been thoroughly investigated outside of the laboratory.
While tomato is rich in lycopene, isomer type and availability upon consumption of fresh fruit are under dis-cussion. It has been reported that the cis-isomer of lycopene is more readily absorbed than the trans-isomers, the major form in raw tomato [14] [15]. Tomato breeding challenges include increasing lycopene content and cis- lycopene isomers.
It has been realized by consumers as well as researchers for a long time that fruit quality including lycopene is the important trait to improve [16]. Realizing this fact, some efforts have been made in the past at NC State University, which resulted in some improved varieties released with improved fruit color [17] [18]. It has been reported that there is a positive correlation between fruit color and lycopene concentration [19]. Vogel et al. [20] used tomato genotypes with tangerine (t-mutant: LA3183), old gold (og-mutant: LA3179), yellow flesh (r-mutant: LA3691) and a control genotype (Alisa Craig) with red fruit. Carotenoid profiles and amounts differed among mutants. The r-mutant did not have any carotenoids whereas the t-mutant and og-mutant had a reduced level of β-carotene but an increased level of trans-lycopene, respectively.
The objective of this study was to investigate the inheritance of lycopene content and the color parameters of hybrids derived from tomato genotypes from diallel cross combinations excluding reciprocals. In this paper, we report the findings of experiments involving diallel crosses derived from 10 parents of different colors. Inheritance of fruit colorin tomato has not been reported, which may be interesting for tomato breeders aiming to improve specialty types of tomatoes.
2. Materials and Methods
2.1. Plant MaterialsTen tomato genotypes with different fruit color were selected as parents. Genotypes used in the crosses are de-scribed below:
1. “NC1CS” is a large-fruited fresh-market tomato breeding line with the “crimson” (ogc) gene. It has large, smooth fruits and flesh is dark red in ripe fruits [21].
2. “NC74CAP (2009)-Bk” has blue skin color, and small round fruited. Plant has determinate growth habit. 3. “NC72LYC (2009)-Bk” has yellow color with the β-gene.
4. “NC08133-1(x)-7W” has yellow and red stripes on the skin. 5. “NC28L-1(2008)” has large fruits with red color.
6. “NC95LYC (2009)-Bk” has large fruits with (r-mutant) yellow color. 7. “NC1Y” has yellow fruits with the “tangerine” (t) gene.
8. “Chocolate Stripe” has jumbo fascinated fruits with brown-purple stripes. This is an heirloom variety with indeterminate growth habit.
9. “Malachite Box” also has jumbo fascinated fruits with green flesh color. It has indeterminate growth habit. 10. “NC161L” [22] has pink fruit color and determinate growth habit.
All parents were crossed in diallel combinations without reciprocals to produce 45 F1 hybrids in the fall
2010 and 2011) and in the greenhouse (2010 spring and 2011 fall) at the Mountain Horticultural Crops Research and Extension Center, Mills River, NC,
Seeds were planted in 72 cell flats (56 × 28 cm2) in potting mix and transplants, at about 6 weeks from seed were planted by hand in the field for summer experiments, and in the plastic pot for greenhouse experiments. Plants of each genotype were planted with 45 cm of plant-to-plant, and 150 cm row-to-row spacing in the field for summer experiments. The soil was a clay-loam and the natural day light photoperiod was about 14/10 hr with 25˚C - 30˚C high and 14˚C - 16˚C low temperatures. Similar temperatures and photoperiods were main-tained in the greenhouse.
An experimental unit consisted of four plants in the greenhouse experiments and six plants in the field expe-riments. They were arranged in a randomized complete block design (RCBD) with three replications in each experiment. Parents and their F1s were planted in a three gallon (11356.24 cm3) plastic pot using potting mix in
the greenhouse. Fruits were harvested when they were ripe.
2.2. Color Capturing and Image Analysis with the Tomato Analyzer (TA)
Fully ripe fruit (USDA stage 6) were harvested from the middle four plants from each line. Fruit were taken to the horticulture laboratory immediately after harvest and rinsed with tap water to remove debris and then air dried. A minimum of six fruit per genotype, free of injury, were sliced in half longitudinally (from stem to blos-som end) with a sharp knife.
Tomato Analyzer (TA) software [ver. 2.2 (http://www.oardc.ohio-state.edu/vanderknaap/tomato_analyzer.htm)] [23] was used to obtain color parameters CIE L*, a*, b*, hue and chroma estimates. Images were taken from cut fruits using a flatbed scanner (Canon Image Scanner CanoScan 8800F Canon, Melville, NY). The scanner and fruit were covered with a cardboard box with a black background to avoid effects of ambient light. Detailed in-struction on taking images of tomato fruits is described by Rodríguez, Moyseenko [24]. Images of at least six fruit per line were taken and saved as “.JPEG” file. The Tomato Analyzer was used to estimate the color para-meters L*, a* and b* of the image. Average data of all fruit per scan was entered in an Excel file for further anal-ysis.
2.3. Lycopene Determination
Following the above measurements, about 250 - 400 g of tomato (one-half slice per fruit) was placed in plastic zip lock bags and held at −80˚C until analyzed for lycopene. Tomato slices were thawed and pureed using a homogenizer (Polytron PT10-35-GT with 20 mm PTDA generator, Kinematica, Bohemia, NY). Diluted purees (1:4 w/w water) were mixed in 50 mL centrifuge tubes then 20 mL poured into a 10 cm cuvette. Absorbance at 350 nm to 760 nm was measured using a Hunter Lab Ultra Scan Pro equipped with diffuse/8 xenon illumination (Hunter Associates, Reston, VA). Lycopene was calculated by subtracting the peak area at 750 nm (background light scatter) from that at 560 nm (the peak absorbance wavelength for total lycopene). Total lycopene was cal-culated using the system of Davis et al. [25]. Lycopene values were verified using HPLC and spectrophotometer analyses according to Perkins-Veazie, Collins [26] (data not shown).
2.4. Data Analysis
Analysis of variance (ANOVA) of lycopene and color parameters (L, a*, b*, hue and chroma) of F1 and parents
for each experiment and over experiments were carried out separately using SAS software [27]. The ANOVA model over experiments assumed genotypes to be the fixed effect and experiments to be random. Genotypic dif-ferences among experiments were separated by least significant difference (LSD) at 5% probability level. Com-bining ability analyses of F1s were conducted separately according to Griffing [28] by using method 4 (partial
diallel including parents) and model 1 (fixed effect) as described in Diallel-05 [29] to estimate the general (GCA) and specific combining ability (SCA) effects. Variance components were also estimated by the same models.
3. Results
3.1. Parents and F1s Means
indicating that it was producing in the similar levels of lycopene in each experiment. NC1CS (dark red) and NC 161L (pink) were also one of the top lycopene containing parent lines. Dark red color in NC 1CS is because of the crimson gene, which gives the gel an orange color. The pink color of NC161L is due to red flesh and a clear (transparent) skin. High lycopene content in the pink colored tomato indicated that probably the lycopene was being measured from flesh itself. Yellow color genotypes such as 08133-1(×)-7W and NC 1Y had much less lycopene as expected. Another yellow color genotype NC95LYC (2009) had no detectable lycopene. Levels of lycopene of different parents are given inTable 1.
3.2. Crosses with Purple Brown Parent
Chocolate Stripe was the parent with a purple brown stripe and a high lycopene content, Chocolate Stripe × NC 161L produced better hybrids (70.2 mg/kg) than Chocolate Stripe × Malachite Box (63.8 mg/kg) since NC 161L was better than Malachite Box for lycopene. Similarly, NC 1CS × Chocolate Stripe hybrid was better (66.1 mg/kg) than 08133-1(×)-7Wx Chocolate Stripe (60.3 mg/kg) hybrid for lycopene level since the latter cross in-volved a yellow fruited parent (Table 1). All crosses with Chocolate Stripe had the best level of lycopene in every environment. This indicated that Chocolate Stripe was one of the parents with best GCA.
3.3. Crosses with Red Fruited Parents
Red fruited parents were NC 1CS and 28L-1 (2008). NC 1CS combined extremely well with all other parents including red, yellow, blue, pink, green and a mixture of purple and brown colored tomato lines for lycopene content as well as color parameters. Even with the yellow parents, lycopene was present when crossed with yel-low and green parents (Table 1). Hybrids involving yellow parents including 95LYC (2009), 08133-1(×)-7W and NC 1Y produced reduced levels of lycopene. For example, NC 1CS × 08133-1(×)-7W hybrid had 61.4 mg/kg whereas NC 1CS × NC 1Y had 60.4 and NC 1CS × 95LYC (2009) had 56.9 mg/kg lycopene, respective-ly. This indicated that lycopene producing genes were dominant over yellow colored genes in tomato. Similar to NC 1CS, hybrids with 28L-1 (2008) produced good levels of lycopene even with yellow colored hybrids (Table 1). This indicated that red color was dominant over other colors, which was reflected in lycopene content.
3.4. Crosses with Pink Fruited Parent
Pink fruited parent, NC 161L, was one of the best parents for lycopene content. It produced high level of lyco-pene when combined with all colored parents including yellow. The best performing hybrid for lycolyco-pene was derived from Chocolate Stripe × NC 161L in this study (Table 1). In the pink fruited tomato, the skin is clear (transparent) and flesh is red. This indicated that pink fruited tomato is dominant for lycopene content in F1.
3.5. Crosses with Blue Fruited Parent
Blue tomatoes are believed to have higher flavonoid levels rather than lycopene. In fact, lycopene level was to-wards the low end in this study in blue tomato parent (74CAP (2009)). Hybrids developed with this parent pro-duced relatively low lycopene content except the one with 74CAP (2009) × Chocolate Stripe (69.5 mg/kg). This indicated that although less influential in lycopene biosynthesis, blue colored tomato was dominant over yellow (at least 48 mg/kg lycopene) and green (59.5 mg/kg lycopene) colored tomatoes. However, purple-brown stripe was dominant over blue since the former level was higher over blue tomato in the F1 (Table 1).
3.6. Crosses with Yellow Fruited Parents
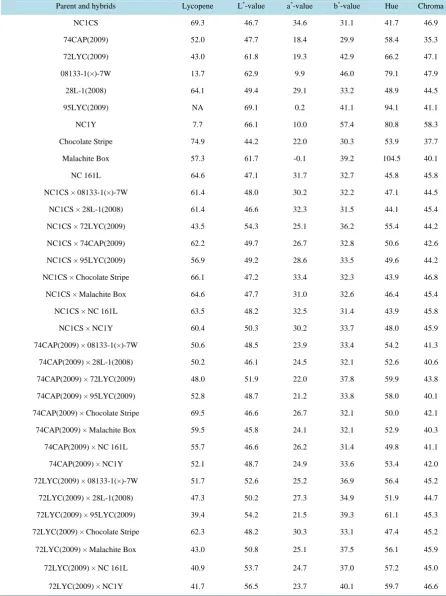
Table 1. Lycopene content (mg/kg) and color parameters (L*, a* b*, hue and chroma) in the parents and F1 hybrids of tomato
derived from parents of different color. Observations are the average of four experiments as described in the materials and methods.
Parent and hybrids Lycopene L*-value a*-value b*-value Hue Chroma
NC1CS 69.3 46.7 34.6 31.1 41.7 46.9
74CAP(2009) 52.0 47.7 18.4 29.9 58.4 35.3
72LYC(2009) 43.0 61.8 19.3 42.9 66.2 47.1
08133-1(×)-7W 13.7 62.9 9.9 46.0 79.1 47.9
28L-1(2008) 64.1 49.4 29.1 33.2 48.9 44.5
95LYC(2009) NA 69.1 0.2 41.1 94.1 41.1
NC1Y 7.7 66.1 10.0 57.4 80.8 58.3
Chocolate Stripe 74.9 44.2 22.0 30.3 53.9 37.7
Malachite Box 57.3 61.7 -0.1 39.2 104.5 40.1
NC 161L 64.6 47.1 31.7 32.7 45.8 45.8
NC1CS × 08133-1(×)-7W 61.4 48.0 30.2 32.2 47.1 44.5
NC1CS × 28L-1(2008) 61.4 46.6 32.3 31.5 44.1 45.4
NC1CS × 72LYC(2009) 43.5 54.3 25.1 36.2 55.4 44.2
NC1CS × 74CAP(2009) 62.2 49.7 26.7 32.8 50.6 42.6
NC1CS × 95LYC(2009) 56.9 49.2 28.6 33.5 49.6 44.2
NC1CS × Chocolate Stripe 66.1 47.2 33.4 32.3 43.9 46.8
NC1CS × Malachite Box 64.6 47.7 31.0 32.6 46.4 45.4
NC1CS × NC 161L 63.5 48.2 32.5 31.4 43.9 45.8
NC1CS × NC1Y 60.4 50.3 30.2 33.7 48.0 45.9
74CAP(2009) × 08133-1(×)-7W 50.6 48.5 23.9 33.4 54.2 41.3
74CAP(2009) × 28L-1(2008) 50.2 46.1 24.5 32.1 52.6 40.6
74CAP(2009) × 72LYC(2009) 48.0 51.9 22.0 37.8 59.9 43.8
74CAP(2009) × 95LYC(2009) 52.8 48.7 21.2 33.8 58.0 40.1
74CAP(2009) × Chocolate Stripe 69.5 46.6 26.7 32.1 50.0 42.1
74CAP(2009) × Malachite Box 59.5 45.8 24.1 32.1 52.9 40.3
74CAP(2009) × NC 161L 55.7 46.6 26.2 31.4 49.8 41.1
74CAP(2009) × NC1Y 52.1 48.7 24.9 33.6 53.4 42.0
72LYC(2009) × 08133-1(×)-7W 51.7 52.6 25.2 36.9 56.4 45.2
72LYC(2009) × 28L-1(2008) 47.3 50.2 27.3 34.9 51.9 44.7
72LYC(2009) × 95LYC(2009) 39.4 54.2 21.5 39.3 61.1 45.3
72LYC(2009) × Chocolate Stripe 62.3 48.2 30.3 33.1 47.4 45.2
72LYC(2009) × Malachite Box 43.0 50.8 25.1 37.5 56.1 45.9
72LYC(2009) × NC 161L 40.9 53.7 24.7 37.0 57.2 45.0
Continued
08133-1(×)-7W × 28L-1(2008) 56.1 50.9 27.4 33.9 51.4 43.9
08133-1(×)-7W × 95LYC(2009) 6.8 62.8 3.7 48.5 85.8 49.5
08133-1(×)-7W × Chocolate Stripe 60.3 50.6 28.3 33.8 50.3 44.4
08133-1(×)-7W × Malachite Box 8.9 64.1 5.8 45.8 83.3 46.2
08133-1(×)-7W × NC 161L 62.2 49.1 29.6 32.1 47.1 43.9
08133-1(×)-7W × NC1Y 50.6 49.3 28.8 33.6 49.5 44.6
28L-1(2008) × 95LYC(2009) 59.6 45.7 27.5 32.9 50.1 43.2
28L-1(2008) × Chocolate Stripe 66.5 47.3 32.2 33.2 46.0 46.7
28L-1(2008) × Malachite Box 63.6 47.1 28.0 32.6 49.3 43.3
28L-1(2008) × NC 161L 53.2 48.6 28.0 33.6 50.8 44.4
28L-1(2008) × NC1Y 55.6 48.3 29.9 33.5 48.4 45.3
95LYC(2009) × Chocolate Stripe 65.3 46.5 28.5 33.9 49.9 44.7
95LYC(2009) × Malachite Box NA 64.1 0.9 42.3 92.8 42.2
95LYC(2009) × NC 161L 65.1 48.6 27.3 34.0 51.1 43.9
95LYC(2009) × NC1Y 52.2 49.0 27.7 34.9 51.4 44.8
NC1Y × Chocolate Stripe 58.4 48.0 31.3 34.0 47.4 46.5
NC1Y × Malachite Box 54.3 47.3 29.2 33.9 49.2 45.1
NC1Y × NC 161L 58.5 48.0 31.7 33.8 46.8 46.7
Chocolate Stripe × Malachite Box 63.8 43.8 19.9 31.2 57.4 37.3
Chocolate Stripe × NC 161L 70.2 47.0 31.2 33.1 46.5 45.9
Malachite Box × NC 161L 69.5 47.9 28.4 33.0 49.1 43.9
LSD(0.05) 8.0 5.0 4.4 4.4 5.5 3.6
did not produce at all (Table 1). This indicated that yellow color was dominant over green suppressing lycopene content production.
3.7. Crosses with Green Fruited Parent
Malachite Box was the only green flesh parent in this study. When crossed with other colored parents, lycopene content was found to be influenced by the gene of other parent (Table 1). This indicated that green flesh color was recessive to almost all of the colors in this study.
3.8. Analysis of Variance
There was a significant difference (p < 0.05) among genotypes for lycopene content and color parameters in-cluding L*-value, a*-value, b*-value, hue and chroma (Table 2). However, there was no interaction (p > 0.05) between genotypes and environments for lycopene content indicating that the level of lycopene was consistent across the experiments, and lycopene content is not influenced by environment.
3.9. Combining Ability Analysis
Table 2. Analysis of variance for the lycopene and color parameters (L*, a*, b*, hue and chroma) over environments.
Source DF
Mean square F-value
Lycopene L*-value a*-value b*-value Hue Chroma Lycopene L*-value a*-value b*-value Hue Chroma
ENV 3 3429.5 3367.2 2599.8 3169.0 5317.5 2716.9 6.56** 533.77*** 420.83*** 1155.28*** 438.26*** 1266.18***
REP (ENV) 8 920.2 35.7 15.7 5.6 26.6 7.5 1.76ns 5.67*** 2.53* 2.03* 2.19* 3.49**
ENTRY 54 962.6 416.1 839.5 284.6 2164.0 126.4 1.84** 65.96*** 135.89*** 103.75*** 178.35*** 58.92***
ENV*ENTRY 162 508.7 14.5 21.2 9.0 38.3 8.2 0.97ns 2.31*** 3.43*** 3.27*** 3.16*** 3.8***
1(×)-7W and 74CAP (2009) were the negative contributors to the lycopene content in the hybrids, respectively (Table 3). There was no difference among the parents for specific combining ability (SCA). Although statisti-cally it was non-significant, a few combinations were notable. All hybrids with Chocolate Stripe and NC 1CS had positive gain for lycopene content whereas those with 28L-1(2008) and 74CAP (2009) had a mixture of positive and negative contribution with different parents. Other parents either did not have any contribution at all or there was a negative contribution for lycopene content. There was no GCA x environment and SCA x envi-ronment interaction for lycopene content (Table 3).
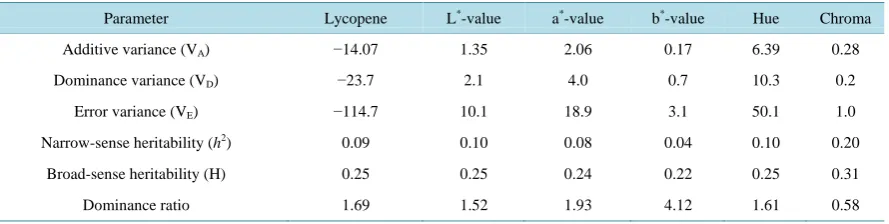
3.10. Heritability Estimates
In order to estimate the heritability from the variance components, parameters were estimated as described by Zhang, Kang [29]. Narrow-sense heritability for lycopene was only 9% whereas broad-sense heritability esti-mate was 25%. Narrow-sense and broad-sense heritability estiesti-mates for L*-value, a*-value, b*-value, hue and chroma were close to that of lycopene (Table 4).
3.11. Correlation between Lycopene and Color Parameters
When lycopene data were examined against color parameters, there was a negative correlation with L*-value (r = −0.77) and b*
-value (r = −0.79) whereas it was positive with a*-value (r = 0.67) and hue (r = 0.89). There was no correlation at all between lycopene and chroma (r = 0.06). This pattern is presented inFigure 1. Generally L*-value represents the lightness of the color which means lack of redness. Similarly, b*-value means yellow light which means no lycopene, which are negatively correlated. On the other hand, a*-value indicates the inten-sity of redness, which means there is more lycopene which is what we have found in the present study.
4. Discussion
Bicolor parent Chocolate Stripe (purple-brown) was found to have the highest lycopene content level among the ten parents. Most of the parents were not analyzed for lycopene content before other than NC 1CS [21], which was one of the superior parents in this study. This might be because of presence of the “crimson” gene. The crimson gene has been reported to increase the level of lycopene in tomato by up to 74% [30]. However, in our previous study, it was not proved to be true [31]. In the present study, a clear association between fruit color and lycopene level was established, which was not new information. However, inheritance of fruit color and lyco-pene level, and color parameters (L, a*, b*, hue and chroma) in F1s found in the present study was novel.
In the present study, the order of dominance was bi-color (purple-brown) > red > blue > yellow > green. Lev-el of lycopene was in this order when hybrids were produced by crossing different colored parents. There are li-mited numbers of published studies supporting this finding since studies were not conducted towards this direc-tion before.
Figure 1. Relationship between lycopene and color parameters. Overall, correlation between lycopene and L*-value was −0.77, lycopene and a*
[image:8.595.86.539.81.211.2]-value was 0.67, and lycopene and b*-value was −0.79 in this study. Correlation between lycopene and hue was 0.89 whereas that between lycopene and chroma was 0.06.
Table 3. Analysis of variance for the lycopene and color parameters (L*, a*, b*, hue and chroma) over environments for
gen-eral combining ability (GCA) and specific combining ability (SCA).
Source DF
Mean square F-value
Lycopene L*-value a*-value b*-value Hue Chroma Lycopene L*-value a*-value b*-value Hue Chroma
GCA 9 2260.4 532.1 1418.5 410.4 3021.7 147.4 4.3** 84.4*** 229.6*** 149.6*** 249.1*** 68.7***
SCA 45 1100.6 169.8 308.4 99.4 747.0 35.0 2.1** 26.9*** 49.9*** 36.2*** 61.6*** 16.3***
GCA*ENV 27 −750.3 72.2 110.1 9.0 340.8 14.8 −1.4 11.4*** 17.8*** 3.3*** 28.1*** 6.9***
SCA*ENV 135 −366.0 31.8 61.5 10.7 158.7 2.5 −0.7 5.0*** 9.9*** 3.9*** 13.1*** 1.1
Table 4. Variance component estimates for lycopene and color parameters (L*, a*, b*, hue and chroma) in tomato. The com-ponents were calculated by the method as described by Zhang, Kang [29].
Parameter Lycopene L*-value a*-value b*-value Hue Chroma
Additive variance (VA) −14.07 1.35 2.06 0.17 6.39 0.28
Dominance variance (VD) −23.7 2.1 4.0 0.7 10.3 0.2
Error variance (VE) −114.7 10.1 18.9 3.1 50.1 1.0
Narrow-sense heritability (h2) 0.09 0.10 0.08 0.04 0.10 0.20
Broad-sense heritability (H) 0.25 0.25 0.24 0.22 0.25 0.31
Dominance ratio 1.69 1.52 1.93 4.12 1.61 0.58
5. Conclusion
Overall, we have reported the inheritance of different color parameters and lycopene content in an F1 derived
from different colored parents of tomato. With the information of inheritance and dominance for lycopene, it may be useful to design and develop populations aiming to improve lycopene content in tomato or specialty to-mato with different colors for special markets.
Acknowledgements
This research was supported in part by grants from the North Carolina Department of Agriculture, Specialty Crop Block Grant Program and the North Carolina Tomato Growers Association. The technical help of Dr. Guoying Ma, Tyler Nance and Adrienne Ratti is highly appreciated.
References
[image:8.595.90.538.282.390.2] [image:8.595.96.541.424.536.2][2] Lu, S. and Li, L. (2008) Carotenoid Metabolism: Biosynthesis, Regulation, and Beyond. Journal of Integrative Plant
Biology, 50, 778-785. http://dx.doi.org/10.1111/j.1744-7909.2008.00708.x
[3] Fray, R.G. and Grierson, D. (1993) Identification and Genetic-Analysis of Normal and Mutant Phytoene Synthase Genes of Tomato by Sequencing, Complementation and Co-Suppression. Plant Molecular Biology, 22, 589-602. http://dx.doi.org/10.1007/BF00047400
[4] Gady, A.L.F., et al. (2012) Induced Point Mutations in the Phytoene Synthase 1 Gene Cause Differences in Carotenoid Content during Tomato Fruit Ripening. Molecular Breeding, 29, 801-812.
http://dx.doi.org/10.1007/s11032-011-9591-9
[5] Liu, L.H., et al. (2015) Regulation of Carotenoid Metabolism in Tomato. Molecular Plant, 8, 28-39. http://dx.doi.org/10.1016/j.molp.2014.11.006
[6] Apel, W. and Bock, R. (2009) Enhancement of Carotenoid Biosynthesis in Transplastomic Tomatoes by Induced Ly-copene-to-Provitamin A Conversion.Plant Physiology, 151, 59-66. http://dx.doi.org/10.1104/pp.109.140533
[7] Ballester, A.R., et al. (2010) Biochemical and Molecular Analysis of Pink Tomatoes: Deregulated Expression of the Gene Encoding Transcription Factor S1MYB12 Leads to Pink Tomato Fruit Color. Plant Physiology, 152, 71-84. http://dx.doi.org/10.1104/pp.109.147322
[8] Caputo, M., et al. (2004) Antioxidant Profiles of Corbara Small Tomatoes during Ripening and Effects of Aqueous Extracts on J774 Cell Antioxidant Enzymes. Journal of Food Biochemistry, 28, 1-20.
http://dx.doi.org/10.1111/j.1745-4514.2004.tb00052.x
[9] Aydemir, G., et al. (2013) Lycopene-Derived Bioactive Retinoic Acid Receptors/Retinoid-X Receptors-Activating Metabolites May Be Relevant for Lycopene’s Anti-Cancer Potential. Molecular Nutrition & Food Research, 57, 739- 747. http://dx.doi.org/10.1002/mnfr.201200548
[10] Lee, S.T., et al. (2013) Alpha-Tomatine Synergises with Paclitaxel to Enhance Apoptosis of Androgen-Independent Human Prostate Cancer PC-3 Cells in Vitro and in Vivo. Phytomedicine, 20, 1297-1305.
http://dx.doi.org/10.1016/j.phymed.2013.07.002
[11] Labate, J.A., Robertson, L.D., Wu, F., Tanksley, S.D. and Baldo, A.M. (2009) EST, COSII, and Arbitrary Gene Mark-ers Give Similar Estimates of Nucleotide DivMark-ersity in Cultivated Tomato (Solanum lycopersicum L.). Theoretical and
Applied Genetics, 118, 1005-1014. http://dx.doi.org/10.1007/s00122-008-0957-2
[12] Yang, K., Lule, U.S. and Ding, X.-L. (2006) Lycopene: Its Properties and Relationship to Human Health. Food
Re-views International, 22, 309-333. http://dx.doi.org/10.1080/87559120600864753
[13] Oltman, A.E., Jervis, S.M. and Drake, M.A. (2014) Consumer Attitudes and Preferences for Fresh Market Tomatoes.
Journal of Food Science, 79, S2091-S2097. http://dx.doi.org/10.1111/1750-3841.12638
[14] Unlu, N.Z., Bohn, T., Francis, D., Clinton, S.K. and Schwartz, S.J. (2007) Carotenoid Absorption in Humans Consum-ing Tomato Sauces Obtained from Tangerine or High-Beta-Carotene Varieties of Tomatoes. Journal of Agricultural
and Food Chemistry, 55, 1597-1603. http://dx.doi.org/10.1021/jf062337b
[15] Schnabele, K., Briviba, K., Bub, A., Roser, S., Pool-Zobel, B.L. and Rechkemmer, G. (2008) Effects of Carrot and Tomato Juice Consumption on Faecal Markers Relevant to Colon Carcinogenesis in Humans. British Journal of Nutri-tion, 99, 606-613. http://dx.doi.org/10.1017/S0007114507819143
[16] Causse, M., Buret, M., Robini, K. and Verschave, P. (2003) Inheritance of Nutritional and Sensory Quality Traits in Fresh Market Tomato and Relation to Consumer Preferences. Journal of Food Science, 68, 2342-2350.
http://dx.doi.org/10.1111/j.1365-2621.2003.tb05770.x
[17] Gardner, R.G. (2006) “Plum Crimson” Fresh-Market Plum Tomato Hybrid and Its Parents, NC EBR-7 and NC EBR-8.
Hortscience, 41, 259-260.
[18] Gardner, R.G. (2006) “Mountain Crest” Hybrid Tomato and Its Parent, NC 1 rinEC. Hortscience, 41, 261-262.
[19] Liu, Y.-S., Gur, A., Ronen, G., Causse, M., Damidaux, R., Buret, M., et al. (2003) There Is More to Tomato Fruit Co-lour than Candidate Carotenoid Genes. Plant Biotechnology Journal, 1, 195-207.
http://dx.doi.org/10.1046/j.1467-7652.2003.00018.x
[20] Vogel, J.T., Tieman, D.M., Sims, C.A., Odabasi, A.Z., Clark, D.G. and Klee, H.J. (2010) Carotenoid Content Impacts Flavor Acceptability in Tomato (Solanum lycopersicum). Journal of the Science of Food and Agriculture, 90, 2233- 2240. http://dx.doi.org/10.1002/jsfa.4076
[21] Panthee, D.R. and Gardner, R.G. (2011) “Mountain Majesty”: A Tomato Spotted Wilt Virus-Resistant Fresh-Market Hybrid Tomato and Its Parents NC 714 and NC 1CS. Hortscience, 46, 1321-1323.
[22] Panthee, D.R. and Gardner, R.G. (2014) “Mountain Rouge”: A Pink-Fruited, Heirloom-Type Hybrid Tomato and Its Parent Line NC 161L. Hortscience, 49, 1463-1464.
Ef-ficient Digital Phenotyping. Journal of the American Society for Horticultural Science, 133, 579-586.
[24] Rodríguez, G.R., Moyseenko, J.B., Robbins, M.D., Morejón, N.H., Francis, D.M. and van der Knaap, E. (2010) To-mato Analyzer: A Useful Software Application to Collect Accurate and Detailed Morphological and Colorimetric Data from Two-Dimensional Objects. Journal of Visualized Experiments, 37, 1-9. http://dx.doi.org/10.3791/1856
[25] Davis, A.R., Fish, W.W. and Perkins-Veazie, P. (2003) A Rapid Spectrophotometric Method for Analyzing Lycopene Content in Tomato and Tomato Products. Postharvest Biology and Technology, 28, 425-430.
http://dx.doi.org/10.1016/S0925-5214(02)00203-X
[26] Perkins-Veazie, P., Collins, J.K. and Roberts, W. (2006) Lycopene Content of Organically Grown Tomatoes. Hortscience,
41, 503-503.
[27] SAS Institute Inc. (2011) The SAS System, Version 9.3 for Windows. 9th Edition, SAS Institute, Cary.
[28] Griffing, B. (1956) Concept of General and Specific Combining Ability in Relation to Diallel Crossing Systems.
Aus-tralian Journal of Biological Sciences, 9, 463-493.
[29] Zhang, Y.D., Kang, M.S. and Lamkey, K.R. (2005) DIALLEL-SAS05: A Comprehensive Program for Griffing’s and Gardner-Eberhart Analyses. Agronomy Journal, 97, 1097-1106. http://dx.doi.org/10.2134/agronj2004.0260
[30] Thompson, K.A., Marshall, M.R., Sims, C.A., Wei, C.I., Sargent, S.A. and Scott, J.W. (2000) Cultivar, Maturity, and Heat Treatment on Lycopene Content in Tomatoes. Journal of Food Science, 65, 791-795.
http://dx.doi.org/10.1111/j.1365-2621.2000.tb13588.x
[31] Panthee, D.R., Perkins-Veazie, P., Randall, D. and Allan, F. (2013) Lycopene Estimation in Tomato Lines Using In-fra-Red Absorbance and Tomato Analyzer. International Journal of Vegetable Science, 19, 240-255.
http://dx.doi.org/10.1080/19315260.2012.715324
[32] Prema, G., Indiresh, K.M. and Santhosha, H.M. (2011) Studies on Genetic Variability in Cherry Tomato (Solanum
ly-copersicum var. Cerasiforme). Asian Journal of Horticulture, 6, 207-209.
[33] Panthee, D.R., Cao, C.X., Debenport, S.J., Rodríguez, G.R., Labate, J.A., Robertson, L.D., et al. (2012) Magnitude of Genotype x Environment Interactions Affecting Tomato Fruit Quality. Hortscience, 47, 721-726.
[34] Panthee, D.R., Labate, J.A., McGrath, M.T., Breksa III, A.P. and Robertson, L.D. (2013) Genotype and Environmental Interaction for Fruit Quality Traits in Vintage Tomato Varieties. Euphytica, 193, 169-182.