© 2018, IRJET | Impact Factor value: 6.171 | ISO 9001:2008 Certified Journal | Page 1
Data mining, big data, and artificial intelligence: An overview,
challenges, and research questions
Mohamad Shady Alrahhal
1, Adnan Abi Sen
21&2King Abdul-Aziz University, Faculty of Computing and Information Technology, Jeddah, Saudi Arabia
---***---Abstract - Recently, data mining and big data techniques
and tools have become popular due to the development occurred daily in these research fields. In this paper, we have a look at the most important techniques and tools used in both data mining and big data. We focus on the challenges related to the data mining techniques, representing them by ten specific research questions. In addition, the challenges that the researchers must manipulate in the big data research filed are introduced with supported examples.Key Words: Big Data, Challenged, Classification,
Clustering, Data Mining, Neural Network, Support Vector Machine.
1. INTRODUCTION
’... Knowledge Discovery is the most desirable end-product of computing. Finding new phenomena or enhancing our knowledge about them has a greater long-range value than optimizing production processes or inventories, and is second only to task that preserve our world and our environment. It is not surprising that it is also one of the most difficult computing challenges to do well ...’[1].
Current technological progress permits the storage and access of large amounts of data at virtually no cost. Although many times preached, the main problem in a current information-centric world remains to properly put the collected raw data to use. The true value is not in storing the data, but rather in our ability to extract useful reports and to find interesting trends and correlations, through the use of statistical analysis and inference, to support decisions and policies made by scientists and businesses [2, 3].
Before any attempt can be made to perform the extraction of this useful knowledge, an overall approach that describes how to extract knowledge needs to be established. Therefore, the focus of this paper is not on describing the methods that can be used to extract knowledge from data, but rather on discussing the methodology that supports the process that leads to finding this knowledge. The main reason for establishing and using process models is to organize the Knowledge Discovery and Data Mining (KDDM) projects within a common framework. The models help organizations to understand the Knowledge Discovery process and provide a road map to follow while planning and carrying out the projects. This in turn results in time and cost savings, and in a better understanding and acceptance of such projects. The first step is to understand that such processes are not trivial,
but rather involve multiple steps, reviews and iterations. To date, there have been several attempts made to develop such models, with varying degrees of success [4, 5, 6].
This paper summarizes the state-of-the-art in this subject area, and discusses future research directions. The main motivation for this paper is a lack of a comprehensive overview and comparison of KDDM models. Although several models have been developed that have received broad attention of both research and industrial communities, they have been usually discussed separately, making their comparison and selection of the most suitable model a daunting task.
The rest of this paper is organized as follows: Section 2 provides an overview about the classification task used in data mining and the corresponding techniques. Section 3 discusses the clustering tasks of data mining. In section 4, neural networks techniques are explored. Artificial inelegance and its relationship with big data analytics is introduced in Section 5. The challenges and the corresponding research questions are provided in Section 6. Finally the paper is concluded in Section 7.
2. Classification Task in Data Mining
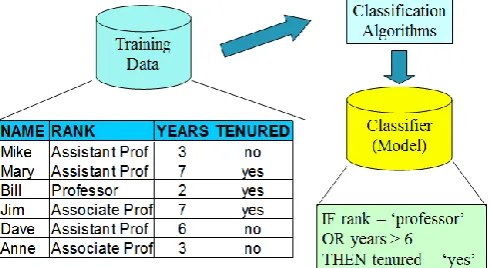
It is considered as a Supervised, where the training data (observations, measurements, etc.) are accompanied by labels indicating the class of the observations and new data is classified based on the training set [7, 8, 9, 10].
Classification has two main steps, which are:
1. Model construction: describing a set of
predetermined classes
Each tuple/sample is assumed to belong to a predefined class, as determined by the class label attribute.
The set of tuples used for model construction is training set. The model is represented as classification rules, decision trees, or mathematical formulae.
2. Model usage: for classifying future or unknown
objects
Estimate accuracy of the model.
© 2018, IRJET | Impact Factor value: 6.171 | ISO 9001:2008 Certified Journal | Page 2
Accuracy rate is the percentage of test set samples that are correctly classified by the model.
Test set is independent of training set (otherwise over fitting) If the accuracy is acceptable, use the model to classify new data.
Note: If the test set is used to select models, it is called validation (test) set.
[image:2.595.40.286.238.372.2]Figure 1 and 2 illustrates the tow major steps of classification task.
Figure -1:The first step of classification.
Figure -2:The second step of classification.
2.1 Bayes Classification Methods
A statistical classifier: performs probabilistic prediction, i.e., predicts class membership probabilities [11, 12].
Foundation: Based on Bayes’ Theorem.
Performance: A simple Bayesian classifier, naïve Bayesian classifier, has comparable performance with decision tree and selected neural network classifiers.
Incremental: Each training example can incrementally increase/decrease the probability that a hypothesis is correct prior knowledge can be combined with observed data.
Standard: Even when Bayesian methods are computationally intractable, they can provide a standard of optimal decision making against which other methods can be measured.
2.2 Bayes’ Theorem: Basics
Total probability Theorem:
(1)
Bayes’ Theorem:
(2)
1. Let X be a data sample (“evidence”): class label is
unknown.
2. Let H be a hypothesis that X belongs to class C.
3. Classification is to determine P(H|X), (i.e., posteriori probability): the probability that the hypothesis holds given the observed data sample X.
4. P(H) (prior probability): the initial probability.
5. P(X): probability that sample data is observed.
6. P(X|H) (likelihood): the probability of observing the
sample X, given that the hypothesis holds.
2.2.1 Prediction Based on Bayes’ Theorem
Given training data X, posteriori probability of a hypothesis H, P(H|X), follows the Bayes’ theorem [13, 14, 15].
Informally, this can be viewed as posteriori = likelihood x prior/evidence.
Predicts X belongs to Ci iff the probability P(Ci|X) is the highest among all the P(Ck|X) for all the k classes.
Practical difficulty: It requires initial knowledge of many probabilities, involving significant computational cost.
Let D be a training set of tuples and their associated class labels, and each tuple is represented by an n-D attribute vector X = (x1, x2, …, xn).
Suppose there are m classes C1, C2, …, Cm.
Classification is to derive the maximum posteriori, i.e., the maximal P(Ci|X).
This can be derived from Bayes’ theorem. Since P(X) is constant for all classes, only needs to be maximized.
2.2.2 Naïve Bayes Classifier
A simplified assumption: attributes are conditionally independent (i.e., no dependence relation between attributes) [16, 17, 18]:
) ( ) 1
| ( )
( M P Ai
i i
A B P B
P
) ( / ) ( ) | ( )
( ) ( ) | ( ) |
( X X
X X
X P H P H P
P H P H P H
[image:2.595.41.285.417.560.2]© 2018, IRJET | Impact Factor value: 6.171 | ISO 9001:2008 Certified Journal | Page 3
(3)
This greatly reduces the computation cost: Only counts the class distribution
If Ak is categorical, P(xk|Ci) is the # of tuples in Ci having value xk for Ak divided by |Ci, D| (# of tuples of Ci in D)
If Ak is continous-valued, P(xk|Ci) is usually computed based on Gaussian distribution with a mean μ and standard deviation σ
and P(xk|Ci) is
(4)
1. Advantages:
Easy to implement
Good results obtained in most of the cases
2. Disadvantages:
Assumption: class conditional independence,
therefore loss of accuracy
Practically, dependencies exist among variables
E.g., hospitals: patients: Profile: age, family history, etc. Symptoms: fever, cough etc., Disease: lung cancer, diabetes, etc.
Dependencies among these cannot be modeled by
Naïve Bayes Classifier
2.2.3 Classifier Evaluation Metrics
1. Precision: exactness – what % of tuples that the classifier labeled as positive are actually positive 2. Recall: completeness – what % of positive tuples did
the classifier label as positive?
3. F measure (F1 or F-score): harmonic mean of precision and recall,
4. Fß: weighted measure of precision and recall
3. Clustering Task in Data Mining
Cluster: A collection of data objects, where it can be similar (or related) to one another within the same group or dissimilar (or unrelated) to the objects in other groups [19]. Cluster analysis (or clustering, data segmentation). Finding similarities between data according to the characteristics found in the data and grouping similar data objects into clusters.
Unsupervised learning: no predefined classes (i.e., learning by observations vs. learning by examples: supervised).
3.1 Basic Steps to Develop a Clustering Task
1. Feature selection
Select info concerning the task of interest. Minimal information redundancy.
2. Proximity measure
Similarity of two feature vectors.
3. Clustering criterion
Expressed via a cost function or some rules.
4. Clustering algorithms
Choice of algorithms.
5. Validation of the results
Validation test (also, clustering tendency test).
6. Interpretation of the results
Integration with applications.
3.2 Measure the Quality of Clustering
1. Dissimilarity/Similarity metric [20]
Similarity is expressed in terms of a
distance function, typically metric: d(i, j).
The definitions of distance functions are usually rather different for interval-scaled, boolean, categorical, ordinal ratio, and vector variables.
Weights should be associated with different
variables based on applications and data semantics/
2. Quality of clustering [21, 22]
There is usually a separate “quality”
function that measures the “goodness” of a cluster.
It is hard to define “similar enough” or “good enough”.
3.3 Considerations for Cluster Analysis
1. Partitioning criteria
Single level vs. hierarchical partitioning (often, multi-level hierarchical partitioning is desirable).
2. Separation of clusters
Exclusive (e.g., one customer belongs to
only one region) vs. non-exclusive (e.g., one document may belong to more than one class).
3. Similarity measure
Distance-based (e.g., Euclidian, road
network, vector) vs. connectivity-based (e.g., density or contiguity).
4. Clustering space
Full space (often when low dimensional) vs.
subspaces (often in high-dimensional clustering).
) | ( ... ) | 2 ( ) | 1 ( 1
) | ( ) |
( n Px Ci Px Ci Px n Ci k x k Ci
P Ci
P
X
2 2
2 ) (
2 1 ) , ,
(
x
e x
© 2018, IRJET | Impact Factor value: 6.171 | ISO 9001:2008 Certified Journal | Page 4
3.4 Major Clustering Approaches
1. Partitioning approach [23]:
Construct various partitions and then
evaluate them by some criterion, e.g., minimizing the sum of square errors.
Typical methods: k-means, k-medoids,
CLARANS
2. Hierarchical approach [24]:
Create a hierarchical decomposition of the
set of data (or objects) using some criterion.
Typical methods: Diana, Agnes, BIRCH,
CAMELEON.
3. Density-based approach [25]:
Based on connectivity and density
functions.
Typical methods: DBSACN, OPTICS,
DenClue.
4. Grid-based approach [26]:
based on a multiple-level granularity
structure.
Typical methods: STING, WaveCluster,
CLIQUE.
5. Model-based [27]:
A model is hypothesized for each of the clusters and tries to find the best fit of that model to each other.
Typical methods:EM, SOM, COBWEB.
6. Frequent pattern-based [28]:
Based on the analysis of frequent patterns.
Typical methods: p-Cluster.
7. User-guided or constraint-based [29]:
Clustering by considering user-specified or
application-specific constraints.
Typical methods: COD (obstacles),
constrained clustering.
8. Link-based clustering [30]:
Objects are often linked together in various
ways.
Massive links can be used to cluster objects:
SimRank, LinkClus.
4. Neural Networks VS. Support Vector Machine
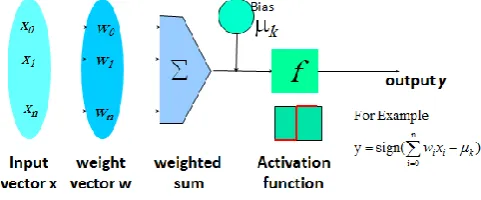
A neural network learning algorithm. Started by psychologists and neurobiologists to develop and test computational analogues of neurons. A neural network: A set of connected input/output units where each connection has a weight associated with it During the learning phase, the network learns by adjusting the weights so as to be able to predict the correct class label of the input tuples Also referred
[image:4.595.316.557.121.221.2]to as connectionist learning due to the connections between units. Figure 3 illustrates the concept of neural network [31].
Figure -3:Neural network concept.
An n-dimensional input vector x is mapped into variable y by means of the scalar product and a nonlinear function mapping. The inputs to unit are outputs from the previous layer. They are multiplied by their corresponding weights to form a weighted sum, which is added to the bias associated with unit. Then a nonlinear activation function is applied to it. Iteratively process a set of training tuples & compare the network's prediction with the actual known target value. For each training tuple, the weights are modified to minimize the mean squared error between the network's prediction and the actual target value. Modifications are made in the “backwards” direction: from the output layer, through each hidden layer down to the first hidden layer, hence “backpropagation”.
Steps
1. Initialize weights to small random numbers,
associated with biases.
2. Propagate the inputs forward (by applying
activation function).
3. Backpropagate the error (by updating weights and
biases).
4. Terminating condition (when error is very small, etc.)
4.1 Neural Networks as a Classifier
1. Weakness
Long training time .
Require a number of parameters typically best
determined empirically, e.g., the network topology or “structure.”
Poor interpretability: Difficult to interpret the symbolic meaning behind the learned weights and of “hidden units” in the network.
2. Strength
High tolerance to noisy data.
Ability to classify untrained patterns.
Well-suited for continuous-valued inputs and
© 2018, IRJET | Impact Factor value: 6.171 | ISO 9001:2008 Certified Journal | Page 5 Successful on an array of real-world data, e.g.,
hand-written letters.
Algorithms are inherently parallel.
Techniques have recently been developed for the
extraction of rules from trained neural networks.
4.2 Neural Networks VS. Support Vector Machine
[image:5.595.40.287.312.428.2]A relatively new classification method for both linear and nonlinear data. It uses a nonlinear mapping to transform the original training data into a higher dimension. With the new dimension, it searches for the linear optimal separating hyperplane (i.e., “decision boundary”). With an appropriate nonlinear mapping to a sufficiently high dimension, data from two classes can always be separated by a hyperplane. SVM finds this hyperplane using support vectors (“essential” training tuples) and margins (defined by the support vectors) [32], as shown in Figure 4.
[image:5.595.360.506.519.616.2]Figure -4:Support vector machine concept.
Table -1: SVM vs. Neural network.
SVM Neural Network
Deterministic algorithm. Nondeterministic algorithm. Nice generalization properties. Generalizes well but doesn’t have strong mathematical foundation.
Hard to learn – learned in batch mode using quadratic
programming techniques.
Can easily be learned in incremental fashion. Using kernels can learn very
complex functions. To learn complex functions—use multilayer perceptron (nontrivial).
5. Artificial Inelegance and Big Data Analytics
Big [volume] Data is not new!. Big Data means different things to people with different backgrounds and interests. Traditionally, “Big Data” = massive volumes of data (E.g., volume of data at CERN, NASA, Google, …). Where does the Big Data come from?. Everywhere! Web logs, RFID, GPS systems, sensor networks, social networks, Internet-based text documents, Internet search indexes, detail call records, astronomy, atmospheric science, biology, genomics, nuclear physics, biochemical experiments, medical records, scientific research, military surveillance, multimedia archives.
The Vs that define Big Data (Volume, Variety, Velocity, Veracity, Variability, and Value).
Big Data by itself, regardless of the size, type, or speed, is worthless. But, Big Data + “big” analytics = value. With the value proposition, Big Data also brought about big challenges, such as effectively and efficiently capturing, storing, and analyzing Big Data and new breed of technologies needed (developed (or purchased or hired or outsourced).
5.1 Big Data Technologies
1. MapReduce
2. Hadoop
3. Hive
4. Pig
5. Hbase
6. Flume
7. Oozie
8. Ambari
9. Avro
10. Mahout, Sqoop, Hcatalog, etc.
Here, we focus on MapReduce and Hadoop.
5.1.1 MapReduce
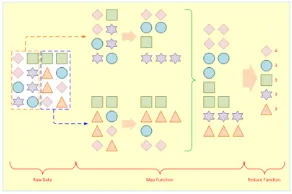
MapReduce distributes the processing of very large multi-structured data files across a large cluster of ordinary machines/processors. Goal - achieving high performance with “simple” computers. Developed and popularized by Google. Good at processing and analyzing large volumes of multi-structured data in a timely manner. Example tasks: indexing the Web for seearch, graph analysis, text analysis, machine learning. Figure 6 illustrates how MapReduce works [33].
Figure -4:MapReduce work concept.
5.1.2 Hadoop
© 2018, IRJET | Impact Factor value: 6.171 | ISO 9001:2008 Certified Journal | Page 6
How Does Hadoop Work?
1. Access unstructured and semi-structured
data (e.g., log files, social media feeds, other data sources).
2. Break the data up into “parts,” which are
then loaded into a file system made up of multiple nodes running on commodity hardware using HDFS.
3. Each “part” is replicated multiple times and
loaded into the file system for replication and failsafe processing.
4. A node acts as the Facilitator and another as Job Tracker.
5. Jobs are distributed to the clients, and once completed the results are collected and aggregated using MapReduce.
6. Challenges and research Questions
It’s no secret that both private enterprise and government seek greater insights into people’s behaviors and sentiments. Organizations use various analytical techniques—from crowdsourcing to genetic algorithms to neural networks to sentiment analysis—to study both structured and unstructured forms of data that can aid product and process discovery, productivity, and policymaking. This data is collected from numerous sources including sensor networks, government data holdings, company market lead databases, and public profiles on social networking sites [35].
Although data mining in one form or another has occurred since people started to maintain records in the modern era, so-called big data brings together not only large amounts of data but also various data types that previously never would have been considered together. These data streams require ever-increasing processing speeds, yet must be stored economically and fed back into business-process life cycles in a timely manner.
Since the Internet’s introduction, we’ve been steadily moving from text-based communications to richer data that include images, videos, and interactive maps as well as associated metadata such as geolocation information and time and date stamps. Twenty years ago, ISDN lines couldn’t handle much more than basic graphics, but today’s high-speed communication networks enable the transmission of storage-intensive data types. For instance, smartphone users can take high-quality photographs and videos and upload them directly to social networking sites via Wi-Fi and 3G or 4G cellular networks. We’ve also been steadily increasing the amount of data captured in bidirectional interactions, both people-to machine and machine-to-machine, by using telematics and telemetry devices in systems of systems. Of even greater importance are e-health networks that allow for data merging and sharing of high-resolution images in the form of patient x-rays, CT scans, and MRIs between stakeholders. Advances in data storage and mining
technologies make it possible to preserve increasing amounts of data generated directly or indirectly by users and analyze it to yield valuable new insights. For example, companies can study consumer purchasing trends to better target marketing. In addition, near-real-time data from mobile phones could provide detailed characteristics about shoppers that help reveal their complex decision-making processes as they walk through malls.
While big data can yield extremely useful information, it also presents new challenges with respect to how much data to store, how much this will cost, whether the data will be secure, and how long it must be maintained. For example, both companies and law enforcement agencies increasingly rely on video data for surveillance and criminal investigation. Closed-circuit television (CCTV) is ubiquitous in many commercial buildings and public spaces. Police cars have cameras to record pursuits and traffic stops, as well as dash-cams for complaint handling. Many agencies are now experimenting with body-worn video cameras to record incidents and gather direct evidence from a crime scene for use in court, obviating the need for eyewitness versions of events.5 Taser guns also now come equipped with tiny cameras. Because all of these devices can quickly generate a large amount of data, which can be expensive to store and time-consuming to process, operators must decide whether it is more costeffective to let them run continuously or only capture selective images or scenes.
Big data also presents new ethical challenges. Corporations are using big data to learn more about their workforce, increase productivity, and introduce revolutionary business processes. However, these improvements come at a cost: tracking employees’ every move and continuously measuring their performance against industry benchmarks introduces a level of oversight that can quash the human spirit. Such monitoring might be in the best interest of a corporation but is not always in the best interest of the people who make up that corporation. In addition, as big multimedia datasets become commonplace, the boundaries between public and private space will blur. Emerging online apps will not only enable users to upload video via mobile social networking but will soon incorporate wearable devices in the form of a digital watch or glasses to allow for continuous audiovisual capture. People will essentially become a camera.6 This publicly available data will dwarf that generated by today’s CCTV cameras.
The challenges related to data mining and the corresponding research questions can be listed as follows:
1. How effectively analysis information network?
2. How to discover, understand and use of patterns?
3. How to manipulate stream data mining efficiently?
4. How to min moving object data, RFID data, and data
from sensor networks?
5. How to process spatiotemporal and multimedia data
© 2018, IRJET | Impact Factor value: 6.171 | ISO 9001:2008 Certified Journal | Page 7
6. How to min text, Web, and other unstructured data
in an efficient manner?
7. How to model data cube-oriented multidimensional
online analytical mining?
8. How to visualize data mining?
9. How to customize domain-specific data mining:
Work in each scientific and engineering domain?
10. How to ensure the privacy of the proceeded data?
5. CONCLUSION
In this paper, we introduce an overview about the data mining research filed and its relationship with big data and artificial inelegance. We give some details about the most important tasks used in data mining, which are classification and clustering. In addition, the concepts of neural networks and support vector machine are explained. Finally, we conduct the challenges related to both data mining and big data that must be taken into consideration to have an effective machine learning.
In the future work, we intend to compare different data mining techniques based on some statistical model supported with specific criteria.
REFERENCES
[1] Kurgan, Lukasz A., and Petr Musilek. "A survey of Knowledge Discovery and Data Mining process models." The Knowledge Engineering Review 21.1 (2006): 1-24.
[2] He, Ying, et al. "Big data analytics in mobile cellular networks." IEEE access 4 (2016): 1985-1996.
[3] Anastasi, Giuseppe, et al. "Energy conservation in wireless sensor networks: A survey." Ad hoc networks 7.3 (2009): 537-568.
[4] Kurgan, Lukasz A., and Petr Musilek. "A survey of Knowledge Discovery and Data Mining process models." The Knowledge Engineering Review 21.1 (2006): 1-24.
[5] Kurgan, Lukasz A., and Petr Musilek. "A survey of Knowledge Discovery and Data Mining process models." The Knowledge Engineering Review 21.1 (2006): 1-24.
[6] Choudhary, Alok K., et al. "Knowledge discOvery And daTa minINg inteGrated (KOATING) Moderators for collaborative projects." International Journal of Production Research 49.23 (2011): 7029-7057.
[7] Ashfaq, Rana Aamir Raza, et al. "Fuzziness based semi-supervised learning approach for intrusion detection system." Information Sciences 378 (2017): 484-497.
[8] Mahadevan, Sankar, et al. "Analysis of metabolomic data
using support vector machines." Analytical
Chemistry 80.19 (2008): 7562-7570.
[9] Morente-Molinera, Juan Antonio, et al. "Improving Supervised Learning Classification Methods Using Multigranular Linguistic Modeling and Fuzzy Entropy." IEEE Transactions on Fuzzy Systems 25.5 (2017): 1078-1089.
[10] Hauberg, Søren, et al. "Dreaming more data: Class-dependent distributions over diffeomorphisms for learned data augmentation." Artificial Intelligence and Statistics. 2016.
[11] Esteva, Andre, et al. "Dermatologist-level classification
of skin cancer with deep neural
networks." Nature 542.7639 (2017): 115.
[12] Shokri, Reza, et al. "Membership inference attacks against machine learning models." Security and Privacy (SP), 2017 IEEE Symposium on. IEEE, 2017.
[13] Puga, Jorge López, Martin Krzywinski, and Naomi
Altman. "Points of significance: Bayes' theorem." (2015): 277.
[14] Zhao, Jia, et al. "A heuristic clustering-based task deployment approach for load balancing using bayes theorem in cloud environment." IEEE Transactions on Parallel and Distributed Systems 27.2 (2016): 305-316.
[15] Norris, Dennis, James M. McQueen, and Anne Cutler. "Prediction, Bayesian inference and feedback in speech recognition." Language, cognition and neuroscience 31.1 (2016): 4-18.
[16] Tsangaratos, Paraskevas, and Ioanna Ilia. "Comparison of a logistic regression and Naïve Bayes classifier in landslide susceptibility assessments: The influence of
models complexity and training dataset
size." Catena 145 (2016): 164-179.
[17] Farid, Dewan Md, et al. "Hybrid decision tree and naïve Bayes classifiers for multi-class classification tasks." Expert Systems with Applications 41.4 (2014): 1937-1946.
[18] Zhou, Xingxing, et al. "Detection of pathological brain in MRI scanning based on wavelet-entropy and naive Bayes classifier." International Conference on Bioinformatics and Biomedical Engineering. Springer, Cham, 2015.
[19] Sarstedt, Marko, and Erik Mooi. "Cluster analysis." A concise guide to market research. Springer, Berlin, Heidelberg, 2014. 273-324.
[20] Ozturk, Celal, Emrah Hancer, and Dervis Karaboga.
© 2018, IRJET | Impact Factor value: 6.171 | ISO 9001:2008 Certified Journal | Page 8
colony algorithm." Applied Soft Computing 28 (2015): 69-80.
[21] Dhanachandra, Nameirakpam, Khumanthem Manglem,
and Yambem Jina Chanu. "Image segmentation using K-means clustering algorithm and subtractive clustering algorithm." Procedia Computer Science 54.2015 (2015): 764-771.
[22] Chen, Yunliang, et al. "Air quality data clustering using EPLS method." Information Fusion 36 (2017): 225-232.
[23] Cutting, Douglass R., et al. "Scatter/gather: A cluster-based approach to browsing large document collections." ACM SIGIR Forum. Vol. 51. No. 2. ACM, 2017.
[24] Zheng, Yuhui, et al. "Image segmentation by generalized hierarchical fuzzy C-means algorithm." Journal of Intelligent & Fuzzy Systems 28.2 (2015): 961-973.
[25] Wu, Dingming, and Christian S. Jensen. "A density-based approach to the retrieval of top-k spatial textual clusters." Proceedings of the 25th ACM International on
Conference on Information and Knowledge
Management. ACM, 2016.
[26] Khan, Abdul Waheed, et al. "VGDRA: a virtual grid-based dynamic routes adjustment scheme for mobile sink-based wireless sensor networks." IEEE sensors journal 15.1 (2015): 526-534.
[27] Bouveyron, Charles, and Camille Brunet-Saumard.
"Model-based clustering of high-dimensional data: A review." Computational Statistics & Data Analysis 71 (2014): 52-78.
[28] RODRÍGUEZ, ANDRES EDUARDO GUTIERREZ.
"Pattern-based clustering using unsupervised decision trees." (2015).
[29] Cao, Jianping, et al. "User-guided large attributed graph clustering with multiple sparse annotations." Pacific-Asia Conference on Knowledge Discovery and Data Mining. Springer, Cham, 2016.
[30] Ren, Xiang, et al. "Clustype: Effective entity recognition
and typing by relation phrase-based
clustering." Proceedings of the 21th ACM SIGKDD International Conference on Knowledge Discovery and Data Mining. ACM, 2015.
[31] Sharmila, J., and A. Subramani. "A COMPARATIVE ANALYSIS OF WEB INFORMATION EXTRACTION TECHNIQUES DEEP LEARNING vs. NAIVE BAYES vs. BACK PROPAGATION NEURAL NETWORKS IN WEB DOCUMENT EXTRACTION." ICTACT Journal on Soft Computing 6.2 (2016).
[32] Deka, Paresh Chandra. "Support vector machine
applications in the field of hydrology: a review." Applied Soft Computing 19 (2014): 372-386.
[33] Chiu, Chi-Hsien, et al. "Distributed steam processing." U.S. Patent No. 9,178,935. 3 Nov. 2015.
[34] Landset, Sara, et al. "A survey of open source tools for machine learning with big data in the Hadoop ecosystem." Journal of Big Data 2.1 (2015): 24.
[35] Bendre, Mininath R., and Vijaya R. Thool. "Analytics, challenges and applications in big data environment: a survey." Journal of Management Analytics 3.3 (2016): 206-239.
BIOGRAPHIES:
First Author Mohamad Shady Alrahhal: Assistant prof. received PHD student at King Abdulaziz University, KSA, department of computer science, faculty of computing and information technology. Received master degree in web science from Damascus University, Syria, (2013). Received a degree of computer engineering from Albath University, Homs, Syria, (2011). His interest includes security and privacy in social networks, image processing, data mining, machine learning, Big data, and high performance computing.
Second author Adnan Abi Sen: PHD student at King Abdulaziz University, KSA, department of computer science, faculty of computing and information technology. Received master degree master degree of in web science and MA business administration from Damascus University, Syria, (2013). Received a degree of computer engineering from Albath University, Homs, Syria, (2011). His interest includes security and privacy in social networks, image processing, data mining, machine learning, Big data, and high performance computing.