© 2018, IRJET | Impact Factor value: 6.171 | ISO 9001:2008 Certified Journal | Page 3069
BIM based 3D Model for Construction Waste Quantification
Varsha Ashokkumar
1, Prof. Shibi Varghese
21
Student Dept. of Civil Engineering, Mar Athanasius college of Engineering, Kerala, India.
2Prof. Dept. of Civil Engineering, Mar Athanasius college of Engineering, Kerala, India.
---***---Abstract
- There is a lively debate on the application ofBuilding Information Modeling (BIM) to construction waste management (CWM). BIM can be utilized as a less expensive, virtual, and computational environment to enable designers to ponder different design options, or contractors to evaluate different construction schemes, both with a view to minimizing construction waste generation. However, existing debate on this topic too frequently treats BIM as a cure-all silver bullet; without some major hurdles being adequately addressed, the applications of BIM will remain rhetorical. This paper aims to demystify BIM's computational application to CWM waste quantification. Based on a critical literature review, a prototypical framework of a computational 3D BIM model for CWM waste quantification is developed in Revit environment, within which the waste generation level was introduced after a questionnaire survey. Then, the paper details the waste quantification of an ongoing construction project through a 3D BIM model. This thesis further presents a waste quantification method in comparison with the conventional estimation methods.
Key Words
:
Building Information Modelling,Construction waste management, 3D BIM Model
1. INTRODUCTION
Quantification in construction waste in both design and construction stage is a pressing need in many countries. Waste generation can be due to various factors like time, cost, environmental factors etc. According to lean thinking cost is considered as a waste. Improper quantification of materials for a project leads to wastage in terms of cost. The design of building elements is considered a pivotal process to achieve waste reduction at source, which enables an informed prediction of their wastage reduction levels. However the lack of quantitative methods linking design strategies to waste reduction hinders designing out waste practice in building projects. Therefore, this thesis addresses the knowledge gap through the design and evaluation of a Building Design Waste Quantification Strategies model that aims to investigate the relationships between design variables and their impact on both design and onsite waste optimization. The knowledge provided by the model could help project stakeholders to better understand the correlation between the design process and waste sources and subsequently implement design practices for low-waste buildings.
Within the context of this thesis ‘design waste (DW)’ is defined as construction waste in terms of cost that could be avoided during the design and construction stage. Design is a
key stage of a project life cycle to identify and adopt specific waste minimization actions that could be implemented throughout the construction phase. 33% of on-site waste is due to architects’ failure to implement waste reduction measures during design stages. Uninformed design decisions such as inadequate dimensional coordination during the design stage tend to generate off-cuts, which were identified as a major waste cause. BIM based 3D modeling for construction waste quantification enables to coordinate the changes made in both architectural and structural component with the amount of waste generated in terms of cost.
Various techniques for waste optimization were studied and the chosen one for this thesis is BIM based modeling. In India, many of the constructions do not give importance to waste optimization. Motivation in doing this project is to integrate the cost optimization for both design and construction phase in the construction of a 3 storied building with a single BIM model.
1.1 Rationale
The time, quality and cost are three important but contradictive objectives in an ordinary building construction project. It is a tough challenge for project managers to optimize them. While optimizing any two of the three objectives, the remaining one yields.
• Constructing something quickly and to a high quality, but it will not be cheap.
• Constructing something quickly and cheaply, but will not be of high quality.
• Constructing something with high quality and cheaply, but it will take a longer time.
Since this thesis studies only the construction waste optimization, cost is the only factor which has been considered. It is also made sure that the quality and time are not being affected while optimizing cost.
2. SIGNIFICANT CAUSES OF WASTE GENERATION
© 2018, IRJET | Impact Factor value: 6.171 | ISO 9001:2008 Certified Journal | Page 3070 stage tend to generate off-cuts, which were identified as a
major waste cause. Similarly, lack of information on drawings, complexity of detailing, selection of low-quality materials and lack of familiarity of alternative products as the most significant causes of waste.
Last minute design changes, which result in rework and partial demolition is another significant Design Waste (DW) cause. This was attributed to various design related inefficiencies, including errors in specifications and contract documents, last minute client requirements and the complexity of detailing drawings or changes in the type or quantity of building materials required at later stages. A recent study categorized causes of design errors into three types:
Illogical design such as clashes between different building elements as well as drafting errors. Discrepancies between drawings.
Missing datas.
These causes could be addressed through an integrated building design that can avoid design changes, thereby reducing onsite construction waste generation.
3. NEED FOR WASTE QUANTIFICATION
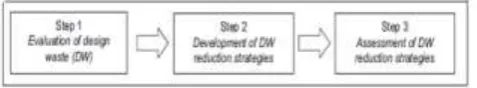
Waste estimation tools provide the essential basis for understanding causes, types and quantities of construction waste arising from building designs. Prior knowledge of waste in a project will enable assessment of their management possibilities, including the waste prevention. Figure 1 indicates the methodological overview of waste minimization model.
Fig -1: Methodological overview of waste optimization model
3.1 Prediction of waste disposal charges
The mixed construction waste accounted for about 26% by weight of the total waste intake in the construction industry. Along with the conventional quantification process, the charges associated with the waste disposal can also be incorporated. But manually doing the same is a time consuming process. To perform the same various waste estimation tools can be used effectively. The waste estimation tool used for this study is a BIM based 3D model.
3.2 Recycling practices
Recycling and sustainable use of resources are increasingly promoted in construction activities, and efforts have particularly been made in recycling materials such as
concrete, timber and steel. Materials such as steel, wood, and paper are commonly recycled while concrete and soil are commonly reused. Glass and plastics often have a low recycling and reuse rate. However, the recycling and reuse rate varies from site to site and from contractor to contractor. Researchers found that lengthy demolition period is one of the major barriers for increasing recycling rate since it is time consuming for contractors to carry on recycling practices. Lack of detailed information such as material type and material volume when planning for recycling will lead to a waste of time and money for both contractors and recyclers during demolition and renovation period.
3.3 Pick-up truck estimation
No specific pick-up schedule is used for waste pick-up in the construction industry. Instead, contractors will try to use their own experience to estimate the number of trucks and the interval for picking up the waste. If contractors underestimate the number of trucks and attempt to load all the waste to the trucks, warning letter will be sent to the contractors and the pick-up truck companies for overloading. Penalty will be charged to them. On the contrary, overestimating the trips of trucks with waste will cause a waste of space on site and a waste of money to the contractors.
3.4 Urgent need for a waste estimation tool
As discussed above, the current waste management practices have different limitations. Pre-estimation and planning of demolition waste are therefore needed.
If adequate decisions are to be made on how construction waste should be reused, recycled or disposed, hard data on the amount, type, time, and place of their generation is essential. In view of the need, this study developed a tool for estimation and planning of waste leveraging the BIM technology, which will be presented in the upcoming chapters.
4. PROTOTYPICAL FRAMEWORK OF BIM MODEL
[image:2.595.37.276.497.541.2]© 2018, IRJET | Impact Factor value: 6.171 | ISO 9001:2008 Certified Journal | Page 3071 Fig -2: BIM based prototype framework
In the BIM environment, a construction planner ponders different construction schemes, each is linked to a database indicating the most updated, average waste generation levels expected from that scheme. For example, the planner can evaluate whether timber or metal formwork should be selected, given the required criteria such as buildability, cost, time, quality standard, and waste minimization. In real-life design and construction practice, construction waste minimization will rarely be singled out but considered in conjunction with the criteria such as time, cost, quality, safety, sustainability, and so on.
In BIM, all these design and construction evaluations are undertaken in a virtual environment and can be analyzed for trade-offs and marginal benefits and costs in alternative denominations including money, time, energy and waste. All related design and construction documentations, including quantity take-offs, counts, and measurements, are automatically updated if any changes are made to the BIM design.
5. BIM BASED WASTE ESTIMATION AND PLANNING
SYSTEM
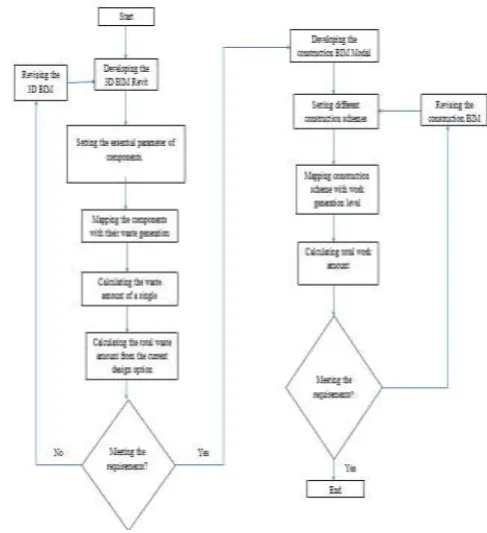
BIM represents the process of development and use of a digital computer building model to simulate and manage the planning, design, construction, and operation of a building facility. The resulting building information model is a data-rich, object-based, intelligent, and parametric digital representation of the facility. To create a BIM model, BIM software is needed. There are currently several companies providing software for BIM such as Autodesk, Bentley Systems, Nemetschek and Graphisoft. For this study, Autodesk Revit Structure is used to demonstrate the creation of a 3D BIM model. The Revit environment allows users to manipulate whole building. The flowchart for developing the 3D BIM model in Revit environment for measuring waste generation at design and construction stage is illustrated using a flowchart in figure 3.
Fig -3: BIM based waste estimation and planning system
6. SYSTEMATIC WASTE QUANTIFICATION USING
3D BIM MODEL
A commercial building with 5 storey’s (Ground + 4 storey’s) is used for development of waste quantification process. Material specification used includes concrete of M20 mix, coarse aggregate of 20mm nominal size, laterite stone of 20x20x35. Waste quantification using 3D model includes the following stages:
Data Analysis
BIM based estimation Developing 3D model
Inputting waste generation properties Calculating waste amount
Comparison
The quantification process of the building was done through conventional estimation and both the design and construction waste quantity was not been considered. Hence the waste generation level cannot be identified from the estimation process. Since the building is an existing one, the construction waste was not being studied. The design waste generation level was incorporated by using a questionnaire survey. Thus the waste generation level was identified and added on with the existing quantification of elements. The final quantity in terms of cost of all the elements was known from the final estimate. This final amount was compared with the total design waste amount from the 3D BIM model. The final values were comparable with very slight variation which proves that 3D BIM model is effective.
BIM Model
Planning
Design
Construction
Quantity Take Off Phase Planning (3D
Simulation
)
Design Review
3D Coordination (Clash Detection
)
[image:3.595.307.551.103.370.2]© 2018, IRJET | Impact Factor value: 6.171 | ISO 9001:2008 Certified Journal | Page 3072
7. DEVELOPING 3D BIM MODEL
The first step is to develop the building information model. Unlike traditional methods that use lines, points, and arcs to draw the building components, a designer directly uses 3D digital objects to create the model in commercial BIM software, Revit 2017. Each of the objects, regardless of being provided by BIM software, developed by the designer himself/herself, or exported from a third-part library, has various parameters such as length, area, thickness, volume, offset, level, and slope. The parameters have initial values, which can be modified and changed. Before moving forward to the second step, an important issue is to check and revise the name and type of the object, which lays the foundation for mapping the component with its waste generation level. The third step is to calculate the amount of waste and present the results. BIM can automatically measure the quantity of each component. Depending on the type of the building object, the quantity can be presented by area, volume, or piece.
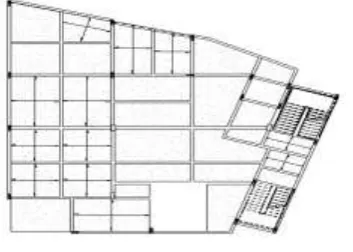
7.1 Creating floor plan
The initial step of 3D BIM modeling is the creation of floor plan. Floor plan is being created using 2D objects which are the structural components of the model. This gives knowledge about the entire area of the building. Figure 4 shows the typical floor plan of the commercial building used for this thesis.
The model created is known as the Design Model. Developer of each distinct model can work and update his or her own files and are responsible for dimensional accuracy of model. Distinct models can be linked to each other to form a federated model. The federated model can be used for many purposes including clash detection, marketing and facility maintenance purposes.
7.2 Creating 3D model
Unlike traditional methods that use lines, points, and arcs to draw the building components, a designer directly uses 3D digital objects to create the model in commercial BIM software, Revit 2017. This is often referred to as the Construction Model. The Construction Model studied in this project is shown in figure 5. The creation of an element on a view such as floor plan translated correctly to a different
Fig -4: Typical floor plan of BIM model
view such as elevation view. This saved a lot of time in comparison to if the design were drawn in traditional 2D view. Furthermore, the parametric modeling detected the conflicts of elements. The use of this feature eliminated the duplication or overlapping of elements. Also, there were no errors, omissions or conflicts of information at different views. BIM-based 3D control and planning can decrease the number of layout errors by integrating a BIM model with real world coordinates, thereby reducing the amount of rework because the precise control points are received directly from BIM models. Before moving forward to the next step, an important issue is to check and revise the name and type of the object, which lays the foundation for mapping the component with its waste generation level.
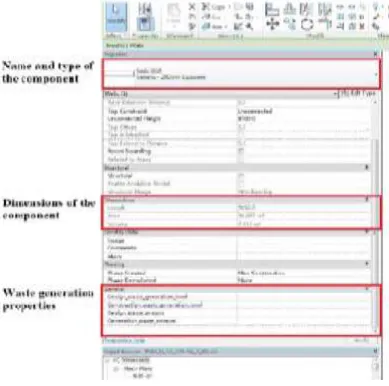
7.3 Inputting waste generation property
[image:4.595.75.252.627.753.2]© 2018, IRJET | Impact Factor value: 6.171 | ISO 9001:2008 Certified Journal | Page 3073 Fig -5: 3D BIM model
The waste generation level or the waste generation index does not have a standard value. This thesis utilizes the waste generation rates derived from different projects through a questionnaire survey. This helps in providing information regarding the waste generation levels for benchmarking the effectiveness waste management practices. The optimal technologies and work procedure can be selected by comparing the waste generation rates. Monitoring this waste quantification level can help to achieve an effective waste management practice for both the design and construction stage.
Waste index or waste generation level is a factor that is not being standardized in any of the Codes of construction management. This factor can be finalized only from experience. In this study a questionnaire survey is done to approximate the value in percentage. Survey was done with interviewing with the estimation department and site managers of various construction firms and with different completed projects. Since this study is made for commercial building, grouping was done on the questionnaire survey to obtain the waste index for commercial buildings. Parameters being considered for the survey involve the following:
Fig -6: Addition of waste generation properties
Variation from initial to final estimate or quantities Variation of individual structural components Major components affected by variation Miscellaneous factors
Questionnaire survey was done with 20 different construction firms by interviewing the estimation officer and site manager. Since the study is of commercial building, different waste generation levels were sorted separately. The results obtained from the survey are represented graphically in figure 7 and 8 and the linear variation is accepted as the standard waste generation level.
Fig -7: Variation of initial and final estimate
[image:5.595.56.268.79.239.2]From the questionnaire survey it was observed that the variation limits to the range of 5%. Thus for the calculation of waste generation amount in 3D BIM model 5% was considered as the waste generation level. Similarly, the variation of different structural components (beam, column, slab) were also surveyed and is represented graphically.
Fig -8: Variation of initial and final estimate of various structural components
From the survey it is identified that the percentage variation of different structural components is as follows:
[image:5.595.309.560.233.385.2] [image:5.595.308.560.499.656.2] [image:5.595.66.261.538.731.2]© 2018, IRJET | Impact Factor value: 6.171 | ISO 9001:2008 Certified Journal | Page 3074 Stair – 2%
Foundation – 4%
Miscellaneous items – 3%
The above mentioned values are used to calculate the total waste generation amount of the commercial building used to do the waste quantification process.
7.4 Calculation of waste amount
BIM can automatically measure the quantity of each component. Depending on the type of the building object, the quantity can be presented by area, volume, or piece. Waste generation for a component can be calculated using the BIM model utilizing the following equation:
WDi = QDi x LDi
Where, WDi is the waste generation amount of any structural or architectural component
QDi is the waste quantity of component
LDi is the waste generation level
Finally, the project manager can review the waste generation in BIM software, and find which component in a certain design option causes a large amount of waste. Based on the waste generation and other criteria, the manager will decide whether the original design should be improved. If the design is modified, the above steps will be repeated to calculate the latest waste generation. The whole process can be swiftly reiterated in the BIM environment without involving a large amount of resources.
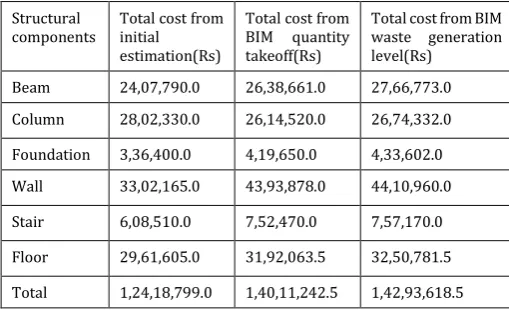
8. COMPARISON OF 3D BIM MODEL AND
CONVENTIONAL QUANTIFICATION METHOD
Structural
components Total cost from initial estimation(Rs)
Total cost from BIM quantity takeoff(Rs)
Total cost from BIM waste generation level(Rs)
Beam 24,07,790.0 26,38,661.0 27,66,773.0
Column 28,02,330.0 26,14,520.0 26,74,332.0
Foundation 3,36,400.0 4,19,650.0 4,33,602.0
Wall 33,02,165.0 43,93,878.0 44,10,960.0
Stair 6,08,510.0 7,52,470.0 7,57,170.0
Floor 29,61,605.0 31,92,063.5 32,50,781.5
Total 1,24,18,799.0 1,40,11,242.5 1,42,93,618.5
The variation in the final values obtained from 3D BIM model was converted to percentage value using the following equation:
The percentage value obtained from questionnaire survey turns to be acceptable since the waste generation level obtained from BIM is 2% which is 5%. Hence this value can be further adopted for the ongoing projects to estimate the waste generation amount using 3D BIM model.
9. 3D BIM MODEL FOR WASTE QUANTIFICATION OF
A CONSTRUCTION PROJECT: A CASE STUDY
[image:6.595.40.295.513.668.2]The waste quantification method was incorporated to an ongoing project using 3D BIM model. The main aim of the process was to quantify the onsite waste generation level by monitoring the quantity of variation of structural elements of the project. Estimation of various quantities were available in the project whereas the waste quantification was absent for the same. Developing BIM model helps to know the original variation of the material quantities. The construction project studied for the thesis is a commercial building of 3232.3 sq.ft shown in figure 9.
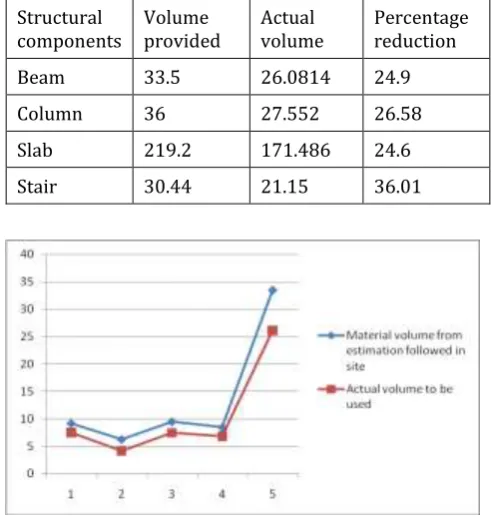
© 2018, IRJET | Impact Factor value: 6.171 | ISO 9001:2008 Certified Journal | Page 3075 9.1 Result analysis
Structural
[image:7.595.310.558.46.236.2]components Volume provided Actual volume Percentage reduction Beam 33.5 26.0814 24.9 Column 36 27.552 26.58 Slab 219.2 171.486 24.6 Stair 30.44 21.15 36.01
Fig -10: Variation between actual volume and provided volume of bea
[image:7.595.40.286.104.363.2]Fig -11: Variation between actual volume and provided volume of column
[image:7.595.41.283.402.548.2]Fig -12: Variation between actual volume and provided volume of slab
Fig -13: Variation between actual volume and provided volume of stair
The inference made from the waste generation analysis is the following:
The minimum waste generation is being observed in slab and maximum for stair.
Beam and column showed almost the same waste generation level.
The abrupt changes in the waste generation amount for stair and slab indicates that the conventional quantity estimation was not accurate.
The obtained waste amount for:
a. Beam = 7.4186 m3 b. Column = 0.972 m3 c. Slab = 47.714 m3 d. Stair = 9.29 m3
Thus 25% waste reduction can be achieved by using BIM quantification.
10. CONCLUSIONS
[image:7.595.42.280.583.732.2]© 2018, IRJET | Impact Factor value: 6.171 | ISO 9001:2008 Certified Journal | Page 3076 was formulated for an ongoing construction project. The
model developed could provide a better quantification of materials used on site and the amount of waste generated. Thus BIM can develop finer scales of categories in the reporting of waste generation rates.
From this study it is concluded that:
BIM can be used effectively for waste quantification.
25% waste reduction can be achieved by using BIM 3D waste quantification.
REFERENCES
[1] Abdulsame Fazlia, Sajad Fathia, Mohammad Hadi Enferadi, Mayram Fazlib, Behrooz Fathic, 2014 “Appraising effectiveness of Building Information Management (BIM) in project management” , 1116-1125.
[2] C. Llatas and M. Osmani, 2016 “Development and validation of a building design waste reduction model”, Journal of waste management
[3] Jack C.P. Cheng, Lauren Y.H. Ma, 2013 “A BIM-based system for demolition and renovation waste estimation and planning”, Journal of waste management, 1539-1551.
[4] J. Won and J.C.P. Cheng, 2017 “Identifying potential opportunities of building information modeling for construction and demolition waste management and minimization”, Journal of automation in construction.
[5] Maggie Khaddaj and Issam Srour, 2016 “Using BIM to Retrofit Existing Buildings” , Journal of automation in construction, 1526-1533
[6] Weisheng Lua, Chris Websterb, Ke Chena, Xiaoling Zhangc and Xi Chena, 2017 “Computational Building Information Modelling for construction waste management: Moving from rhetoric to reality”, Journal for renewable and sustainable energy, 587-595.
[7] Yan Liu , Sander van Nederveen, Marcel Hertogh, 2016 “Understanding effects of BIM on collaborative design and construction”, International Journal of waste management, 1-13
[8] Zezhou Wu, Ann T.W. Yu , Liyin Shen and Guiwen Liu,2014 “Quantifying construction and demolition waste”, Journal of waste management.