Munich Personal RePEc Archive
Skills development and competitiveness
-the role of HRD
Mohammad, Irfan
Pakistan Instittute of Development Economics Islamabad Pakistan
1999
SKILLS DEVELOPMENT AND COMPETITIVENESS
- THE ROLE OF HRD
By
Mohammad Irfan
Pakistan Institute of Development Economics
Islamabad
CONTENTS
Chapter 1: The Technical Education and Vocational Training System 1
Introduction 1
The Technical Education and Vocational Training System 2
Technical Education 3
Flow Chart of General Education and TEVT System 4
Vocational Training Programmes 5
National Training Board (NTB) 7
Employability 9
Apprenticeship Scheme 9
Vocational Training for Women 10
Informal Training (Ustad/Shagird) 12
Chapter 2: Availability and Use of Skills – Evidence Based on Household Survey 14
The Supply of Skills/Training 14
Duration of Training 16
Labour Force Participation 17
Employment Structure 18
Training and the Earnings 20
Unemployment and Skill Training 22
Chapter 3: Involving Private Sector - Some Initiative 23
Skill Development Council 24
Punjab Vocational Training Council (PVTC) 25
Chapter 4: Some Case Studies 28
Institute of Leather Technology, Gujranwala 28
Pak-German Wood Working Centre, Peshawar 29
Metal Industries Development Centre (MIDC) Sialkot 31
Chapter 5: Competitiveness HRD, and Future Challenges 32
Technological Capacity 34
Productivity Trends 35
Unit Labour Cost 36
Revealed Comparative Advantage (RCA) 39
Trade Liberalisation 40
Employment Implication of Trade Liberalisation 42
Figure 45
Italian Clothing Industry 46
Chapter 6: Summary and Recommendations 47
Summary 47
Recommendations 50
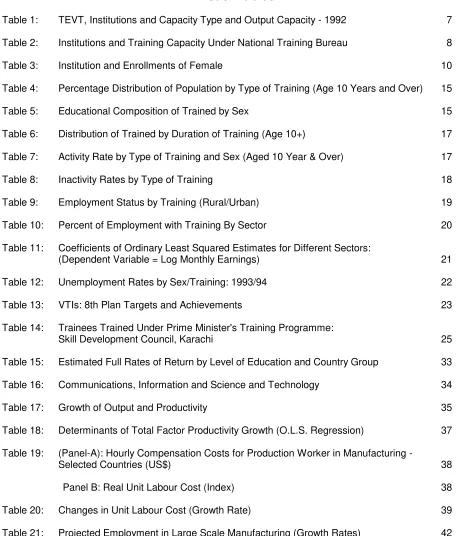
List of Tables
Table 1: TEVT, Institutions and Capacity Type and Output Capacity - 1992 7
Table 2: Institutions and Training Capacity Under National Training Bureau 8
Table 3: Institution and Enrollments of Female 10
Table 4: Percentage Distribution of Population by Type of Training (Age 10 Years and Over) 15
Table 5: Educational Composition of Trained by Sex 15
Table 6: Distribution of Trained by Duration of Training (Age 10+) 17
Table 7: Activity Rate by Type of Training and Sex (Aged 10 Year & Over) 17
Table 8: Inactivity Rates by Type of Training 18
Table 9: Employment Status by Training (Rural/Urban) 19
Table 10: Percent of Employment with Training By Sector 20
Table 11: Coefficients of Ordinary Least Squared Estimates for Different Sectors:
(Dependent Variable = Log Monthly Earnings) 21
Table 12: Unemployment Rates by Sex/Training: 1993/94 22
Table 13: VTIs: 8th Plan Targets and Achievements 23
Table 14: Trainees Trained Under Prime Minister's Training Programme:
Skill Development Council, Karachi 25
Table 15: Estimated Full Rates of Return by Level of Education and Country Group 33
Table 16: Communications, Information and Science and Technology 34
Table 17: Growth of Output and Productivity 35
Table 18: Determinants of Total Factor Productivity Growth (O.L.S. Regression) 37
Table 19: (Panel-A): Hourly Compensation Costs for Production Worker in Manufacturing -
Selected Countries (US$) 38
[image:4.612.70.530.95.631.2]Panel B: Real Unit Labour Cost (Index) 38
Table 20: Changes in Unit Labour Cost (Growth Rate) 39
List of Appendix Tables
Appendix Table 1: Number of Secondary Vocational Institutions by Type 59
Appendix Table 2: List of Technical Training Courses Being Provided by NTB 60
Appendix Table 3: Course-wise Detail of Trainees Completed Training
(Youth Training Programme SDC, Karachi) 61
Appendix Table 4: Course-wise Detail of Trainees Undergoing Training
(Youth Training Programme SDC, Karachi) 62
Appendix Table 5: Protection and Efficiency in the Manufacturing Industries of Pakistan 63
Appendix Table 6: Unemployment and Underemployment Rates, 1968/69 to 1996/97 65
CHAPTER 1
THE TECHNICAL EDUCATION AND VOCATIONAL TRAINING SYSTEM
Introduction
This study reflects an attempt to document the existing state of affairs in the fields of Technical Education and Vocational Training (TEVT) in Pakistan. Relationships between competitiveness and labour market performance, the level of skills and pattern of industrialisation are examined. Future challenges under globalisation and their likely impact on employment generation and skill needs is also dealt at length.
The first chapter of the study sketches out the existing system of TEVT, in terms of institutions, output and various trades which are being focussed upon by the system. Administrative set-up and the coordination mechanism is also briefly touched upon. Employability of the output produced by these institutions is discussed too.
Using the Household Income and Expenditure Survey (HIES) of 1993/94, the size of the trained labour force is estimated and its pattern of employment by rural/urban and informal/formal is provided in the second chapter. The information of the survey is also utilised to assess the impact of training on the earnings of the individuals. In addition the influence of training on employability of trainee is examined.
The third chapter contains discussion on recent initiatives of the government to enlist the participation of private sector in the TEVT System. The Skill Development Councils and their role is described. In addition the Government of Punjab's effort to expand technical and vocational education are discussed.
The fourth chapter comprises of few case studies of the existing training institutions. Their influence on different aspects of industrial development of the area as well as meeting the skills need is described. These case studies pertain to Institute of Leather Technology Gujranwala, Pak-German Wood Working Centre Peshawar, and Metal Industrial Development Centre Sialkot.
an idea about the products where Pakistan enjoys comparative advantage. Estimates pertaining to the possible effects of globalisation under WTO and post MFA scenario on employment generation are also presented.
Final chapter while summarizing the study attempts to identify the major challenges facing the Pakistan's economy. The needed HRD efforts to address some of the issues are outlined. Questions regarding the design of the training policy, the existing institutional weaknesses are addressed too.
THE TECHNICAL EDUCATION AND VOCATIONAL TRAINING SYSTEM
The existing TEVT System juxtaposed with the General Education System is provided in the chart. Broadly the TEVT System can be classified into (a) Formal or Institutional and (b) Informal depicted in the chart as OJT (on the job training) at the bottom under TEVT. It may be noted that this segment of TEVT appears to be the major source of skill training as described in the sections to follow.
The chart indicates the years of schooling for different levels of education, for primary it is 5 years and so on. Broadly, primary, middle, secondary, intermediate, degree, post graduates (such as M.Sc.) and in some fields the Doctorate (Ph.D) constitute different levels of general education in Pakistan. The allocation of students to science and arts subjects in colleges is generally made after matriculation (10 years of schooling). Entry into professional education is based on the student's performance at intermediate level. However for vocational education and training mostly the entry level qualification is matric or middle, with the exception of diploma in computer or some other specified courses where intermediate level qualification is required for entry.
Certain broad features of TEVT System and its inter-linkages with general education are worth mentioning.
1. In contradistinction to general education which permits rise up the education ladder (from F.Sc to M.Sc, Ph.D and professional degrees) most of the certificate level and diploma courses offered in TEVT System are terminal. Hence for the latter (the blue collar) it offers a carrier path permitting little upward mobility as well as denying the system achieve vertical depth in skilling.
2. The entire TEVT System almost exhausts its requirement from general educational structure upto the intermediate level. Thus any improvement in quality of the tertiary education will not get automatically reflected in the quality of TEVT product.
The administrative set up with a distinction between Ministry of Education exclusively concerned with Technical Education, and some of the vocational training programmes and the remaining Ministries/Departments is discussed below. In addition effort is made to discuss technical education separately from vocational.
(A) Technical Education
FLOW CHART OF GENERAL EDUCATION AND TEVT SYSTEM
│
General Education │ Technical and Vocational Education │ and Training System
│
Years of │ Schooling │
│ │ -│ o Ph.D. │ │ │ │ │ │ │
-│ │- o B. Tech. (Hons) output ┌──────────────┐ │ │ M.Sc │ as Technologist │ Training │ │ │ MBBS │ │ under MOE │ 16-│ o MA o M. Com o MSC │ │ in colleges │ │ │ │ │ │ │ │ of technolo- │ │ │ │ │ │ │ │ gies poly- │ -│ │ -│ │ │ oB. Tech. │ technics and │ │ │ │ │ oB.E │ │ commercial │ │ │ │ │ │ │ ┌─Output as Technician │ institutes │ 14-│ o BA oB.Com │ │BCS-│ │ in Commerce │ and private │ │ │ │ ┌─---o--- │ sector │ │ │ │ │ │ ├─────────── Diploma in Computer│ │ -│ │ -│ │ │ │ o DAE output as │ │ │ │ │ │ │ │ │ Technician │ │ │ │ │ │ │ │ │ └──────────────┘ 12-│ o----o--<---o-->---o──┘ │- o Voc: output ┌──────────────┐ │ │ FA │I. │D. │F.Sc. │ │ as tradesman ────┤ Training │ │ │ │Com. │Com │ │ │ │ mostly by │ -│ │ │- o │- │- o Voc: output │ GVI's & TTC │ │ │ │ │C. │ │ │ as tradesman │ Institutes │ │ │ │ │Com. │ │ │ │ under │ 10-├──────┴────┴──────┴──────┴───────┴──────┘ o Voc: output │ various │ │ │ as workman──┤ organizations│ │ Secondary School Certificate (Matric) │ │ │ │ (Covering Agro-Tech: Courses in some School) o` Voc: Output │ │ │ │ as workman └──────────────┘ │ │ ┌──────────────┐ 8-├──────────────────────────────────────────────┘ │Apprenticeship│ │ Middle School Certificate └──────────────┘ │ (Covering Industrial Arts Courses as well)
5
The products of the polytechnics in principal should be equipped with (i) skill in industrial processes (ii) an understanding of the principals underlying these processes and (iii) experience in handling the industrial worker. It is because of these important attributes of this type of training that the National Education Policy (NEP in 1992) suggested expansion in polytechnics from 45 in 1990-91 to 95 in year 2002 and colleges of technology from 11 to 22 during the same period. The draft report on Education submitted by working group for Ninth Five Year Plan (1998-2003) recommended establishment of new institutions to meet the increasing demands of the technical education. Also it was suggested in the said report that courses in modern technologies such as (i) automation (ii) computer hardware and software (iii) electronic publication (iv) environmental control and (v) textile dyeing and finishing be offered.
Lack of qualified teachers, outdated curricula, and little interaction with industry and world of work are allegedly some of the weaknesses of technical education. Furthermore the overall resource crunch faced by economy during 1990's has severely constrained the non-salary component of the recurrent expenditure thereby negatively influencing the quality of training being imparted.
Employability and productivity enhancing effects of Technical Education provided in polytechnics has not been assessed during the past decade or so. Khawaja et.al (13) examined the employment status of polytechnic graduates of 1985/87 through a survey of 545 graduates, 14 principals and 25 employers. It was found that 50% of the graduates of 1985/87 were unemployed as on May, 1988 (the time of survey). The employment of polytechnic graduate was relatively higher in the government services than in the private sector. The institutions were found suffering from inadequate library and laboratory facilities. Employers according to the study regarded the curricula to be inadequate for jobs.
(B) Vocational Training Programmes
Various ministries and departments in addition to private initiatives are engaged in the provision of vocational training. The number of institutions and the capacity of output attributable to different agencies is provided in Table 1 for the year 1992. As revealed by the table major actors in the field of vocational training are:
(1) The provincial education departments which administer the Government Vocational Institutes (GVI).
Training Ordinance of 1962 also fall under the administration of provincial departments of manpower and training. Apprenticeship training is provided at the establishments employing 50 or more workers.
(3) Training programmes undertaken by other organisations such as Social Welfare Departments, Small Industries Corporations, Agency for Barani Area Development, Overseas Pakistanis Foundation (OPF) etc.
Table 1
TEVT, Institutions and Capacity: Type and Output Capacity - 1992
Certification Duration 1991-92 No. of Insti-tutes
Output
ORGANISATION
(a) Directorate of Technical Education
1. Polytechnic and Colleges D.A.E and 3 Years 62 35700
of Technology B. Tech. (9)
2. Commercial Training I.Com. 1 Year 189 28500
Institutes D. Com. 2 Years
3. Govt. Vocational Certificate 185 13000
Institutes (165) (9000)
(b) Directorate of Manpower and Training (Labour)
1. T.T.C. and G.V.Is 73 11600
(c) Dte. of Social Welfare 2467 68200
(415) (6200)
(d) Small Industries Corporation 306 9500
(e) Agriculture ABAD etc. 54 3170
(f) Industries 5 240
(g) ILO/UNHCR 12 640
(h) OPF 6 400
(i) Staff Welfare Organisation 14 1260
(j) Staff Railway, WAPDA, T&T etc. 43 11350
(k) Paramedical Staff Training 7 160
Total Institutions 3172 119520
Informal (guesstimated) 120000
Source: Ministry of Education, GOP and Asian Development Bank, Manila (1992) "Technical Education and Vocational Training in Pakistan.
( ) report the female share.
National Training Board (NTB)
Very little is documented about the actual performance of NTB in relation to mandated functions. Also the required technical competence of the members of NTB as well as its secretariat to undertake evaluation or regulation of training system in the country is not explicitly laid down. The policy focus of NTB has been the government vocational and technical training programmes which itself has hardly undergone any substantial change since the inception of NTB. More recently however, efforts have been to enlist the participation of private sector and to expand training activities to informal sector enterprises.
Currently National Training Bureau administers around 40 training courses. Majority of these courses specify entry qualification as matric with 12 to 24 months duration. The details are provided in Appendix Table 2. The numbers of the institutions directly operating under National Training Bureau and provincial manpower and training departments is depicted below in the Table 2.
Table 2
Institutions and Training Capacity Under National Training Bureau
Province Institutions Capacity
Federal: Islamabad 1 376
Punjab 31 9406
Sindh 24 5052
NWFP 19 2734
Baluchistan 9 1123
Total 84 17691
Source: A Handbook on Manpower and Employment in Pakistan, 1998.
It may be noted that training capacity does not automatically get converted into enrollments. Very little is known about capacity utilisation of these institutions. A study for instance estimated that enrollment was 64% of the capacity in early 1990s. (Semeiotics Consultants 1991, 1992).
Employability
These studies may have suffered from various procedural flaws but the overriding impression regarding the employability was hardly appealing. What happened during 1990's when overall unemployment level worsened remains a matter of speculation because hardly any tracer study has been conducted. Evidence based on HIES 1993/94 data is however provided in Chapter 2.
Apprenticeship Scheme
Currently the Apprenticeship Ordinance is applicable to the establishments employing 50 or more workers. In 1998 this training was being provided in 525 establishments with capacity to train 9400 persons, while actual enrollment remains unknown. At present 105 apprenticeable trades are notified by NTB. In addition some training also takes place outside the purview of the Apprenticeship Ordinance.
The provincial Labour Departments generally undertake the tracer studies to assess the employability of the output of Apprenticeship Scheme. Studies conducted by DMT Punjab for 1992, for instance yielded that 65% of the passouts were employed either by same employer (47%) or by other employers (17%). Six percent of the passouts got themselves self employed and 9% were jobless or unemployed. Around one fifths (20%) of apprentice, could not be traced.
Vocational Training for Women
[image:14.612.69.544.599.721.2]According to Economic survey of 1997-98 almost one half of secondary vocational institutions, with two fifths of the enrollment, serve the females. Vocational training facilities for women in trades such as tailoring/dress making, embroidery, secretarial trades, computer operator and food processing are available in 2800 institutions with estimated 76000 enrollment capacity. The institutions/embroidery centres established by NGOs, industrial homes of Social Welfare Departments are one of the major contributors in female training. Other institution such as DMT of Labour, Education, Small Industries Development Corporation, and ABAD are also engaged. The province-wise breakdown of institutions and capacity is the following:
Table 3
Institution and Enrollments of Female
Province No. of
Institutions Capacity
Punjab 1913 43200
Sindh 219 8517
Baluchistan 84 4865
Federal 11 730
Total 2894 76340
Evaluative research to assess the impact of this institutional training on employment or income generating capacity of the beneficiary is almost non-existing. Major findings of a study conducted during early 1990's by Raheela at IDS Peshawar are reproduced below.
The field survey covered, randomly selected 8 out of 100 vocational centres for women in the rural areas of three Tehsils of Peshawar District. It may be noted that these centres were established with an objective to improve the living conditions of the poverty striken females through provision of training which was expected to fetch them a job or better earning opportunities. The study entitled "Vocational Education for Women in Rural Areas of Peshawar District" focussed on (a) to ascertain the contribution of these training programmes to the economic conditions of the trainees (b) identification of factors impeding female participation and (c) to recommend the needed measures for improvement. Major findings of this study are summarized below.
1. Generally the skills imparted by these vocational training centres were hand/machine embroidery, tailoring and knitting. However the vocational centres did not sponsor courses in specific crafts for fixed duration.
2. Most of the centres were suffering from inadequate accommodation, often located in one room given by local village chairman or other influential person. Not only was there inadequate access to drinking water and other facilities but the space was also insufficient. Similarly poor conditions of machines, non-availability of funds for repair of machines and lack of furniture were found to be the major problem faced by these training centres.
3. Nearly two fifths of the teachers were having education level upto Middle, while 25% were intermediate and the remaining being matriculate. Most of the teachers had benefited from a pre-service training courses of very short duration (10-15 days). Interestingly the study did try to suggest an inverse association between the level of education and performance as a teacher. Most of the teachers were paid a very small amount as a salary ranging from Rs. 450 to 1000 per month at the time of survey.
5. The teachers viewed that the trainees did not get jobs after acquiring the training. Very small proportion of the trained may get job in other training centres. A large number of trainees got engaged in contract work from local people but with very meagre wages/earnings. On the average around Rs. 50 per month were estimated to be the income. In other words this training had limited impact on the economic conditions of the trainees. However with the improvement in the marketing facilities this income can be increased.
6. Overall the administrative structure was fragmented wherein Local Government, APWA and Social Welfare Department were engaged in the administration of these institutes.
Informal Training (Ustad/Shagird)1
Informal training under traditional ustad/shagird system accounts for majority of the trained work force in the country. However not much is known about this dominant system of training. Limited information available is based on surveys conducted to understand the workings of SSEs in general with focus on training aspect. Chaudhary (4) for instance examined skill generation and entrepreneurship development. The study was based on a survey of cities of Rawalpindi, Gujranwala, Sialkot, Daska, Mian Channu, Lahore and Karachi. Around, 2000 ustads and shagirds of equal proportion belonging to 24 trades were covered in the study. Major findings relating to skill generation are described below.
Most of the ustads/shagirds were moderately educated and had little, if any, formal training. Around 82% of ustads were self employed. The ustads generally acquired skills by working 2 to 4 years as shagird. An abundant supply of shagirds is generally available to ustads. Shagirds acquire skill in 3 to 5 years by working directly with ustads for 8 to 9 hours per day. The author regarded the training period to be unduly extended. The period of unpaid apprenticeship was reported to be around 2 years.
On the average there were 3 shagirds engaged per enterprise covered in the survey, however, the intake of young unskilled shagirds varied by the output and capacity utilisation of the enterprise. While shagirds joined the enterprise for learning the skills, ustads may have had different motives such as getting assistance in minor works, looking after the business in addition to transfer of skills. Given the fact that informal sector is a major source of employment, skill generation and entrepreneurship development, more information regarding different aspects is essential. The authors viewed that while new rules and regulations may turn out to be counterproductive because informal sector is a market driven phenomenon, however implementation of existing rules
regarding health standards, payment practices may reduce some of the violations.
CHAPTER 2
AVAILABILITY AND USE OF SKILLS - EVIDENCE BASED ON HOUSEHOLD SURVEY
The Supply of Skills/Training
Hardly has there been any research effort to quantify the stock or temporal flow of the supply of technical and vocational training in Pakistan. Such an important exercise has been simply precluded by lack of adequate data. The household surveys and 10 per cent count of population census record general educational levels of the population covered, with no distinction for technical and vocational education or training. Innovations introduced in Household Income and Expenditure Surveys (HIES) and Labour Force Surveys (LFS) during the 1990's do facilitate crude estimates of trained persons. The HIES having a larger sample size than LFS and also yielding a distinction between on the job training and institutional training is preferred over LFS for an attempt to estimate the proportion of trained persons in the population and in particular the labour force for the year 1993/94. Information in HIES on training is gathered separately on formal training with duration of training and a question related to on the job training. Unfortunately HIES data do not provide information pertaining to outcome of training in terms of certificate/diplomas. These have to be inferred from the general education level of the respondents.
The responses to these questions yield three categories (a) the respondent who reported only on the job training (b) those who reported OJT as well as duration of training (c) the ones who did not report on the job training but reported the duration of training. All those who reported on the job training but not duration presumably have been provided OJT by Informal Sector i.e. Ustad/Shagird System and the other two categories lumped together can be regarded as the product of institutional training. It is likely that training under apprenticeship being of fixed duration has been reported in this second category.
The skill base of the country as yielded by the HIES 1993/94 using this procedure is incredibly low. Only 5.1% of the population aged 10 years and above can be associated with technical and vocational training. The breakdown by sex and type of training is summarized below in Table 4.
Table 4
Percentage Distribution of Population by Type of Training (Age 10 Years and Over)
Both Sexes Male Female
1. Population Trained 5.1 6.6 3.4
(b)1 Formal(OJT+INST) 1.9 2.5 1.0
2. Population with no Training 94.9 93.4 96.6 Note: The table is based on raw data (unweighted) HIES 1993/94.
147% of this category has acquired both OJT as well as classroom training while
53% did not avail any OJT opportunity.
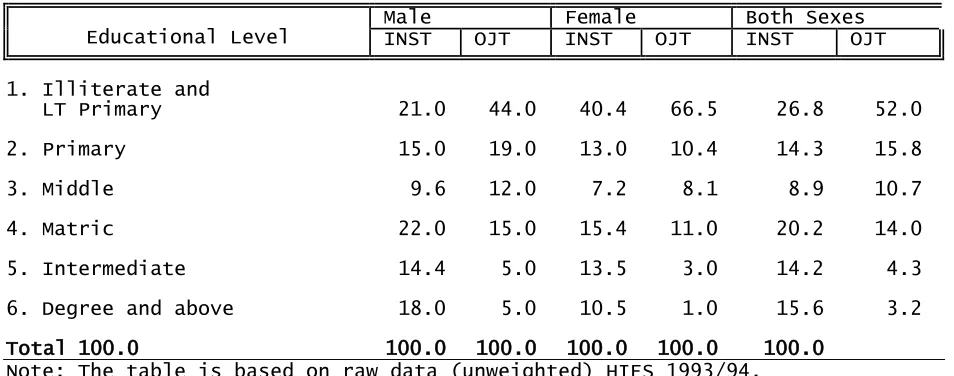
[image:19.612.69.546.296.484.2]Associated with this very low proportion of population (10 years and over) trained, another disturbing feature of the above table being the predominance (63%) of pure on the job training which with same stretch of imagination can be regarded as product of Ustad/Shagird informal training system. The educational composition of the trained by mode of training is produced below in Table 5.
Table 5
Educational Composition of Trained by Sex
Educational Level Male INST OJT Female INST OJT Both Sexes INST OJT
1. Illiterate and
LT Primary 21.0 44.0 40.4 66.5 26.8 52.0
2. Primary 15.0 19.0 13.0 10.4 14.3 15.8
3. Middle 9.6 12.0 7.2 8.1 8.9 10.7
4. Matric 22.0 15.0 15.4 11.0 20.2 14.0
5. Intermediate 14.4 5.0 13.5 3.0 14.2 4.3
6. Degree and above 18.0 5.0 10.5 1.0 15.6 3.2
Total 100.0 100.0 100.0 100.0 100.0 100.0
Note: The table is based on raw data (unweighted) HIES 1993/94.
embrace the illiterates and those with less than secondary school certificate, which according to 1996-97 LFS accounted for 85% of the population aged 10 and over.
Duration of Training
Table 6
Distribution of Trained by Duration of Training (Age 10+)
Category Less than
3 Months Months 4-6 Months 7-12 Over One Year Duration of Training Estimated Average (Months)
Both 30.2 12.8 23.7 33.2 9.2
Male 24.0 11.0 24.4 40.6 10.4
Female 45.9 17.2 22.0 14.8 6.2
Labour Force Participation
Activity rates exhibited by the (10 years and over) population reflected substantial differentials by those having a vocational training and those without. For instance 70% of those with training belonging to working age population, 10 years and over, were reported to be in labour force in contrast to 38.8% for the ones without any training. This edge of trained over untrained in labour force participation is shared both by males as well as females and increases the share of trained in the labour force to around 9%. (see table 7). Activity rates by type of training display an interesting pattern. While the male, who benefitted from OJT only, registered 94% activity rate in comparison to 86% for those who reported the duration of training. Female registered an opposite trend wherein the activity rates of the former (OJT) lag behind the latter. However it may be noted that the labour market participation is a product of diverse factors hence a careful interpretation of the above mentioned data is counselled.
Table 7
Activity Rate by Type of Training and Sex (Aged 10 Year & Over)
Population
All 10+ Training No Institutional and OJT (only) OJT Trained Total
Male 64.6 62.8 85.8 93.5 90.1
Female 12.0 11.5 34.4 20.0 24.5
Both 39.3 37.7 71.0 67.4 70.6
In general one finds a lower level of inactivity among those who benefited from training than without it. However, the differentials are relatively wider for males and graduate females than the illiterate females.
Table 8
Inactivity Rates by Type of Training
Educational Levels No Male Female
Training INST OJT Training No INST OJT
1. Illiterates 30.5 16.2 8.5 87.4 72.0 81.0
2. Degree 23.7 13.4 13.5 82.0 46.0 33.0
Source: Tabulations based on HIES 1993/94.
Employment Structure
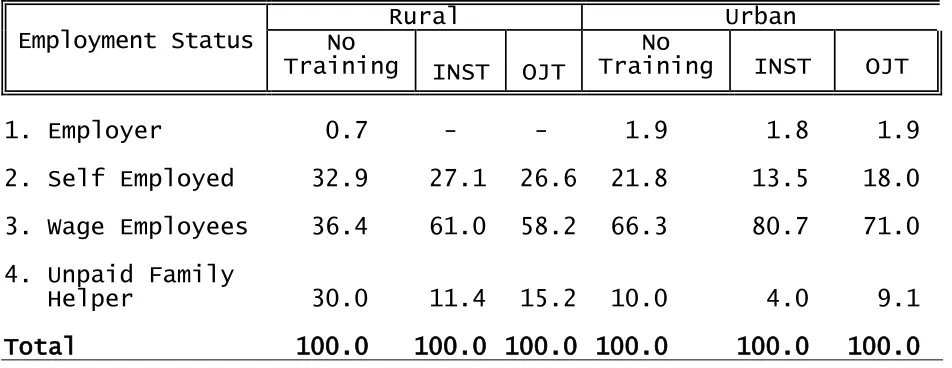
Table 9
Employment Status by Training (Rural/Urban)
Employment Status No Rural Urban
Training INST OJT Training No INST OJT
1. Employer 0.7 - - 1.9 1.8 1.9
2. Self Employed 32.9 27.1 26.6 21.8 13.5 18.0
3. Wage Employees 36.4 61.0 58.2 66.3 80.7 71.0
4. Unpaid Family
Helper 30.0 11.4 15.2 10.0 4.0 9.1
Total 100.0 100.0 100.0 100.0 100.0 100.0
A cross tabulation of employment status with mode of training indicates relative concentration of the trained as wage employee in comparison to untrained particularly in rural areas. The association gets reversed in case of self employment particularly in urban areas. Similarly a lower fraction of trained opts as unpaid family helper than the untrained. Focussing upon the two modes of training one finds that fraction of those who work as unpaid family helper is higher for pure OJT than their counterparts.
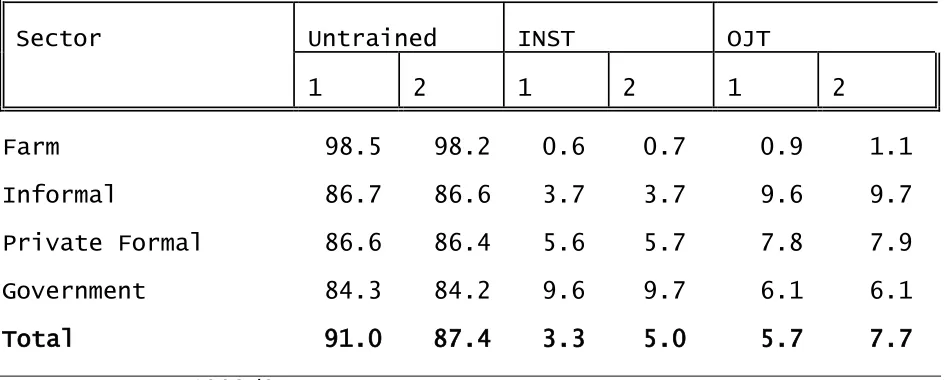
Table 10
Percent of Employment by Training By Sector
Sector Untrained INST OJT
1 2 1 2 1 2
Farm 98.5 98.2 0.6 0.7 0.9 1.1
Informal 86.7 86.6 3.7 3.7 9.6 9.7
Private Formal 86.6 86.4 5.6 5.7 7.8 7.9
Government 84.3 84.2 9.6 9.7 6.1 6.1
Total 91.0 87.4 3.3 5.0 5.7 7.7
Source: HIES 1993/94.
Note: Column 1 refers to total employment and column 2 to wage employment only.
While the above table is indicative of overall low intake of technical or vocationally trained person a disturbing result being that private formal sector fails to reflect edge over informal sector. In fact it is the public sector employment where fraction of trained is higher than the rest of the economy. This clearly fits in the characterisation of the economy by World Employment Report (7) "trapped in the low skill". Even if one looks upon the percentage distribution column No. 2 in the table above relating to wage employment the distribution hardly undergoes any perceptible change. The rural/urban dichotomy however does matter where the share of trained (INST and OJT) rises upto 15% in the wage employment of non-farm segments of urban economy.
Training and the Earnings
The impact of training on individual earnings is assessed by Nasir (23) using a multivariate regression framework for 1993/94 HIES data. It may be noted that the sub-set of wage employees in urban areas were covered in the analysis which also distinguishes between formal and informal sectors. The results are reproduced in the table 11 below.
Table 11
Coefficients of Ordinary Least Squared Estimates for Different Sectors
(Dependent Variable = Log Monthly Earnings)
Constant 6.6370*** 6.5650*** 5.4960***
(64.42) (38.31) (75.11)
AGE 0.0357*** 0.0371*** 0.0837***
(6.33) (4.73) (20.91)
AGESQ -0.00032*** -0.00036*** -0.00096***
(-4.54) (-3.95) (-19.69)
PRIMARY 0.000099 0.1190** 0.1350***
(0.003) (2.18) (5.91)
MIDDLE 0.0962** 0.2380*** 0.2060***
(2.53) (4.05) (6.93)
MATRIC 0.2450*** 0.3340*** 0.3210***
(8.57) (7.09) (12.40)
DEGREE 0.4870*** 0.6780*** 0.6770***
(14.25) (11.27) (11.62)
PDEG 0.6470*** 0.8210*** 0.7410***
(15.78) (11.21) (8.16)
TRAINING 0.0426* 0.0182 0.0534**
(1.80) (0.39) (2.21)
PROFESSIONAL 0.3150*** 0.3570*** 0.4240***
(7.28) (2.81) (4.11)
MANAGER 0.4470*** 0.5800*** 0.9680***
(10.98) (5.25) (11.48)
CLERK 0.0883*** 0.0967 0.0967*
(3.17) (0.91) (1.74)
SERVICES 0.0056 -0.1020 0.0846**
(0.18) (-0.96) (2.04)
LABOUR 0.0976*** -0.0410 0.1020***
(3.16) (-0.40) (2.64)
MS 0.0387 0.1710*** 0.2080***
(1.51) (3.41) (7.81)
F-statistics 129.93 87.66 176.25
R-2 0.5340 0.5930 0.4550
N 1576 833 2942
Source: Earning Differentials Between Public and Private Sectors in Pakistan by Zafar Mueen Nasir, PIDE (Mimeo), 1999.
***Significant at 1 percent level **Significant at 5 percent level *Significant at 10 percent level
The coefficient of training (INST and OJT) emerges significant in case of Public Sector and Informal Sector wage employees. The simple interpretation of the regression results being that controlling for characteristics of individuals such as age, education and occupations training acquired by a person leads to 5% higher level of wages in informal sector and 4.2% in the government employment. The coefficient of training failed to acquire significance in case of private formal sector employment.
Unemployment and Skill Training
[image:26.612.69.546.168.287.2]Unemployment levels yielded by HIES data by mode of training and sex are provided in the Table 12.
Table 12
Unemployment Rates by Sex/Training: 1993/94
Sex All Training No INST Training OJT
Male 2.5 2.6 2.2 1.3
Female 15.9 16.3 12.4 10.1
Both 4.4 4.6 3.7 2.2
Source: HIES, 1993/94.
CHAPTER 3
INVOLVING PRIVATE SECTOR - SOME INITIATIVES
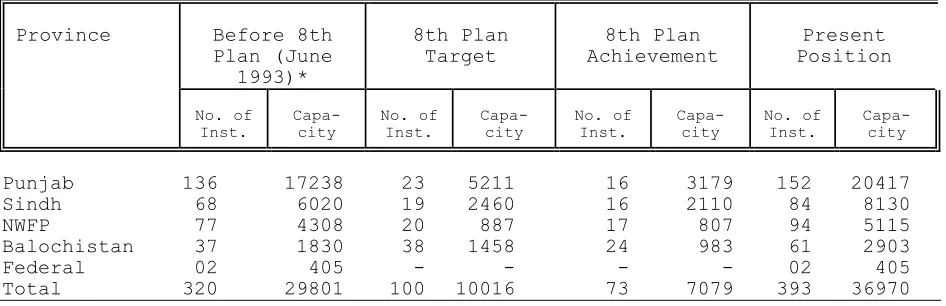
[image:27.612.71.544.316.469.2]Pakistan is ill equipped in comparison to other developing countries in terms of facilities and performance in the field of technical and vocational education. According to Human Development in South Asia 1998, enrollment in secondary technical education is 1.6% of the total secondary enrollment. An estimate based on HIES 1993/94 reveals that only 5% of the population aged 10 and over had any technical and vocational training of any sort, institutional and on the job. In the context of resource crunch during 1990s the vocational training programme failed to achieve the targets envisaged by Eighth five Year Plan (1992/93 - 1997/98) (See Table 13). The resource crunch has also adversely affected the functioning of institutions and quality of training.
Table 13
VTIs: 8th Plan Targets and Achievements
Province Before 8th Plan (June 1993)* 8th Plan Target 8th Plan Achievement Present Position No. of Inst. Capa-city No. of Inst. Capa-city No. of Inst. Capa-city No. of Inst. Capa-city
Punjab 136 17238 23 5211 16 3179 152 20417 Sindh 68 6020 19 2460 16 2110 84 8130 NWFP 77 4308 20 887 17 807 94 5115 Balochistan 37 1830 38 1458 24 983 61 2903 Federal 02 405 - - - - 02 405 Total 320 29801 100 10016 73 7079 393 36970
Source: Report of Committee on Manpower and Employment for Preparation of Ninth Five Year Plan. Planning Commission, Government of Pakistan. Islamabad. 1997.
Notwithstanding the fact that the existing technical and vocational training output in the system is a miniscule, the relevance of the system for the labour market has been questionable. However efforts have been to enlist the participation and collaboration of the private sector for enhancing the relevance of the vocational training system. The Central Management Committees headed by representatives of private sector employers under National Vocational Training Project were established. Similarly Skill Development Councils have been set up in Punjab and Sindh Provinces to integrate the skill training with market needs. These are discussed below.
1. Skill Development Council
technical and vocational training. Currently three SDCs, Karachi, Lahore and Islamabad are established, as a joint project of Government, World Bank, ILO and Employer's Federation, under the restructured National Vocational Training Project Phase II. Major functions of these councils are to (i) provide a link between employers and training institutions (ii) identification of training needs of the geographical area (iii) analysis and prioritization of training needs and meeting these needs through contracted arrangements with training institutions and establishments for in-plant training (iv) determination and updating of training standard, and (v) promotion of in-plant and other training for benefit of industry.
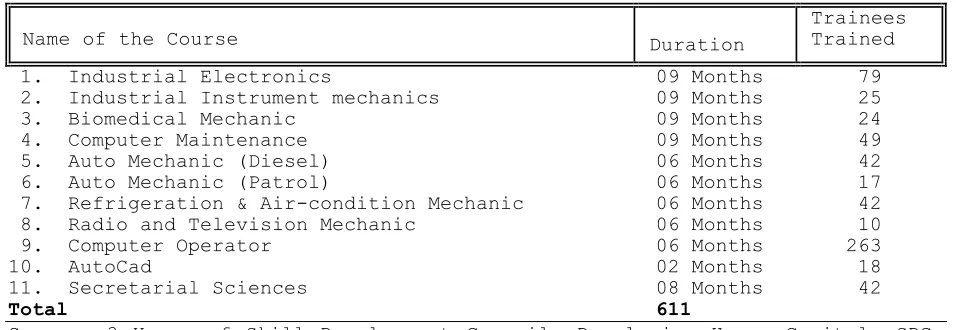
Table 14
Trainees Trained Under Prime Minister's Training Programme: Skill Development Council Karachi
Name of the Course Duration
Trainees Trained 1. Industrial Electronics 09 Months 79 2. Industrial Instrument mechanics 09 Months 25 3. Biomedical Mechanic 09 Months 24 4. Computer Maintenance 09 Months 49 5. Auto Mechanic (Diesel) 06 Months 42 6. Auto Mechanic (Patrol) 06 Months 17 7. Refrigeration & Air-condition Mechanic 06 Months 42 8. Radio and Television Mechanic 06 Months 10 9. Computer Operator 06 Months 263 10. AutoCad 02 Months 18 11. Secretarial Sciences 08 Months 42
Total 611
Source: 3 Years of Skill Development Council, Developing Human Capital. SDC, Karachi.
Under the Youth Training Programme 601 persons have been trained while 825 are currently under training. Since these courses are being designed on full cost recovery basis, there is also a provision of financial assistance in terms of repayable loans to students which will be repaid after the trainee gets employment. Uptill now rupees one million has been paid to 160 students as financial assistance. The Appendix Tables No. 3 and 4 provide details of the trades in which training is imparted.
The SDC, Lahore appears to be engaged in the organisation of various skill upgrading programmes in collaboration with different training providers. In addition training programmes for first line supervisors are being arranged. Also it runs programmes in collaboration with British Education and Training System and during the year 1998/99 nearly 500 participants would get Management and Information Technology Training.
PUNJAB VOCATIONAL TRAINING COUNCIL (PVTC)
and Manpower is the co-opted Member of the Council. The council is assisted by staff and professionals headed by General Manager. The Punjab Government has granted Rs. 100 million for setting up the council.
Through the establishment of PVTC Zakat funds are to be used to impart demand driven skill training to the deserving persons (mustahqeen) at VTIs. Hence poverty alleviation is sought through skill provision. The VTIs are to be managed by the local business community, the potential employers, with full functional and financial autonomy. In the first phase, at least one VTI will be established in each district to serve as a focal point for assessing core training needs and guide for further establishment of the VTIs in the district.
The PVTC has so far established two VTIs with an enrollment of around 200 which are being imparted skills in PC's electrician, turner, machinists etc. The class room training will be combined with on the job training in local factory to be arranged by VTI. It is claimed that VTI's are demand driven and provision of training is based on needs assessment but the procedures underlying needs assessment merit further scrutiny.
It is imperative to assess and evaluate the precise contribution of private sector involvement in TEVT System of the country. The Centre Management Committees (CMCs) with an objective to manage and guide the T.T.C's at local level apparently met with little success. Either the employer could not squeeze the time to attend a meeting in some cases and/or the principal of TTC failed to do the homework for fruitful collaboration. Besides the T.T.C's at local level lack requisite autonomy to introduce a change in the curricula, or duration, and entry qualification etc. for a course, hence a private/public collaboration at the level of training centres under the existing centralised dispensation is mostly of academic interest excepting the case when on the job training facilities may be offered by the local employers. Evidence on such an achievement made by any T.T. Centres is not readily available.
The SDC's and recently constituted Punjab's PVTC need to be carefully examined and evaluated in the light of the objectives of the private/public collaboration. While SDC's are essentially implementation of a donor financed project, the Punjab's initiative was due to one time grant and depends upon availability of Zakat fund. Sustainability of these ventures has to be seriously assessed.
Association will also provide assistance to trainees in getting employment". Another pamphlet describing computer courses indicates that trainees can get employment in the fields of banking, management, sales and marketing and so on.
CHAPTER 4
CASE STUDIES
In this chapter three case studies of training centres are presented which belong to the existing TEVT System. These are often regarded to be successful with positive impact on the development of local industry and meeting their skill needs. In addition these also represent the cost-effective approaches to skill development and technological upgradation.
INSTITUTE OF LEATHER TECHNOLOGY, GUJRANWALA
This institute administered by Small Industries Corporation of Punjab, was established in 1947 to provide training, technical advice, physical and chemical testing facilities and research for leather goods industry. The relevance, availability and use of the services of I.L.T. was assessed by Punjab Eco-Research Institute through a survey conducted in early 1990's. In this evaluative exercise the effect of training of I.L.T. were examined alongwith other technical and consultancy services rendered by ILT. This can serve as a case study wherein skill training is integrated with other services for meeting the requirements of an industry. Major findings related to training on the basis of responses from 47 leather goods producers are provided below.
1. Only six percent of the responding firms got their workers equipped with the skills at the training centre while the remaining provided either on the job training (77%) or through in-house training courses (17%).
2. The managers/owners who benefitted from training centre accounted for nearly 30% of the firms. In case of large firms which export almost 80% of their produce, 50% of the managers/owners were trained by I.L.T.
3. Nearly 70% of the firms which employed I.L.T. trainees were satisfied with their performance.
4. Around half of the employers regarded syllabus to include irrelevant subjects while one-fourth viewed that some relevent subjects were missing.
5. Majority of employers regarded the duration of diploma course (3 years) to be adequate with F.Sc. as entry level qualification.
7. A sizeable fraction of the respondents reportedly encountered difficulties in getting skilled labour while on the other hand few firms participated in I.L.T. training. The researchers of the study speculated that firm's ability to finance the training could be one of the reason, hence there was a need for institutional support from the government to expand the production of skilled workers. In other words investment in training could be sub-optimal if left entirely to private initiatives.
PAK-GERMAN WOOD WORKING CENTRE, PESHAWAR
Introduction
The Pak-German Wood Working Centre was established with the co-operation of the Government of the Islamic Republic of Pakistan and the Government of the Federal Republic of Germany at a total cost of Rs. 2.6 million in 1972. The Centre is under the direct control of NWFP Small Industries Development Board which is an autonomous body. The objectives of the Centre are to meet the technical manpower requirements of the country by training skilled workmen for industry and trade in the art of cabinet making. The intensive course of the Centre prepares the trainees for employment by providing them with high levels and standards of skills as necessary for direct utilisation by the employers.
Training
The Pak-German Wood Working Centre has designed its courses to the requirements of modern and progressive techniques and imparts training under realistic conditions. The Training Centre trains apprentices who are matriculate for two years to get a certificate. From these trainees suitable persons are chosen to be trained to the level of Wood Technologist and Foreman. This requires another one and half year training. Only those persons are selected for Diploma Course who have high first class marks in 2 years basic course. The training is absolutely free. Books, stationery and working uniform is provided free of cost and the trainees are paid stipends which range from Rs. 125 per month during first year to Rs. 250 per month during the third year. In addition free hostel accommodation for 15 trainees residing outside Peshawar can be provided.
Training Scheme:
The training period is divided into two parts: 1. Basic Training.
During Basic Training the trainee is familiarised with the general practical skill and theoretical knowledge of his trade. During the specialised training he is trained in furniture making by using working drawings made by himself. The trainee also learns the general practical skill of operating machines alongwith the theoretical knowledge for repair, maintenance and machine tool sharpening. Priority is given to the practical part of the training. The ratio between practical and theory is 60:40.
Employability
After the successful completion of courses of two years and three and half years certificate and diploma respectively are awarded which are recognised by the Government of NWFP, Labour and Welfare Department. Over the years this training centre has trained around 350 persons. Most of these trainees were employed soon after they finished their training. The certificate holders get BPS-11 in the government and Rs. 3 to 4 thousand if employed by private sector. The diploma holders in the government service generally are hired in the scale of BPS-14 and fetch over Rs. 5000/- per month in the private sector.
METAL INDUSTRIES DEVELOPMENT CENTRE (MIDC), SIALKOT
MIDC was established in 1943, and has been an important source of technology and skills diffusion as well as promoter of entrepreneurship in Sialkot's metal industry. The major functions of the centre are:
(a) To serve as an advisory and extension services centre in the field of production techniques, modernisation, quality control, material testing, etc. relating to surgical instruments, tools and other light engineering products;
(b) To provide training facilities in the field of Mechanical Technology, including its theory and practice.
CHAPTER 5
COMPETITIVENESS HRD, AND FUTURE CHALLENGES
This chapter attempts at ascertaining the association between competitiveness and HRD wherein the relevance of the productive structure for utilisation of HRD is discussed. The technological levels obtained in Pakistan and experience of productivity growth during the past is briefly described. Changes in unit labour cost since 1970 have been worked out to identify the determinants of these changes. Existing comparative advantage in terms of RCA analysis has been presented. Finally the section ends with some speculations about the future challenges and opportunities entailed by the trade liberalisation under WTO.
Admittedly the need to improve the economic position of a country as well as living standards of its population on a sustainable basis can hardly be emphasized. This in turn calls for due cognizance of the emerging global opportunities and challenges with a view to increase national competitiveness for increasing the participation in global trade and investment opportunities. The national competitiveness has been defined variously as "ability to produce goods and services that meet the test of international markets" (Laura Tyson) and "ability to generate, while being and remaining exposed to international competition, relatively high factor incomes and factor employment levels on a sustainable basis" (OECD).
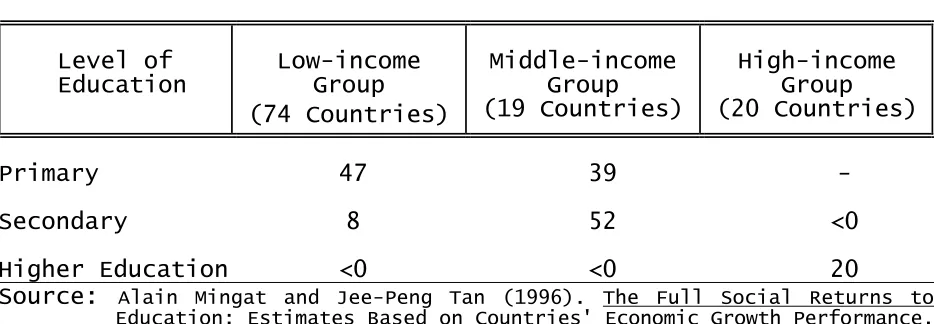
The link between the stage of development of a country and productive utilization of education/skills is also identified by some researchers. Analysis of the growth process by Pritchet (26) reckoning with human capital accumulation casts doubts on whether the pay off to education has been near to what is generally claimed through rate of return estimation. Mingat & Tan (18) further extended this line of enquiry using data on 113 countries for 1960-85 period and demonstrated the association between level of development of a country and the returns from different levels of education. The Table 15 reproduced below suggested that Full Social Rate of Returns from higher level of education were zero, low and middle income countries, while the same were 20% for high income countries. Studies like this tend to suggest that it would be unwise to expect automatic results from any and all sorts of investments in human capital. Clearly some other conditions such as level of technology, industrial mix, and appropriate macro and micro policies must exist to reap the benefit from investment in education and training.
Table 15
Estimated Full Rates of Return by Level of Education and Country Group
Level of
Education Low-income Group (74 Countries)
Middle-income Group (19 Countries)
High-income Group (20 Countries)
Primary 47 39 -
Secondary 8 52 <0
Higher Education <0 <0 20
Source: Alain Mingat and Jee-Peng Tan (1996). The Full Social Returns to Education: Estimates Based on Countries' Economic Growth Performance. Human Capital Development Working Papers, World Bank.
Technological Capacity
under import substitution strategy. Irrespective of the factors responsible, the existing technological capacity is low. Pakistan's position in terms of hardware and software of technology in a comparative framework is hardly enviable. Below a table reproduces some evidence.
Table 16
Communications, Information and Science and Technology
Economy Per 1,000 People
Internet Hosts
per
10,000 People July 1997 Scientist
&
Engineers
in
R&D
Per
Million People
1981
-High Technology Expo
rts
%
of
Mfg.
Export
s No. of Patent Applications Filed 1996
Telepho ne
Main
Lines 1996 Persona l Compute rs 1996 Residen ts Non
-residen ts
Bangladesh 3 .. 0.00 .. .. 70 156
India 15 1.5 0.05 151 10 1,545 5,021
Nepal 5 .. 0.07 22 0 3 5
Pakistan 18 1.2 0.07 54 3 21 678
Sri Lanka 14 3.3 0.33 175 3 76 15,944
Indonesia 21 4.8 0.54 181 18 .. ..
Korea Rep 430 131.7 28.77 2,636 39 59,249 37,308
Malaysia 183 42.8 19.30 87 67 141 3,911
Philippines 25 9.3 0.59 87 62 .. ..
Singapore 513 216.8 196.30 2,512 71 10 11,871
Thailand 70 16.7 2.11 173 36 .. ..
China 45 3.0 0.21 537 21 10.066 31.707
Japan 489 128.0 75.80 5.677 39 335.061 53.896
Source: Naseem, S.M. (1999). Globalization, Technology and Asian Economic Growth. Paper presented in the 14th Annual General Meeting and Conference of the PSDE (28-31, January, 1999), Islamabad. Pakistan.
Productivity Trends
Competitiveness and productivity of the economy is expected to rise with technological improvements and innovations. Given the low technological base and domination of assembly over manufacturing, one can hardly expect substantial Total Factor Productivity (TFP) growth. Kemal (10) made an effort to understand the sources of growth for 1947-91 period. Gains in TFP were ascertained using growth of value added and growth of inputs. As reproduced below in the table, the major finding being a decline at a rate of 0.56 in TFP during 1947-91. However the same exercise did suggest a modest rise during 1978-91.
Table 17
Growth of Output and Productivity
Value Added Aggreg ated Inputs Total Factor Produc tivity Aggreg ated Inputs Produc tivity Gains
Pre-Plan 1950-55 3.14 6.27 -3.09 199 -99 First Plan 1955-60 3.32 5.18 -1.76 156 -56 Second Plan 1960-65 6.46 8.49 -1.87 131 -31 Third Plan 1965-70 6.10 5.96 +0.13 97 3 (Non-Plan) 1970-78 4.96 5.03 -0.07 101 - 1 Fifth Plan 1978-83 6.54 5.58 0.91 85 15 Sixth Plan 1983-88 6.54 5.44 0.74 87 13 Seventh Plan 1988-91 5.48 4.57 0.88 83 17 (First three years)
Overall 1950-91 5.24 5.83 -0.56 111 -11 Source: A. R. Kemal. (1992). Report of the Sub-Committee on Sources of Growth
in Pakistan. Committee on Economic and Social Well-being for the Eighth Five Year Plan. Pakistan Institute of Development Economics, Islamabad.
In terms of major sectoral break down, with the development of hybrid seeds during the sixties and Nayab variety of cotton during 1988-91 the agriculture experienced a growth in TFP. In case of manufacturing sector productivity growth was experienced during the 1960's which Kemal attributed to exposure to foreign competition, deregulation of the economy, liberal import policy leading to higher capacity utilisation and learning by doing. Kemal in his study outlined the reasons for low TFP growth since independence. The poor performance of Pakistan in this context has been ascribed to "lack of technological development and lack of human resource development". In addition the author criticized the indigenisation policy because of its bias in favour of assembly rather than manufacturing of components
Studies conducted in the context of Pakistan 2010 for instance similarly yielded that T.F.P. index for the economy as a whole has declined from 100 in 1980-81 to 97 in 1996-97. At the disaggregated level of sectors large scale manufacturing exhibited a marginal rise from 100 to 102 while agriculture experienced a decline from 100 to 99 during the same period. The detailed picture of large scale manufacturing revealed a mixed performance by different industrial categories for the nine year period of 1981-90. In case of textiles and industrial chemicals TFP improved while it worsened in the remaining categories.
disaggregated analysis2.
Unit Labour Cost
Analysing the competitiveness is a complex task. The changes in productivity, innovation and quality are important long term determinants of competitiveness, which in turn are influenced by incentive regime, and regulatory structures bearing upon transaction costs. However analysts also simplify the procedure and focus on macro variables such as exchange rate, relative movements in prices and wage rates. Below a brief discussion on worker compensation in comparative framework and determinants of changes in unit labour cost is made.
Table 18
Determinants of Total Factor Productivity Growth (O.L.S. Regression)
Explanator y
Variables
Equation-1 Equation-2 Equation-3 Equation-4 Equation-5 Equation-6
Constant -21.808 (0.83) -20.346 (0.774) -7.067 (1.207) 15.224 (2.736) -11.874 (2.304) -1.707 (0.109) G11 0.152 (4.087) 0.155 (4.157) 0.145 (4.673) 0.111 (2.789) 0.100 (2.526) 0.135 (4.121) G12
- 0.115
(1.004) 0.120 (1.085) 0.127 (0.865) - - G2 0.773
(2.525) 0.650 (1.976) 0.596 (1.977) 1.050 (2.703) 0.724 (2.191) 0.683 (2.332)
O1 0.174 (0.600) 0.151 (0.519) - - - - O2
- - - 0.944
(2.277) 0.706 (1.961) 0.557 (2.691) G31 0.029
(2.264) 0.033 (2.466) 0.031 (2.519) - - 0.031 (2.257) G32
0.323
(2.125) 0.280 (1.768) 0.244 (1.772) 0.521 (2.425) 0.393 (1.989) 0.153 (0.654)
D -8.191 (3.199) -8.796 (3.345) -8.490 (3.428) -2.912 (1.228)
- -7.310 (2.845) Adj.
R-squ.
0.561 0.561 0.591 0.273 0.259 0.570
F 4.621 4.108 5.086 2.628 3.269 4.689
N 18 18 18 27 27 18
Note: t-values are reported in parenthesis.
G11 and G12 are growth rate of expenditure on R & D and growth rate in scientific and technical manpower, respectively; G2 is growth in human capital; G31 is growth rate foreign patent registered; G32 is growth rate
2Needless to emphasise that the approach to measure TFP depends critically
of national expenditure on R & D. O1 and O2 are openness measures; and D is dummy variable for political stability.
Source: Mahmood, Z. and Siddiqui, R. "State of Technology and Productivity in Pakistan's Manufacturing Industries: Some Strategic Directions to Build Technological Competence", (forthcoming).
[image:41.612.67.546.412.715.2]Table 19 in Panel A compares hourly compensation costs of production workers in large scale manufacturing of Pakistan for 1986-92 with India, Sri Lanka, Indonesia and Korea. Hourly wage costs in Pakistan estimated by dividing the annual employment cost per production worker reported in Census with 2496 (hours/year), in US$ are second only to Korea. It may be noted that these costs in case of exports industries of Pakistan (textiles, apparel and leather) are only slightly higher than that of India or Sri Lanka. In Panel B the movement of Real Unit cost of labour is depicted wherein one finds that in case of Pakistan the decline in this indicator closely follows that of Indonesia and differs with Korea and Sri Lanka where this index has risen. The index for exports industries in Pakistan has registered larger decline than that of Indonesia, however cross-country comparisons are risky besides the deflator (Real Exchange Rate) used in case of Pakistan is slightly at variance with the one used by Godfrey for other countries.
Table 19 Hourly Compensation costs for Production Worker in Manufacturing - Selected Countries (US Dollar)
Panel-A
Country 1986 1987 1988 1989 1990 1991 1992
Indonesia 0.40 0.34 0.34 0.39 0.41 0.47 0.59
India 0.39 0.38 0.37 - - - -
Sri Lanka 0.29 0.30 0.31 0.31 0.35 0.40 0.40
Korea 1.31 1.59 2.20 3.17 3.71 4.46 4.93
Pakistan
(a) All Manufacturing 0.51 0.56 0.57 N.A. 0.61 N.A. N.A. (b) Textile, Apparel
and Leather 0.37 0.40 0.43 N.A. 0.47 N.A. N.A.
Panel B
Real Unit Labour Cost (Index)
Country 1986 1987 1988 1989 1990 1991 1992
Indonesia 100 73 74 67 65 72 72
India 100 80 66 NA NA NA NA
Sri Lanka 100 96 77 53 114 131 128
Korea 100 99 130 185 208 222 236
Pakistan
(a) All Manufacturing 100 94 86 NA 76 NA NA
(b) Textile, Apparel
Note: (1) Pakistan's data are based on Census of Manufacturing Industries which are provided for financial years. Thus under 1986, the CMI 1985-86 is used.
(2) For other countries Martin Godfrey.
Following Mazumdar (17) three categories of factor which influence international competitiveness can be identified. Changes in wage productivity gap - the difference between the rate of change in real wages and that of physical productivity of labour. An increase in wage productivity gap decreases international competitiveness. Domestic real exchange rate (DRER), the difference between the price index of non-traded and traded goods. The former is often simulated by CPI while the latter by manufacturing producer's price index. If changes in CPI exceed those in the PPI then labour cost will increase. Thirdly nominal exchange rate devaluation reduces the cost of manufacturing labour in terms of foreign currency.
Table below provides annual changes in these three components for 1970-87 and 1987-91 sub periods.
Table 20
Changes in Unit Labour Cost (Growth Rate)
Period (W-V) + (Pc-Pp) - e ULC
1970-87 -0.008 + 0.002 -0.078 = -0.084
1987-91 0.008 + -0.025 -0.09 = -0.107
The calculations reported in the above table yield that unit labour cost has declined at the growth rate of 8% during 1970-87 and 10.7% during 1987-91. Exchange rate depreciation mostly explains this decline. In the pre-SAP period (1970-87) the wage/productivity gap was slightly negative while the same being positive in post SAP (1987-91) period. This can be attributed to very low productivity growth during the later sub-period. The indicator of price-differentials denotes that during the latter sub-period rise in producer's prices surpassed that of the consumer prices.
Revealed Comparative Advantage (RCA)
Utilizing the information for 1990 and 1995 on Pakistan's major exports at four digit level classification the study classified the products not only on the basis of the most current RCA but also by relative changes over five year period. Competitive position of Pakistan's exports was indicated by four distinct group of products. In cases where RCA was greater than one and increasing the product group was identified as strongly positioned, but if RCA declined over 5 years it was identified as threatened product group. In case of products where RCA was less than one but increasing the product group was characterised as improving product group however if the RCA experienced a decline during the said period it was declared as weakly positioned product group (See RCA tables in the Appendix Table 5).
While highlighting the narrow export base with precarious dependence on cotton/textile sector the study did identify some non-textile products with strong potentials. Clearly however textile and apparel (the largest export group) is likely to continue as leading export industry. The study also suggested a focus on the food related categories to "make new inroads into global markets".
Trade Liberalisation
During the past decade or so there have been perceptible shifts in thinking on development resulting in greater role for private sector and also a shift in the degrees of freedom for the countries to participate in the world economy. The process of globalization entailed advances towards foreign trade and capital movement. A new world economic order governed by WTO will determine the governing methods, legislation and trade relationships. Thus while opportunities to benefit from export performance have expanded the policy instruments to undertake new economic activities and development of technological capabilities in the developing world have been blunted. This process of globalization appears to have been attended by major burst of technological changes, industrial restructuring and information revolution.
The likely influence of the trade liberalization on Pakistan is assessed by number of researchers. Ingco and Winters (8) for instance estimated that Pakistan's total merchandise exports to developed and developing countries will be subjected to a lower rate of tariff, a weighted average tariff reduction by the order of 2.4% and 6.9% respectively. Similarly Pakistan's major manufactured export commodity, textile and clothing, hitherto restricted by MFA will be positively influenced. The above cited study provided an estimated gains (in 1992 prices) ranging from US$ 500 million to US$ 1.3 billion from abolition of MFA expected to take place in 2004. In case of agricultural commodities the expected gains range from US$ 27 to 43 million.
currently being examined to effectualise the expected gains. In a recent study (Zafar 1999) for instance viewed that "Trade opportunities will only materialise if our exporters are able to effectively compete with their competitors". This study also alludes to the possibilities wherein Pakistan's access to scientific and technological knowledge gets restricted thereby adversely affecting the productivity growth in the country. The study while identifying promotion of indigenous technology as Pakistan's strategic challenge in the long run, recommends for preparation of a plan to restructure textile and clothing industry and Pakistan's innovation system, provision of efficient (soft and hard) infrastructure and development of skills.
Strength and weaknesses of textile industry in Pakistan with a view to assess its readiness to reap the benefits from removal of MFA is also the subject matter of the study by Zia (1999). The author viewed that the predominance of the spinning sector has adversely influenced in that the share of high value added exports in total has been much lower than the potential. The author while attributing this imbalance to disproportionate policy favours to spinners, viewed that "this sector still needs crutches to live on". The study further argued that textile producers neglected R&D, with little investment in quality and understanding consumer performances and viewed that the industry is "going to be a laggard in the world market after 2004 when new trading order begins". In this context the author also lamented over the absence of institutional network to promote managerial, technical and marketing skills.
Employment Implication of Trade Liberalisation
Notwithstanding the limitations of the analysis aimed at quantification of the impact of trade liberalization, Mahmood (15) tried to simulate the employment implication of low tariff regime in the manufacturing sector of Pakistan for the period 1992-2007. Estimates are based on the ERP and DRC's for the 1980/81 and 1990/91. In addition the assumed growth rates of value added in 9th five year plan and perspective plan were utilised. Also trade and industrial policies reflected by the above official approaches were incorporated for projection purpose. The projections provided two variants - optimistic and conservative - for three sub-period, immediate run, medium run and the long run. The employment projections for the large scale manufacturing sector are reproduced below in the table.
Table 21
Projected Employment in Large Scale Manufacturing (Growth Rates)
Conservative