Trend Analysis of Weather Parameters and People
Perception in Kullu District of Western Himalayan Region
Vidya
1, R K Aggarwal
1,*, P K Mahajan
1,2, Y S Negi
1,3, S K Bhardwaj
11Department of Environmental Science, Dr Y S Parmar University of Horticulture & Forestry, India 2Department of Basic Sciences, Dr Y S Parmar University of Horticulture & Forestry, India 3Department of Business Management, Dr Y S Parmar University of Horticulture & Forestry, India
Copyright © 2015 Horizon Research Publishing All rights reserved.
Abstract
The trends of important weather parameters in Kullu district of hilly state have been presented. The season wise analysis showed that there is no explicit linear trend in weather parameters over a period of time. The increasing and decreasing trends were observed in all the season as the cubic function showed to be the best fit. Among the analyzed weather parameters maximum temperature cubic function was to best fit with significant r2 value of 0.57, for minimum temperature and relative humidity r2 value was 0.67 and 0.62 respectively. In order to know the impact of climate change and people’s perception about climate change, a survey was conducted. About 42.72% people perceived there is 30-50% decrease in productivity of cereal crops, while in case of fruits 28.64% people perceived that there is 20-30% increase in productivity and for same commodity 15.05% people also assumed there is 10-20% decrease in productivity and 13.60% believed there has been no change in productivity for fruits. In case of vegetable 53.88% respondent anticipated that there is 30-50% increase in productivity. The perception about the productivity of pulses showed that 26.70% believing slight increase in productivity while some perceived moderate increase in productivity and some anticipated no change in productivity.Keywords
Weather Parameters, Trend Pattern, People Perception, Climate Change1. Introduction
Global warming is considered to be continuing rise in the average temperature of Earth's. The fourth assessment report (APR 4) of Intergovernmental Panel on Climate Change (IPCC) reported that the major cause of global warming is increasing concentrations of greenhouse gasses due to human activities. Affirming these findings in 2013, the IPCC stated that the largest driver of global warming is carbon dioxide from fossil fuel combustion and land use changes like deforestation. The IPCC in its fourth assessment report
indicated that during the 21st century the global surface temperature is expected to rise 1.1 to 2.9°C for their lowest GHGs emission scenario and 2.4 to 6.4°C for their highest GHGs emission scenario.
Future climate change and its associated impacts will be different for region to region around the world like rise in sea level and change in precipitation pattern. Warming is likely to be more in Arctic, with the continuing retreat of glaciers. Other likely effects of the warming include more frequent extreme weather events including heat waves, droughts and heavy rainfall; ocean acidification; and species extinction due to shifting temperature regimes. The significant effect of global warming to humans will be on food security due to decreasing crop yields.
The existence and extent of climate change will be of great importance to climate scientists as well as individuals, groups, and organizations with long-term policies that are crucially affected by climate, projected climate change, and potential climate change mitigation measures. The various authors presented their study in this regards are summarized in this section
1.1. Effect of Climate Change
[1] revealed that there was increase in rainfall in northern Europe ranging 10 and 40 percent during the twentieth century, while there has been little change in southern Europe. [2] reported that analysis of the frequency of heavy rainfall events indicated a probability of more than 90 percent that a 2 -4 percent increase in frequency has occurred during the past 50 years in the Northern Hemisphere.
changes in precipitation patterns are more difficult to determine.
[20] revealed that the climatic variation due to occurrence of drought has significant impact on the production of Rain fed crops. The farmers in small and medium Rain fed areas were highly vulnerable to climate change and to a larger extent the farmers have adopted technological coping mechanisms for climate change as compared to large farmers on the positive side and negatively through shifting to other professions. As the impact of climate change is intensifying day by day the policy should be framed at the earliest to avoid short term effect such as yield and income loss and long-term effects such as quitting agricultural profession by the Rain fed farmers. Study conducted by [21] in Bihar revealed that there was a slight increase of 0.5% in rainfall during 1999-2008 as compared to 1989-1998.
1.3. Weather Trends in Himalayas Region
[22] did not find any significant long-term trend in precipitation data (1959-1994) of the Nepalese Himalaya. Likewise precipitation trends in Bhutan’s Himalayan region suggested largely random fluctuations and no trend on annual or seasonal basis. [23] observed statistically significant increasing trend in winter precipitation during 1961-1999 in the upper Indus Basin (Pakistan), but no trend was observed during the longer 1895-1999 period. [24] analyzed 80 years (1901-1980) of rainfall data in Indian Himalayas and found an increasing trend between 1901 and 1965, and deceasing trend between 1965 and 1980. [25] studied long term trends in maximum, minimum and mean annual air temperature across the North-Western Himalayas during the twentieth century and observed significant rise in temperature with winter warming at faster rate.[26] reported that the western Himalayas recorded an increase of 0.9oC maximum temperature over 102 years (1901-2003). [27] found statistically significant downward trend in winter precipitation (Jan-Feb) in Jammu & Kashmir and Uttarakhand during the period 1901-2003. Increase in precipitation during pre-monsoon (March-May) was observed over the western Indian Himalaya during 1901-2003. [28] observed increasing trends in maximum temperature and seasonal average of daily maximum temperature for all seasons except monsoon over the lower Indus basin in the northwest Indian Himalaya. [29] observed a statistically significant downward trend (at 5% significance level) in monsoon and average annual rainfall in the northwest Indian Himalaya in three stations during 1866-2006.
[16] analyzed rainfall data of five stations for the period 1903-1982 in Kashmir valley and showed that three stations experienced a decreasing trend in annual rainfall (the largest decrease was -20.16% of mean per 100 years). The deceasing trend in winter was statistically significant (95% confidence level) whereas none of the increasing trends in the pre-monsoon and post-monsoon season was significant. Using winter (December -February) monthly temperature
data from 1975-2006, [30] found a warming trend over the western Indian Himalayas, with the greatest observed increase in maximum temperature (1.1-2.5℃). Increasing trend in winter maximum temperature in the upper Indus basin was also reported by [31] who found an increasing warming trend of 0.45, 0.42,0.23°C per decade in maximum temperature for the upper, middle, and lower regions respectively during 1967-2005 and spatially inconsistent and generally statistically insignificant seasonal precipitation trends during 1967-2005.
1.4. People Perception about Climate Change
Several studies have been carried out to assess the public’s knowledge of the activities that cause global warming. [32] and [33] interviewed residents at Pittsburgh to determine their opinion about the causes of global warming and asked them to rate their degree of agreement that each activity is causing global warming. The study showed that participants’ beliefs about global warming contributors were lacking. The participants were strongly agreed that clearing tropical rainforests, deforestation, and aerosol spray cans are causes of global warming than burning fossil fuels. Similarly, in [32] study, most participants mentioned ozone depletion, pollution and air pollution, aerosol cans, automobile use, and industrial emissions as causes of global warming, while fossil fuels and energy use in buildings were much less frequently mentioned.
[33] found that most participants rated policy related to energy conservation and fossil fuel reductions are more effective. The participants believed that reductions in air pollution and CFC-related activities (such as banning aerosol sprays and Chlorofluorocarbons) would less effective [33]. They also found that more than half of their respondents considered reducing industrial emissions of greenhouse gases, planting more trees, energy efficient technologies, driving less, and halting deforestation as very helpful solutions to reduce global warming, while reducing home energy use was rated as very helpful by only 37%.
Climate change has resulted observed and projected changes in land cover and land ([34], [35], [36], and [37]). [38] have focused on location -specific case studies and [39] studied shifts by individual or groups of organisms, but ([40], [41], [42], [43]) have provided a comprehensive analysis across many species and locations.
variability with untimely,late monsoon start, no winter rain and high intensity pattern with short periods. Furthermore, they have been experiencing an unpredictable rainfall patterns over the past 10 years. Almost 70 percent respondents said that the incidents of drought have been increasing and link it with the untimely and unusual rainfall patterns over the past few years in both study sites (upstream and downstream). People responded that climate change has both positive and negative impact on rural livelihood.
Using experimental and survey data on the relationship between temperature changes and climate change beliefs, researchers have found that both perceptions of having experienced warming, and physical data showing warmer temperatures and trends, are correlated with an increased belief in and concern about climate change, and support for policy ([45], [46], [47], [48], [49], [50]). The studies have indicated that people can accurately identify climatic changes of a decade or more through direct experience ([51], [52], [53]) the recent study of farmers from Burkina Faso found that they recognized decreases in rainfall that had been occurring over a 30-year period.
[54] studied on role of political ideology and cultural worldviews in shaping weather perceptions and found both were statistically significant predictors when holding constant localized physical measures of weather changes. [55] conducted a study at Bangladesh on people’s perception of climate change and human health risks and found that over 95.5 per cent of the respondents reported that the heat during summers had increased and 80.2 per cent reported that rainfall had drastically decreased, compared to five to ten years ago. The majority (63.5 per cent) reported that winters are not cold as they were earlier. [56] conducted a study on Farmers’ Perception in relation to Climate Variability in Apple Growing Regions of Kullu District of Himachal Pradesh and found that people perceived the development of infrastructure such as roads, trails and buildings, intensification of agricultural/ horticultural activities, timber extraction (for fuel and building material), and grazing activity have increased the risks associated with landslides, floods, and other erosion processes.
The trend pattern of weather variables and people’s perception about the climate change has not been carried out in the Western Himalaya region. Keeping the above factors under consideration the present study was undertaken with the objectives to analyze the weather parameters using time series data and to study people’s perception on climate change in the study area.
2. Methodology
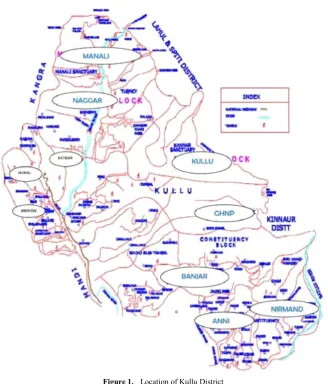
The study area comprises the Kullu district of Himachal Pradesh in Northwestern India. The area lies between 31° 21’ N and 32° 59’N latitude and 76° 49’ E and 78° 59’ E longitude, comprising an area of 5503 km2 which contributes 9.88 percent of the total area of the state. The
district comprises five blocks namely Naggar, Kullu, Banjar, Ani and Nirmand. The elevation ranges from 350 to 6500 m above mean sea level. The major cereal crops grown in the district are the maize and wheat. Other crops like pulses, stone fruits, pome fruits and vegetables like tomato, cabbage, cauliflower, peas, potato, bean, pea etc. are also grown in the area. The total area under agriculture is 65,186 hectares, net sown area is 36,342 hectares and under irrigation area is 2,878 hectares. The Banjar block taken up for survey has 6,935 hectares area under agriculture.
The climate of the district is sub temperate to temperate. The District is characterized by cold dry weather. The geography of the region represents mid hill to high hills in the region. The climate of the region is by and large sub-temperate in lower hills to temperate in high hills. The regions also receive snowfall in high hills during winter months and serve as a great source of fresh water in Beas Basin of Himachal Pradesh. The maximum temperature varies from 15.8°C in January to 32.8°C in June, whereas the minimum temperature ranges from 21.1°C in July to as low as 0.7°C.
The secondary data of weather parameters viz., maximum temperature, minimum temperature, rainfall and relative humidity for three stations namely Seobag, Bhunter and Katrain for the period from 1999 to 2013, 1971 to 2008 and 1991 to 2005 respectively was taken from Dr Y S Parmar University of Horticulture & Forestry, Nauni8 (Solan) and India Meteorological Department, Pune, India.
The Banjar block was selected purposely to carry out survey to know the people’s perception about climate change. Five panchayats were selected on random basis namely Chanoun, Kotla, Shenshar, Seraj, Palachh. 10 percent survey of the total households of Banjar block was conducted by personal interview of the people.
The analysis of weather data was conducted on annual, seasonal, monthly and weekly basis. Average from daily data was calculated from all the weather parameters except in rainfall where total was calculated. Statistical and economic analysis has been done using Statistical Package for Social Sciences (SPSS). Different functions viz., linear, power, inverse, quadratic, cubic, compound, growth, exponential and logistic were fitted to find out the trend of weather parameters over the period of time. The best fitted equation was selected. Karls Pearson correlation was used to find out the relation between different weather parameters.
Figure 1. Location of Kullu District
Table 1. Location wise coefficient of variability and other selected parameters
Parameters Bhunter Katrain Seobag Bartlett’s χ2
Mean SD CV(%) Mean SD CV(%) Mean SD CV(%)
Maximum Temperature (X1) 25.66 6.67 25.98 20.17 6.67 33.04 24.7 6.51 26.35 4.28
Minimum Temperature (X2) 9.89 7.55 76.32 6.89 6.41 93.08 9.41 6.96 74.02 163.95
Relative Humidity (X3) 66.27 10.56 15.93 68.73 17.17 24.99 54.7 12.81 23.42 1474.65
(Rain fall X4) 2.72 8.18 300.61 3.52 9.22 262.04 2.59 9.16 354.82 100.22
3. Results and Discussion
The data collected on weather parameters viz; maximum temperature (X1), minimum temperature (X2), relative humidity (X3) and rainfall (X4) were analyzed for mean, standard deviation and coefficient of variation. Bartlett’s χ2 test is employed to gauge the variability amongst three sites compared with table value at 5% level of significance revealed that there was significant variation in case of minimum temperature (X2), relative humidity (X3) and rainfall (X4). However, no significant variation was found in case of maximum temperature (X1) among the selected sites. The highest average value for maximum temperature (25.66) and minimum temperature (9.89) was observed for
[image:4.595.141.470.73.458.2]Bhunter and highest average value for relative humidity (68.73) and rainfall (3.52) was observed for Katrain. Among the different parameter maximum coefficient of variation of 33.04, 93.08 and 24.99, for (X1), (X2) and (X3) respectively was observed for Bhunter, whereas coefficient of variation of 354.82 for (X4) was observed for Seobag. The minimum value of coefficient of variation of 25.98 for X1 was observed in case of Bhunter, minimum value of coefficient of variation of 74.02 for X2 was observed in case of Seobag, minimum value of coefficient of variation of 15.93 for X3 in case of Bhunter, and minimum value of coefficient of variation of 262.04 for X4 in case of Katrain (Table 1).
[image:4.595.63.551.482.577.2]possible pairs of weather parameters viz., maximum temperature (X1), minimum temperature (X 2), relative humidity (X3), rainfall (X4) were worked out for Bhunter revealed that there is a significant positive correlation between maximum temperature and minimum temperature (r = 0.66); relative humidity and minimum temperature (r = 0.79); rainfall and minimum temperature (r = 0.73) and rainfall and relative humidity (r = 0.90). For Katrain it revealed that there is significant positive correlation between relative humidity and minimum temperature (r = 0.62). Similarly for Seobag correlation matrix revealed that there is a significant positive correlation between maximum temperature and minimum temperature (r = 0.73); relative humidity and rainfall (r = 0.43).
To study the behavior of weather parameters over the period of time (1991-2005, 1971-2008, 1999-2013) for station Bhunter, Katrain and Seobag respectively, only the results on seasonal basis have been presented as they showed higher values of r2 compared to monthly and weekly basis.
The season wise analysis showed that there was no explicit linear trend between weather parameters and time as concluded by Kumar et al. (2010). Similar behaviour of
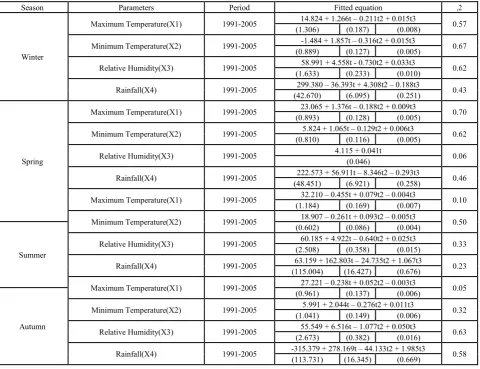
[image:5.595.67.548.375.744.2]increasing and decreasing trends was observed in all the season as the cubic function showed to be the best fit. However, an examination of r 2 values showed that some fraction of variations in weather parameters can be explained by change in time in each season. During winters the result showed that the cubic function was the best fit in all the weather parameters and for all the time periods for Bhunter. Among the analyzed weather parameters maximum temperature recorded significant r2 value of 0.57, for minimum temperature and relative humidity r 2 value was 0.67 and 0.62 respectively. During springs the results showed that the cubic function was the best fit for all the time periods particularly maximum temperature recorded significant r2 value of 0.70 and for minimum temperature it was 0.62. During summers the results showed that the cubic function was the best fit in all the weather parameters for all the time periods the minimum temperature recorded r2 value of 0.50. During autumn the results showed that the cubic function was the best fit in all the weather parameters for all the time periods the rainfall recorded the significant r2 value of 0.58 and relative humidity has r2 value of 0.63 (Table 2).
Table 2. Regression equations for selected weather parameters during different seasons for Bhunter
Season Parameters Period Fitted equation r2
Winter
Maximum Temperature(X1) 1991-2005 14.824 + 1.266t – 0.211t2 + 0.015t3 0.57 (1.306) (0.187) (0.008)
Minimum Temperature(X2) 1991-2005 -1.484 + 1.857t – 0.316t2 + 0.015t3 0.67 (0.889) (0.127) (0.005)
Relative Humidity(X3) 1991-2005 58.991 + 4.558t - 0.730t2 + 0.033t3 0.62 (1.633) (0.233) (0.010)
Rainfall(X4) 1991-2005 299.380 – 36.393t + 4.308t2 – 0.188t3 0.43 (42.670) (6.095) (0.251)
Spring
Maximum Temperature(X1) 1991-2005 23.065 + 1.376t – 0.188t2 + 0.009t3 0.70 (0.893) (0.128) (0.005)
Minimum Temperature(X2) 1991-2005 5.824 + 1.065t – 0.129t2 + 0.006t3 0.62 (0.810) (0.116) (0.005)
Relative Humidity(X3) 1991-2005 4.115 + 0.041t 0.06
(0.046)
Rainfall(X4) 1991-2005 222.573 + 56.911t – 8.346t2 – 0.293t3 0.46 (48.451) (6.921) (0.258)
Maximum Temperature(X1) 1991-2005 32.210 – 0.455t + 0.079t2 – 0.004t3 0.10 (1.184) (0.169) (0.007)
Minimum Temperature(X2) 1991-2005 18.907 – 0.261t + 0.093t2 – 0.005t3 0.50
Summer
(0.602) (0.086) (0.004)
Relative Humidity(X3) 1991-2005 60.185 + 4.922t – 0.640t2 + 0.025t3 0.33 (2.508) (0.358) (0.015)
Rainfall(X4) 1991-2005 63.159 + 162.803t – 24.735t2 + 1.067t3 0.23 (115.004) (16.427) (0.676)
Maximum Temperature(X1) 1991-2005 27.221 – 0.238t + 0.052t2 – 0.003t3 0.05
Autumn
(0.961) (0.137) (0.006)
Minimum Temperature(X2) 1991-2005 5.991 + 2.044t – 0.276t2 + 0.011t3 0.32 (1.041) (0.149) (0.006)
Relative Humidity(X3) 1991-2005 55.549 + 6.516t – 1.077t2 + 0.050t3 0.63 (2.673) (0.382) (0.016)
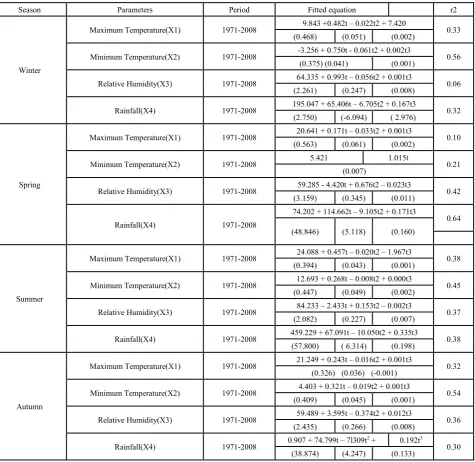
During winters the results showed that the cubic function was the best fit in all the weather parameters for all the time periods in Katrain. Among the analyzed weather parameters minimum temperature recorded r2 value of 0.56. During springs the results showed that the cubic function was the best fit in all the weather parameters except for minimum temperature where the trend was linear with r2 value of 0.21 for all the time periods. Among the analyzed weather parameters rainfall recorded the significant r 2 value of 0.64. During summers the results showed that the cubic function was the best fit in all the weather parameters for all the time periods. During autumn the result showed that the cubic function was the best fit in all the weather parameters for all the time periods in autumns. Among the analyzed weather
parameters minimum temperature recorded the r2 value of 0.54 (Table 3)
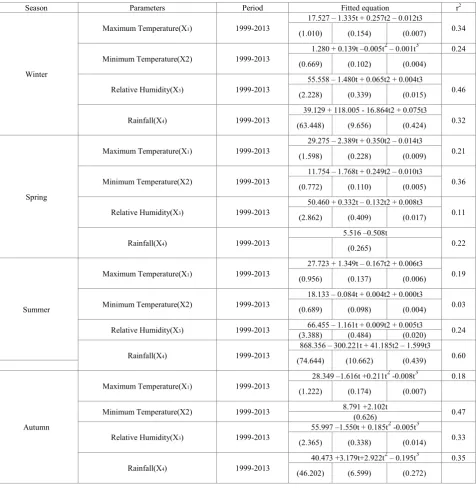
[image:6.595.71.547.270.732.2]During winters the results showed that the cubic function was the best fit in all the weather parameters for all the time periods in Seobag. During springs the result showed that the cubic function was the best fit in all the weather parameters except for rainfall where it was quadratic function with r2 value of 0.22 for all the time periods. During summers the results showed that the cubic function was the best fit in all the weather parameters for all the time periods. Among the analyzed weather parameters rainfall recorded the r2 value of 0.60. During autumn the results showed that the cubic function was the best fit in all the weather parameters for all the time periods (Table 4).
Table 3. Regression equations for selected weather parameters during different seasons for Katrain
Season Parameters Period Fitted equation r2
Winter
Maximum Temperature(X1) 1971-2008 9.843 +0.482t – 0.022t2 + 7.420 0.33 (0.468) (0.051) (0.002)
Minimum Temperature(X2) 1971-2008 -3.256 + 0.750t - 0.061t2 + 0.002t3 0.56 (0.375) (0.041) (0.001)
Relative Humidity(X3) 1971-2008 64.335 + 0.993t – 0.056t2 + 0.001t3 0.06 (2.261) (0.247) (0.008)
Rainfall(X4) 1971-2008 195.047 + 65.406t – 6.705t2 + 0.167t3 0.32 (2.750) (-6.094) ( 2.976)
Spring
Maximum Temperature(X1) 1971-2008 20.641 + 0.171t – 0.033t2 + 0.001t3 0.10 (0.563) (0.061) (0.002)
Minimum Temperature(X2) 1971-2008 5.421 1.015t 0.21
(0.007)
Relative Humidity(X3) 1971-2008 59.285 - 4.420t + 0.676t2 – 0.023t3 0.42 (3.159) (0.345) (0.011)
Rainfall(X4) 1971-2008
74.202 + 114.662t – 9.105t2 + 0.171t3
0.64 (48.846) (5.118) (0.160)
Summer
Maximum Temperature(X1) 1971-2008 24.088 + 0.457t – 0.020t2 – 1.967t3 0.38 (0.394) (0.043) (0.001)
Minimum Temperature(X2) 1971-2008 12.693 + 0.268t – 0.008t2 + 0.000t3 0.45 (0.447) (0.049) (0.002)
Relative Humidity(X3) 1971-2008 84.233 – 2.433t + 0.153t2 – 0.002t3 0.37 (2.082) (0.227) (0.007)
Rainfall(X4) 1971-2008 459.229 + 67.091t – 10.050t2 + 0.335t3 0.38 (57.800) ( 6.314) (0.198)
Autumn
Maximum Temperature(X1) 1971-2008 21.249 + 0.243t – 0.016t2 + 0.001t3 0.32 (0.326) (0.036) (-0.001)
Minimum Temperature(X2) 1971-2008 4.403 + 0.321t – 0.019t2 + 0.001t3 0.54 (0.409) (0.045) (0.001)
Relative Humidity(X3) 1971-2008 59.489 + 3.595t – 0.374t2 + 0.012t3 0.36 (2.435) (0.266) (0.008)
Rainfall(X4) 1971-2008 0.907 + 74.799t – 7l309t
2 + 0.192t3
Table 4. Regression equations for selected weather parameters during different seasons for Seobag
Season Parameters Period Fitted equation r2
Winter
Maximum Temperature(X1) 1999-2013
17.527 – 1.335t + 0.257t2 – 0.012t3
0.34
(1.010) (0.154) (0.007)
Minimum Temperature(X2) 1999-2013 1.280 + 0.139t –0.005t
2 – 0.001t3 0.24
(0.669) (0.102) (0.004)
Relative Humidity(X3) 1999-2013
55.558 – 1.480t + 0.065t2 + 0.004t3
0.46
(2.228) (0.339) (0.015)
Rainfall(X4) 1999-2013
39.129 + 118.005 - 16.864t2 + 0.075t3
0.32
(63.448) (9.656) (0.424)
Spring
Maximum Temperature(X1) 1999-2013
29.275 – 2.389t + 0.350t2 – 0.014t3
0.21
(1.598) (0.228) (0.009)
Minimum Temperature(X2) 1999-2013 (0.772)11.754 – 1.768t + 0.249t2 – 0.010t3 (0.110) (0.005) 0.36
Relative Humidity(X3) 1999-2013
50.460 + 0.332t – 0.132t2 + 0.008t3
0.11
(2.862) (0.409) (0.017)
Rainfall(X4) 1999-2013
5.516 –0.508t
0.22 (0.265)
Summer
Maximum Temperature(X1) 1999-2013
27.723 + 1.349t – 0.167t2 + 0.006t3
0.19
(0.956) (0.137) (0.006)
Minimum Temperature(X2) 1999-2013 (0.689)18.133 – 0.084t + 0.004t2 + 0.000t3 (0.098) (0.004) 0.03
Relative Humidity(X3) 1999-2013 66.455 – 1.161t + 0.009t2 + 0.005t3 0.24
(3.388) (0.484) (0.020)
Rainfall(X4) 1999-2013
868.356 – 300.221t + 41.185t2 – 1.599t3
0.60 (74.644) (10.662) (0.439)
Autumn
Maximum Temperature(X1) 1999-2013
28.349 –1.616t +0.211t2 -0.008t3 0.18
(1.222) (0.174) (0.007)
Minimum Temperature(X2) 1999-2013 8.791 +2.102t (0.626) 0.47
Relative Humidity(X3) 1999-2013
55.997 –1.550t + 0.185t2 -0.005t3
0.33
(2.365) (0.338) (0.014)
Rainfall(X4) 1999-2013
40.473 +3.179t+2.922t2 – 0.195t3 0.35
(46.202) (6.599) (0.272)
Table 5. People’s perception about the variation in productivity in the study area
Activity
Response (%)
Increase in productivity Decrease in productivity No change
20-30% 30-50% >50% 10-20% 20-30% 30-50% >50%
Cereal crops - - - 12.62 26.70 42.72 18
-Fruits 28.64 33 2.43 15.05 7.28 - - 13.60
Vegetables 37.38 53.88 4.37 - - - - 4.37
[image:7.595.69.546.87.578.2]3.1. Analysis of Survey Data
In order to know the impact of climate change and people’s perception about climate change, survey was conducted. Most of the respondents were dependent on the agriculture for their livelihood, implying thereby that stability of weather parameters is very important for sustainability of people’s livelihoods. Results indicated that most of farmers were dependent on rainfall for farming, particularly for fruit growing. Results clearly show that now people are mostly involved in cultivation of high value vegetable crop that generate cash income to the farmer. The people’s perception about area under important Kharif crops perceived decrease in area under cereal crops and the increase under vegetables again suggesting that farmers are now more inclined to adopt cash crops. Due to reduction in grazing area there is sharp decrease in farm animals in study area and the trend is also the result of heavy pressure on common property lands that used to be the major areas for grazing for both farm and nonfarm activities.
All the respondents feel that there has been increase in annual average temperature in the area. Majority of the respondent were of the opinion that soil productivity is declining due to loss of fertility. They also felt that there has been rise in temperature and at the same time incidence and amount of snowfall and rainfall is going down. Also farmer are concerned about increasing menace of wild animals as shown by the weighted score for this response. Respondent were also apprehensive about the possibility of increase in irrigation facility and also the possibility of increase in off farm employment in time to come. Respondent’s perception about status of other related parameters and natural resources suggests that farmers are concerned about the loss of soil fertility, soil erosion, declining availability of irrigation and drinking water.
About 42.72% people perceived there is 30 -50% decrease in productivity of cereal crops. While in case of fruits 28.64% people perceived that there was 20-30% increase in productivity and for same commodity 15.05% people also assumed there was 10-20% decrease in productivity and 13.60% believed there has been no change in productivity for fruits. In case of vegetable 53.88% respondent anticipated that there was 30-50% increase in productivity. The perception about the productivity of pulses showed that 26.70% believing slight increase in productivity while some perceived moderate increase in productivity and some anticipated no change in productivity (Table 5).
4. Conclusions
The variability analysis for the three sites showed significant variations for minimum temperature, relative humidity and rainfall. However, no significant variation was found for maximum temperature which means there was not much variation in maximum temperature for all three sites. The region is prone to cloud burst with high
wind speed, heavy rainfall as it is adjoining to cold desert area of district of Lahaul & Spiti and Kinnaur, which does not allow to increase the temperature.
Regression analysis for the selected weather parameters over time during the period under study on annual basis, monthly and seasonal basis showed cubic trend but the same was not significant. Results of people’s perceptions about climate change showed that peoples in the area perceived change in different weather parameters, especially temperature and rainfall. The results from people’s perception and recorded data are hinting toward the change in weather parameters, though further studies would be needed to pin- point the changes. General perception of the people about the climate change in the study area showed that climate change is affecting significantly the production of crops, soil, natural resources and vegetations etc. In fact peoples are worried about the changes in weather parameters which are adversely affecting crop yields.
REFERENCES
[1] Parry M L., Assessment of potential effects and adaptations for climate change in Europe, The Europe Acacia Report. Jackson Environment Institute, University of East Angila, UK, p 320, 2000.
[2] Intergovernmental Panel on Climate Change, Climate change, The scientific basis, Contribution of Working Group I to the Third Assessment Report of the Intergovernmental Panel on Climate Change. Cambridge: Cambridge University Press, pp 881, 2001.
[3] Salati, E., Â. A. Santos, and I. Klabin, Temas ambientais relevantes. Estudos avançados, 20 (56): 107-127, 2006. [4] Intergovernmental Panel on Climate Change, Climate Change,
The Physical Science Basis, Contribution of Working Group I to the Fourth Assessment Report of the Intergovernmental Panel on Climate Change. UK: Cambridge University Press, pp 996, 2007.
[5] Marengo J A, Jones R, Alves L.M and Valverde M., Future change of temperature and precipitation extremes in South America as derived from the PRECIS regional climate modeling system. International Journal Climatology, 30: 1-15, 2009.
[6] Melanie A. Harsch, Philip E. Hulme, Matt S. McGlone and Richard P. Duncan, Are tree lines advancing? A global meta-analysis of Tree line response to climate warming, Ecology Letters, 12: 1040–1049, 2009.
[7] Nayava J Land Gurung D B., Impact of climate change on production and productivity: A case study of maize research and development in Nepal, The Journal of Agriculture and Environment, Vol: 11, 2010.
[8] Pramanik S K and Jagannathan P., Climate change in India rainfall. Indian Journal of meteorology, 4: 291-309, 1954. [9] Kumar R K, Kumar K and Pant G B., Diurnal asymmetry of
Letters, 21: 677-680, 1994.
[10] Pant G B and Kumar K R., Climate of South Asia. Chichester, UK, John Willey, p 344, 1997.
[11] Sinha, S. K. and M. S. Swaminathan, “Deforestation, Climate Change and Sustainable Nutrition Security: A Case Study of India”. Climate Change 19: 201-209, 1991.
[12] Saseendran S A, Singh K K, Rathore L S, Singh S V and Sinha S K., Effects of climate change on rice production in the tropical humid climate of Kerala, India, Climate Change, 44:495-514, 2000.
[13] Dinar AR, Mendelsohn R, Evenson J, Parikh A, Sanghi K, Kumar J, McKinsey and S Lonergen (eds), Measuring the Impact of Climate Change on Indian Agriculture, Technical Report (402), The World Bank, Washington D C, U S A. p 266, 1998.
[14] Manjappa and Kelaginamani S V., Rainfall characteristics of Sirsi region Karnataka and its effect on productivity of existing cropping pattern system, Karnataka J. Agric. Sci., 18 (2):285-289, 2005.
[15] Hundal T S S and Kaur P., Climate variability and its impact on cereal productivity in Indian Punjab, Journal of current science, 92 (4):25, 2007.
[16] Kumar V, Jain S K and Singh Y., Analysis of long term rainfall trends in India, Journal of Hydrology Science, 55:484-496, 2010.
[17] Pal 1 and Al-Tabba A, Assessing season precipitation trends in India using parametric and non-parametric statistical techniques, Theoretical and Applied Climatology, 100:45-56, 2010.
[18] Geetha lakshmi V., Climate change impact assessment and adaptation strategies to sustain rice production in Cauvery basin of Tamil Nadu, Journal of Current Science, 101 (3):142-347, 2011.
[19] Choudhury B U, Das A, Ngachan S V, Slong A L, Bordoloi J and Chowdhury P, Trend analysis of long term weather variables in mid altitude Meghalaya, North-East India, Journal of Agricultural Physics.12 (1):12-22, 2012.
[20] Asha latha K V, Munisamy G and Bhat A R S, Impact of Climate Change on Rain-fed Agriculture in India: A Case Study of Dharwad. International Journal of Environmental Science and Development, 3(4):368, 2012.
[21] Subhash N, Singh S S and Priya Neha., Rainfall variability and its impact on changes of cropping system in Bihar, India, Journal of Soil Conservation, 40 (1):33-40, 2012,.
[22] Shrestha A B,Wake C P, Dibb J E and Mayewski P A., Precipitation fluctuations in the Nepal Himalaya and its vicinity and relationship with some large –scale climatology parameters. International Journal of Climatology, 20: 317-327, 2000.
[23] Archer DR, Fowler HJ, Spatial and temporal variations in precipitation in the Upper Indus basin, global tele-connections and hydrological implications. Hydrol Earth SystSci8:47–6, 2004.
[24] Basistha A, Ary D S and Goel N K, Analysis of historical changes in rainfall in the Indian Himalaya. International Journal of Climatology.29: 217-222, 2009.
[25] Bhutiyani M R, Kale V S and Pawar N J, Long term trends in maximum, minimum and mean annual air temperature across the northwestern Himalaya during the20th century, Climate change, 65: 217-222, 2007.
[26] Dash S K, Jenamani R K, Kalsi S R and Panda S K, Some Evidence of climate change in Twentieth –century India, Climate Change, 85:299-321, 2007.
[27] Guhathakurta P and Rajeevan M, Trends in the rainfall pattern over India, International Journal of Climatology, 28:1453-1469l, 2008.
[28] Singh P, Umesh K H and Kumar N, Modeling and estimation of different components of stream flow for Gangotri Glacier basin, Himalayas. Hydrological Sciences Journal, 53: 309-322, 2008.
[29] Bhutiyani M R, Kale V S and Pawar N J, Climate Change and the precipitation variations in the North-Western Himalaya, International Journal of Climatology, 30: 535-548, 2010. [30] Dimri A P and Dash S K, Winter time climatic trends in the
western Himalayas, Climate Change. 111(3–4):775–800, 2011.
[31] Khattak M S, Babel M S and Sharif M, Hydro-meteorological trends in the upper Indus river basin in Pakistan, Climate Research, 46:103-119, 2011.
[32] Bostrom A, Morgan M G, Fischhoff B and Read D, What do people know about global climate-change? Mental models, Risk Analysis, 14(6): 959-970, 1994.
[33] Read D, Bostrom A, Morgan M G, Fischhoff B and Smuts T, What do people know about global climate-change? Survey studies of educated lay people, Risk Analysis, 14(6): 971-982, 1994.
[34] Backlund P, Jonetos A and Schimel D, The Affect of climate change on agriculture, land resources, water resources and biodiversity in the United States. Synthesis and assessment product 4.3. Report by the US climate change science program and the subcommittee on global change research. Washington, DC: Department of commerce and Department of Energy. http://www.climate science.gov/library/sap/sap 4-3/final-report/default htm, 2008.
[35] Iverson L R, Prasad A M, Matthews S N and Peters M, Estimating potential habitat for 134 Eastern US tree species under six climate scenario,Forest ecology and management, 254:390-406, 2008.
[36] Shafer S L, Bartleib P J and Thompson R S, Potential changes in the distribution of western north America tree and shrub taxa under future climate scenario. Ecosystem, 4: 200-215, 2001.
[37] White E, Alig R J and Haight R G, The forest sector in a climate changed environment. In: Alig R J. Economic modeling of effects of climate change on the forest sector and mitigation options: A compendium of briefing papers, Gen. Tech. Rep. PNW-GTR-833, Portland or US department of agriculture, forest service, Pacific North West research station:1-35, 2010.
[38] Moritz C, Patton J L, Conray C J, Parra J L,White G C and Bessinger S R, Impact of a century of climate change on small mammal communities in Yosemite National Park, USA, Science, 322:261-264, 2008.
Barlow H S, Hill J K and Thomas C D, Elevation increases in north assemblages over 42 years on a tropical mountain, Proceedings of the National Academy of sciences, 106:1477-1483, 2009.
[40] Hughes L, Biological consequences of global warming: Is the signal already apparent, Trends in ecology and evolution, 15:56-61, 2000.
[41] Lawler J J, Shafter S L, White D, Kareiva P, Maurer E P, Blaustein A R and Bartlein P J, Projected climate change induced faunal change in the western hemisphere, Ecology, 90: 588-597, 2009.
[42] Parmesan C, Ecological and evolutionary responses to recent climate change, Annual review of ecology, evolution and systematic, 37: 637-669, 2006.
[43] Thomas C D and Lennon J L, Birds extend their ranges northwards, Nature,399: 219,1999.
[44] Bhusal, Y.R, Local Peoples’ Perceptions on Climate Change, Its Impacts and Adaptation Measures in Mid-Mountain Region of Nepal (A Case study from Kaski District). B.Sc. Forestry Research Thesis Submitted to Tribhubhan University, Institute of Forestry, Pokhara, Nepal, 2009. [45] Joireman J, Truelove H B and Duell B, Effect of outdoor
temperature, heat primes and anchoring on belief in global warming. Journal of Environmental Psychology, 30 (4): 358– 367, 2010.
[46] Krosnick J A, Holbrook A L, Lowe L and Visser P S, The origins and consequences of democratic citizens’ policy agendas: a study of popular concern about global warming, Climatic Change, 77 (1): 7–43, 2006.
[47] Li Y, Johnson E J and Zaval L, Local warming daily temperature change influences belief in global warming. Psychological Science, 22 (4): 454–459, 2011.
[48] Risen J L and Critcher C R, Visceral fit: while in a visceral
state, associated states of the world seem more likely. Journal of Personality and Social Psychology, 100 (5): 777–793, 2011.
[49] Shum R Y, Effects of economic recession and local weather on climate change attitudes, Climate Policy, 12: 38–49, 2011. [50] Zahran S, Brody S D, Grover H and Vedlitz A, Climate change vulnerability and policy support, Society and Natural Resources, 19(9): 771-789, 2006.
[51] Maraun D, Rust H W and OsbornT J, Synoptic airflow and UK daily precipitation extremes: Development and validation of a vector generalized linear model, Extremes, 13: 133–153, 2010.
[52] West C T, Va´ squez-Leo´ n M, Testing farmers’ perceptions of climate variability: a case study from the Sulphur-Springs Valley, Arizona. In: Strauss S and Orlove B S (eds.), Weather, Climate, Culture, Oxford: Berg, p. 233–250, 2003.
[53] West C T, Roncoli C and OuattaraF,Local perceptions and regional climate trends on the Central Plateau of Burkina Faso,L and Degradation and Development, 19(3): 289-304, 2008.
[54] Goebbert K, Jenkins Smith H C, Klockow K, Nowlin M C and Silva C L, Weather, climate, and worldviews: the sources and consequences of public perceptions of changes in local weather patterns, Weather, Climate, and Society,4: 132–144, 2012.
[55] Haque M A, Yamamoto S, Malik A and Sauerborn R, Households' perception of climate change and human health risks: A community perspective, Environmental Health, 11:1, 2012