June 26, 1998
SRC
Research
Report
153
Continuous Monitoring and
Performance Specification
Sharon E. Perl, William E. Weihl, and Brian Noble
d i g i t a l
Systems Research Center 130 Lytton AvenuePalo Alto, California 94301
Systems Research Center
The charter of SRC is to advance both the state of knowledge and the state of the art in computer systems. From our establishment in 1984, we have performed ba-sic and applied research to support Digital’s business objectives. Our current work includes exploring distributed personal computing on multiple platforms, network-ing, programming technology, system modelling and management techniques, and selected applications.
Our strategy is to test the technical and practical value of our ideas by building hardware and software prototypes and using them as daily tools. Interesting sys-tems are too complex to be evaluated solely in the abstract; extended use allows us to investigate their properties in depth. This experience is useful in the short term in refining our designs, and invaluable in the long term in advancing our knowl-edge. Most of the major advances in information systems have come through this strategy, including personal computing, distributed systems, and the Internet.
We also perform complementary work of a more mathematical flavor. Some of it is in established fields of theoretical computer science, such as the analysis of algo-rithms, computational geometry, and logics of programming. Other work explores new ground motivated by problems that arise in our systems research.
Continuous Monitoring and
Performance Specification
Sharon E. Perl, William E. Weihl, and Brian Noble
Author Affiliation
Brian Noble is currently an Assistant Professor in the Electrical Engineering and Computer Science Department at the University of Michigan. He can be reached as [email protected].
c
Digital Equipment Corporation 1998
Abstract
CMon is a general-purpose performance monitoring system. It enables monitoring of long-running programs in a setting where the experimenters who are interested in the performance data are different from the users who run the programs that generate the data. Among other things, this permits programs to be monitored under real workload conditions.
PSpec is a language and set of tools for performance assertion checking, an approach to automating the testing of performance properties of complex systems. It can be used in conjunction with the CMon system to produce a performance monitor that runs continuously, over the lifetime of a program, and automatically detects performance anomalies.
Contents
1 Introduction 1
2 Continuous Monitoring 2
2.1 Design . . . 3
2.2 Implementation Issues . . . 5
3 Performance Specification 6 3.1 Overview . . . 7
3.2 Concepts . . . 8
3.3 Language Features . . . 8
3.4 Support for Continuous Monitoring . . . 10
3.5 The Checker . . . 12
4 Experience 12 4.1 Argo . . . 13
4.2 Automounter . . . 14
4.3 Juno-2 . . . 15
4.4 Lectern . . . 16
5 Evaluation and Lessons 20 5.1 Successes . . . 20
5.2 Lessons Learned . . . 21
6 Conclusions 22 7 Acknowledgments 23 A PSpec Language Specification 24 A.1 Definitions . . . 24
A.2 Types . . . 25
A.3 Declarations . . . 25
A.4 Imports . . . 30
A.5 Assertions . . . 30
A.6 Solve Declarations . . . 30
A.7 Print Statements . . . 31
A.8 Specifications . . . 31
A.9 Expressions . . . 31
A.10 Grammar . . . 40
B PSpec Tools - pcheck, peval, psolve 44
Name . . . 44
Syntax . . . 44
Description . . . 44
Flags . . . 46
Error Messages . . . 48
Notes . . . 48
Monitoring . . . 48
More on Psolve . . . 50
See Also . . . 52
C CMon Tools - telemonitor, telemonreg, snarflog 53 C.1 telemonitor . . . 53
C.2 telemonreg . . . 57
C.3 snarflog . . . 57
1
Introduction
In this report we describe a performance monitoring system with several key prop-erties. The system allows monitoring of long-running programs, such as servers, editors, drawing programs, and browsers, where the experimenter would like con-tinuous or periodic analysis of performance. It automates the analysis of the per-formance data so that the experimenter need not constantly attend to the monitor-ing system in order to detect problems. The system also permits the users of the program—who can generate data under real workload conditions but who don’t want to be bothered with performance data gathering—to be different from the experimenters who want to process the data generated by the users as it becomes available.
The system we built consists of two separate tools. The first is called CMon (Continuous Monitoring). It provides the ability to capture logs produced by ap-propriately instrumented programs while the programs are being run by users, and direct the logs to experimenters who are interested in processing them. The ex-perimenters can set up tools that process the logs and provide notification when performance problems occur. CMon is designed to work with a wide variety of log processing tools.
The second tool is a log processing tool designed specifically for use in the Continuous Monitoring setting. The tool is part of a system called PSpec (Per-formance Specification), which embodies an approach to automating the testing of performance properties of complex systems. System designers write assertions that capture expectations for performance, which can then be checked automati-cally against monitoring data to detect potential performance bugs. Automatiautomati-cally checking expectations allows a designer to test a wide range of performance prop-erties as a system evolves: data that meets expectations can be discarded automat-ically, focusing attention on data indicating potential problems.
The PSpec system consists of a language for writing performance assertions together with tools for testing assertions and estimating values for constants in as-sertions. The language is small and efficiently checkable, yet capable of expressing a variety of performance properties. The PSpec tools are designed to be useful both online in a continuous-monitoring setting as well as offline in settings where logs are not processed until after the programs that generated them have exited (e.g., during performance regression testing).
work that has been done.) In addition, most (perhaps all) computer systems in-clude support for performance monitoring of some kind, and additional tools are available from third-party vendors. It is beyond the scope of this paper to include a survey of this vast body of work. We believe, however, that the combination of PSpec and CMon is interesting in the following ways:
• CMon provides a generic mechanism that can be used by programmers and developers of any system or application to acquire and process monitoring logs.
• CMon permits a monitoring log to be processed online by an arbitrary pro-gram, supporting the construction of a flexible suite of data analysis and notification mechanisms.
• The continuous monitoring features of PSpec provide a language that is ef-ficient, expressive, and easy to use for analyzing monitoring logs to detect performance anomalies and compute other useful data from logs.
Together, PSpec and CMon provide a powerful and general mechanism for au-tomatically processing performance data obtained online under production work-loads.
The initial PSpec work was done as part of the first author’s Ph.D. thesis [8] and reported on in SOSP’93 [9]. The idea of continuous monitoring arose in the context of that work. Preliminary design discussions for the CMon system took place in 1993, and detailed design and implementation were done from mid-1994 through mid-1995. Changes to PSpec to support continuous checking were implemented in early-to-mid 1995.
In Section 2 we describe the design of the CMon system and discuss some implementation details. Section 3 gives an overview of PSpec, with a description of the extensions specifically designed for continuous monitoring. Section 4 de-scribes several experiments in using the systems to do continuous monitoring and performance assertion checking. Section 5 discusses what we accomplished and what we learned from this work. Section 6 concludes. The Appendices contain a reference manual for the PSpec language, as well as the manual pages for the PSpec and CMon tools.
2
Continuous Monitoring
as soon as possible. This goal necessitates a certain degree of “hands-free” op-eration, since it is unreasonable to expect experimenters to be attending to perfor-mance monitoring at all times. We wanted to monitor programs remotely, so exper-imenters could be different from users of the programs. We wanted the monitoring to have a minimal impact on the programmer (in terms of setting up a program for continuous monitoring) and on the program (in terms of performance and robust-ness). Finally, we wanted to allow the use of a wide variety of tools for processing the performance data gathered during monitoring, so that a single continuous mon-itoring mechanism could support many kinds of performance data processing.
The remainder of this section describes the system that we designed and built to meet these goals. The system runs on MIPS-based DECstation workstations running the Ultrix operating system and on Alpha-based workstations [12] running Digital Unix [2] (formerly OSF-1). Appendix C contains the manual pages for the CMon tools.
2.1
Design
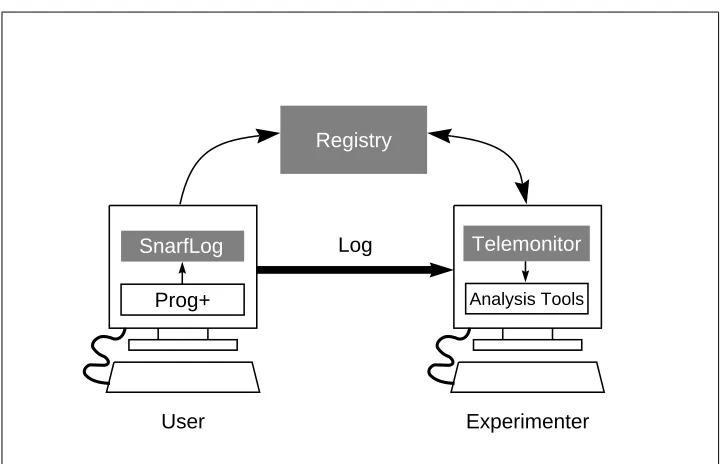
The CMon system has three major kinds of components, illustrated in Figure 1. Snarflog is the interface between the program being monitored and the rest of the CMon system. A telemonitor is a kind of control panel through which an experi-menter can direct continuous monitoring experiments. A registry connects snarflog instances with telemonitor instances. Typically there are multiple snarflogs, one for each instance of a monitored program, and multiple telemonitors, at least one for each experimenter. There is a single registry for any collection of snarflogs and telemonitors that need to communicate with one another. A snarflog communi-cates with at most one telemonitor at a time. A telemonitor may be communicating with several different snarflogs at once.
A snarflog has two jobs: to direct its associated log to interested telemonitors, and to make the monitored program robust to failures of telemonitors or registries. Our philosophy is that if a piece of the CMon system fails, the monitored program should continue to work, though perhaps some of the log it produces will be lost. This supports our goal of having minimal impact on the performance, robustness, and usability of the monitored program.
Analysis Tools
Log
User Experimenter
Registry
Prog+
[image:12.612.125.487.124.356.2]SnarfLog Telemonitor
Figure 1: The CMon System. CMon components are in black.
log stream (since the log header may contain information necessary for interpreting the log records). Snarflog communicates with the registry when it starts up, so as to make its presence known to the rest of the CMon system. Thereafter, it can receive requests from telemonitors to start or stop sending log data. Once one telemonitor stops receiving log data another can start. Snarflog runs as long as the monitored program is producing a log.
The mechanism for causing programs to produce logs is outside of the CMon system proper. The system that we built uses two different mechanisms. One is an in-house tool called etp (“elapsed time profiler”), which modifies a program binary to produce log records of procedure calls and returns. Another is the trace facility, available in many varieties of Unix systems, which produces log records of system calls and returns.
A programmer who wants to arrange for a program to be monitored would do the following. First, run a telemonitor and set up a class that specifies the program to be monitored (probably by name) and the desired tool for processing the output. This information can be saved in a telemonitor configuration file. Next, arrange that the program is always run in conjunction with snarflog—there are automatic tools provided with the CMon system that generate scripts to do this. Finally, make sure that a registry and a telemonitor are running while the log data from running programs is to be collected.
2.2
Implementation Issues
CMon’s implementation is fairly straightfoward. We chose to implement all of the programs (snarflog, telemonitor, and the registry) in the Modula-3 programming language [7], using Network Objects [1] (Modula-3’s object-oriented remote pro-cedure call mechanism) for communication among the programs. The implemen-tation was done in 1994, and there was no clearly better choice of programming technology at the time for our prototype system. If we were starting on the imple-mentation today, in 1998, we would probably make different choices. In particular, we would probably implement the telemonitor UI as a Java applet, thereby making it accessible through a web browser.
The implementation of the telemonitor required careful attention to concur-rency and locking, to handle all of the asynchronous events correctly while keep-ing the UI responsive. Other than this, the more interestkeep-ing implementation issues involved the handling of logs.
Two other implementation issues arose specifically in the context of handling logs produced by etp-instrumented programs. First, in order for snarflog to recog-nize log headers and log record boundaries it is necessary to disable etp’s normal log compression. This was easily accomplished by an existing switch to etp. Sec-ond, etp puts timestamps on all of its log records, recording a relatively small time counter (a few seconds worth) and reconstructing higher order bits of timestamps by inferring when the counter wraps. Initially, etp ensured that at least one log record was generated within each counter wrap interval, so that all wraps could be inferred. But this meant that during a long idle period for a program, a steady stream of log records was still being produced just for the purpose of detecting timer wraps. This seemed wasteful of resources when continuously monitoring a long-running program. At our request, etp’s designer modified etp so that it instead counts the number of counter wraps during an idle period and emits just a single log record counting the number of wraps rather than one log record per wrap inter-val. This reduces logging and continuous monitoring overhead significantly while a program is idle.
3
Performance Specification
We now turn to the second portion of this work: the PSpec tools. The PSpec system embodies an approach that we call performance assertion checking. In this approach, system designers write assertions to capture their expectations about per-formance. These assertions are then checked automatically, focusing the designers’ attention on monitoring data that indicate potential performance bugs. Our inten-tion is that once a good set of asserinten-tions for a system is in place, they should be monitored continuously, while the system is in actual use. This enables perfor-mance problems to be detected soon after they appear.
While the PSpec language and tools were designed before the CMon system, we had in mind that they would eventually be used for continuous monitoring. However, PSpec is useful in other contexts as well:
1. Performance regression testing: when a system is changed, performance as-sertions can be rechecked to ensure that the system still meets expectations.
2. Performance debugging: successively more detailed performance assertions may be helpful for pinpointing the location of performance problems in the system.
Solver Evaluator Checker Program +
Monitoring
Perf. Spec.
assertion failures Log
[image:15.612.124.488.127.356.2]computed values
Figure 2: The PSpec approach
An earlier paper [9] gives a good overview of the PSpec language through a series of examples. That paper was written before the language and tools fully supported continuous monitoring. In this report, we briefly review the basic con-cepts of the language and then present the extensions for continuous monitoring. Appendix A gives a complete description of the current PSpec language, while Appendix B contains the manual pages for the PSpec tools.
3.1
Overview
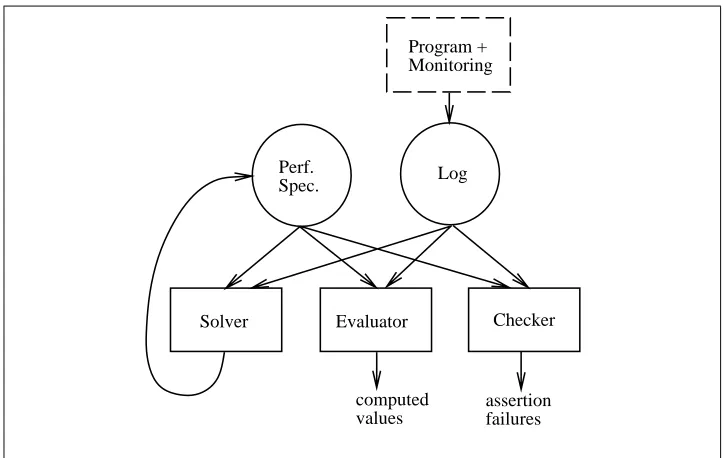
The PSpec system, illustrated in Figure 2, has several components: performance specifications, monitoring logs, and the solver, evaluator, and checker tools.
A monitoring log represents an event stream, which is an abstraction of a pro-gram’s execution that contains the information relevant to expressing performance assertions.
Performance specifications contain assertions about performance written in the PSpec language. The language is a notation for expressing predicates about event streams. Many common kinds of performance metrics, such as elapsed time, throughput, utilization, and workload characteristics, can be expressed.
top of available logging facilities. PSpec is most useful with logging facilities that permit user-defined event types, but also works if only a fixed set of event types is available. In particular, PSpec works with the etp and trace monitoring facilities mentioned earlier.
The checker is the PSpec tool of interest for continuous monitoring. It takes as input a performance specification and a monitoring log; it produces as output a report of which assertions fail to hold for the run represented by the log. The checker was used in our continuous monitoring experiments. It is discussed further is Section 3.5 and its manual page appears in Appendix B.
The evaluator and solver are useful for performance debugging and for writ-ing performance specifications. The evaluator provides a read-eval-print loop for evaluating expressions against data in a log. The solver uses logged data to help a specification writer determine values for numeric constants in assertions. Manual pages for these tools appear in Appendix B and a sample evaluator session appears in Appendix D, but we do not discuss them further in this paper.
3.2
Concepts
An event stream is a sequence of typed events. These events have named, nu-meric attributes. An event contains information recorded at a single point in a program’s execution. Depending upon the available monitoring facilities, a spec-ification writer may or may not have control over what types of events appear in event streams.
An interval consists of all events in a log between a designated start event and an end event. Intervals have named types and named metrics. An interval’s metric values are based on the events in that interval. Interval types are defined by a spec-ification writer; they are the primary abstraction used in writing PSpec assertions. Typically, a specification writer decides what to assert about a programs’s perfor-mance, defines interval types that capture the necessary metrics, and then writes predicates that apply to a set of intervals.
3.3
Language Features
perfspec FSRead
timed event StartRead(tid, size);
EndRead (tid);
event CacheHit(tid); interval Read =
s: StartRead, e: EndRead where e.tid = s.tid
metrics
time = ts(e)−ts(s), size = s.size,
hit ={count c : CacheHit where c.tid = s.tid}6=0
end Read;
assert{& r : Read : r.time≤10 ms};
{mean r : Read : r.time}≤5 ms;
{& r : Read where r.size≤4096 : r.time≤8 ms};
{count r : Read where r.hit}/{count r : Read}≥0.75
[image:17.612.127.485.127.377.2]end FSRead
Figure 3: An example performance specification.
An event type declaration introduces a type name and a list of attribute names. The example specification in Figure 3 includes declarations that introduce the event names StartRead, EndRead, and CacheHit (the first two events are declared to have timestamps, while the third does not). The names in parentheses, tid and size, are the attribute names for the event types. The rules for matching event types in a performance specification with events in event streams are specific to the particular monitoring log format.
An interval type declaration introduces a new interval type, which identifies a set of intervals resulting from an event stream. The declaration includes predicates for determining whether an event in the log is the start or end event for an interval of the type, and expressions for computing the metric values for an interval of the type.
of intervals in an event stream that contains events from multiple threads.
The example interval declaration contains three metric definitions, for metrics named time, size, and hit. Each of an interval’s metrics is evaluated over the events spanned by the interval. The time metric is defined to be the difference of the timestamps of end and start events of the interval, i.e., the duration of the inter-val. The size metric is the value of the size attribute from the interval’s start event (which records how many bytes are being read). The hit metric records a boolean value that indicates whether a CacheHit event with the appropriate thread identifier occurred between the start and end events for the interval. The intention is that a CacheHit event would be generated in the event stream if the Read operation could be serviced entirely from an in-memory cache, without having to go to disk.
An assertion in a performance specification is a predicate on the events and intervals in event streams. One simple kind of assertion is a predicate that applies to all events or intervals of a particular type in a log. For example, the first assertion following the assert keyword in Figure 3 can be read as: “for all intervals r of type Read, the value of r ’s time metric is at most 10 milliseconds”. This assertion is an example of an aggregate expression, which provides a way to generate a sequence of values and combine them with an operator. The remaining assertions in the example also use aggregate operators: to compute the mean value of a series of metrics, to express a “forall” type assertion over a restricted series of intervals, and to count the number of intervals in a restricted series.
This section has glossed over many details of the PSpec language in the interest of conveying the main ideas in a brief space. See Appendix A and the paper cited earlier for more extensive descriptions of the language.
3.4
Support for Continuous Monitoring
The basic interval types described above permit interval type declarations—and therefore, metric calculations—based on actual events occuring in monitoring logs. For continuous monitoring, we would also like to write assertions about what hap-pens in a monitored program over fixed periods of time. For this purpose, we introduce time-based interval types, which effectively allow us to divide an event stream into chunks based on time, and then write assertions about each of those chunks.
interval Chunk =
s: every 1 day, e: after 1 day
metrics
hitratio = {count r : Read where r.hit}/{count r : Read}
end Chunk.
Figure 4: A time-based interval type declaration.
Figure 4 shows an example of a time-based interval declaration. It declares an interval of type Chunk to start every day and to last for a day. The start and end events are new virtual time events with type names start$Chunk and end$Chunk. The start events occur in the event stream at intervals of one day and each cor-responding end event occurs one day after the start event, so each interval spans one day. As usual, an interval of type Chunk includes all events between its start and end events, including other virtual time events. The metric hitratio calculates the hit ratio over the course of a day for file system Read operations. Using this declaration we could write the assertion:
assert {& c : Chunk : c.hitratio≥0.75}.
That is, for all intervals c of type Chunk, the value of c’s hitratio metric is at least 0.75. This is similar to the last assertion in Figure 3, except that it is more suitable to being checked by a continuous monitor because its truth can be evaluated each time a Chunk interval is generated (any interval for which the hit ratio is less than 0.75 falsifies the assertion). The earlier assertion is defined to apply over an entire log, and couldn’t be checked until the program generating the log had terminated. We hope that the file system is a very long-running program, so we wouldn’t want to have to wait until it exited to check a performance assertion about it. Also, the time-based assertion is more explicit about the range of Read operations over which the ratio should be computed.
Other variants of time-based intervals are possible. For example, to do periodic monitoring one could define an interval that starts every day and ends after one hour. To have a sliding window, an interval could start every hour and end after one day. Intervals that start with a particular real event type and end after a fixed amount of time, or start every given time interval and end with a real event type may also be useful. Note that in order to connect intervals to real time (for example, an interval that starts at 2 am every morning), there must be events in the log that record real timestamps in their attributes.
re-quire some care. Arbitrarily dividing a log into chunks at specific time intervals may leave the chunks with partial event-based intervals, which will then not be recognized as sub-intervals of the chunks. So a specification writer must think carefully about the meaning of metrics for time-based intervals. This problem shows up in the example presented in Section 4.4.
3.5
The Checker
The job of the PSpec Checker is fairly straightforward: to report which assertions in a specification fail to hold for a monitoring log. It also attempts to provide some information (log context) that can help an experimenter determine why an assertion failed.
As the checker reads through a monitoring log, it incrementally evaluates all expressions in the specification that refer to events in the log. This includes aggre-gate expressions over intervals such as the ones in the examples above. As each interval’s end event is encountered, the metrics for the interval are evaluated, and any aggregate expressions using the interval’s metrics are evaluated incrementally. The “forall” (&) aggregate operator is treated specially when the checker is run-ning in “continuous mode.” In that mode, which is intended for use with continuous monitoring tools, whenever a conjunct of a “forall” aggregate expression evaluates to false, the checker reports an assertion failure and the value of the interval that caused it. It continues to evaluate further conjuncts of the aggregate expression as they are encountered, even though the ultimate value of the aggregate expression is known to be false from the first false conjunct. In this way, details of any further assertion failures are also reported.
All other types of assertions (those that are not aggregates with the “forall” operator) are evaluated after the end of the monitoring log is reached; this may be when the monitored program exits, or when an experimenter using a telemonitor disconnects from the monitored program.
4
Experience
We have applied the CMon and PSpec tools to four systems used at SRC:
• Argo, a teleconferencing system that provides real-time audio and video con-nections among multiple users; it has stringent performance requirements.
• Juno-2, a constraint-based drawing system [4]; it uses a numerical constraint solver whose performance is critical to the interactive nature of the applica-tion.
• Lectern, a document viewing system designed to provide fast high-quality display of documents; it also has stringent performance goals.
Argo, Juno-2, and Lectern were all developed at SRC. The NFS automounter is a standard system utility.
In the subsections below, we briefly summarize our goals in monitoring these systems and how we accomplished the monitoring.
4.1
Argo
The goal of the Argo system is to allow medium-sized groups of users to collabo-rate remotely from their desktops in a way that approaches as closely as possible the effectiveness of face-to-face meetings [3]. In support of this goal, Argo com-bines high quality multi-party digital video and full-duplex audio with telepointers, shared applications, and whiteboards in a uniform and familiar environment. As for other teleconferencing systems, jitter is an important issue for Argo; variations in the rate at which packets (both video and audio) are delivered can be quite annoy-ing to users. Audio jitter is particularly noticeable, and there had been occasional problems with the audio, so our experiments focused on argohear, the subsystem responsible for delivering audio to the user. Our goal was to discover how much jitter was occuring, how frequently it occurred, and to isolate its causes.
The monitoring was accomplished by using etp to instrument the argohear pro-gram, then setting up argohear to run under the CMon system. No source code changes were required. Five people ran the instrumented argohear program for one week. A telemonitor was used to collect the data and to save it to disk; data from each separate run of argohear was saved in a separate log file. The performance of argohear itself was minimally affected by the monitoring.
Note that the PSpec checker was not invoked directly by the telemonitor; we experimented with argohear early in this work, and the checker did not support continuous checking at that point. Given the way we monitored argohear, we could have accomplished the same thing without the CMon infrastructure just by saving log files in the shared file system. However, our experiments with argohear helped us debug the CMon system and provided useful insights into how continuous mon-itoring could be done better.
4.2
Automounter
We decided to try monitoring the automounter for several reasons: it was not a “home-grown” application; it required different monitoring (the system “trace” utility for tracing system calls rather than etp for tracing procedure calls); and at the time SRC had been having a series of serious network problems that we thought might have been detected by watching for unusual delays in the automounter. Our hope was that early detection would have allowed a problem to be fixed before the network died altogether. The latter was the primary motivation; since the network was having problems that manifested themselves as serious performance problems (to the point of making many machines unusable), we wanted to see if our tools could both provide an early warning as problems were developing and also help track them down.
We monitored the automounter by running “trace”, an Ultrix utility that traces the system calls from a specified process. By tracing the activity of the automounter process, we were able to identify intervals corresponding to the automounter re-sponding to a request to mount a particular volume. One common symptom ob-served during periods of network difficulties was a very long delay in the auto-mounter responding to requests to mount a volume, so watching for this seemed like a good way of detecting intermittent network outages.
ASCII and is much more verbose than etp’s format.) Finally, the underlying cause of our network problems was found and fixed while we were working on setting up monitoring for the automounter. We monitored the automounter for a few days on a small number of machines, but no problems were detected. Since we were not yet in a position to set up continuous monitoring and to use the system to monitor the network on a regular basis, we decided to focus on completing the CMon system.
4.3
Juno-2
A key research question about Juno-2 is whether the constraint solver will scale. The goal of monitoring was to understand the performance of the constraint solver better by collecting data from program runs involving real data with real users, not just from a small suite of test cases used by the developers. The developers wanted to obtain data about the sizes of the constraint systems that arise in real use as well as the elapsed time required to solve those systems.
As with argohear, the PSpec checker did not support continuous checking when we started monitoring Juno-2, so the logs were simply saved by the telemonitor in the file system so they could be analyzed later. The Juno-2 designers set things up to monitor two procedures: one was the main constraint solver and the other was introduced simply so that its arguments (the number of constraints and variables in a constraint system, and the number of Newton iterations required to solve the system) could be recorded in the log. The main goal of the monitoring was to see if the data obtained previously from experiments with a small set of constraint systems were representative of real-world constraint systems. As a minor side benefit, the telemonitor was configured to send mail to one of the Juno-2 designers whenever someone started up Juno-2, so he could keep track of how much people were using it.
4.4
Lectern
One of the main performance goals for Lectern was to display a page in less than one second. We decided to monitor Lectern to test if the goal was being met during actual use of the system by real users. We also wanted to collect data on peo-ple’s use of the program. For example, do they tend to browse documents, flipping quickly from one page to the next, or do they read them in depth, spending signif-icant amounts of time on each page? How do they use the user interface? And so on.
4.4.1 Monitoring Setup
The monitoring was accomplished by using etp to instrument the Lectern exe-cutable, tracing four procedures. One of the procedures corresponds to virtually all the time involved in displaying a page. Another corresponds to the user in-putting a command. The other two correspond to particular commands for moving among pages and documents. The arguments of the procedures recorded by etp included enough information to be able to tell what command was requested and whether two successive display requests were for the same page (e.g., to scroll within a page) or for different pages.
We replaced the normal Lectern executable with a shell script that ran the strumented executable together with snarflog, making the log available to any in-terested telemonitors. We set up a telemonitor to pass the Lectern logs to the PSpec checker, running the checker in continuous mode to check that the display time for each page was less than a second. We also used the checker to produce a report once per day with a summary of the usage during that day, including histograms and averages of the time spent on each page and the number of pages accessed per document, as well as a histogram showing the usage frequency of each of the user-level commands in the user interface.
4.4.2 Assertion Checking
The performance specification used to check the assertions and compute the his-tograms is shown in Figures 5 and 6. Four procedures are monitored: ApplyOp, which does the work of dispatching a user-level command; lgm, which does vir-tually all of the work of reading a page image from a file and rendering it to the screen; ReadDoc, which is invoked when a new document is loaded; and GotoPage, which is invoked whenever the user either scrolls on the current page or moves to a new page.
perfspec lectern
proc Lectern ApplyOp(lect, op, time, event);
proc ImageRd lgm(t, width, height, hasMap) returns pixmap; proc Lectern ReadDoc(lect, path, time, from);
proc Lectern GotoPage(lect, page, class, noisy) returns okay;
interval Apply = intv@Lectern ApplyOp metrics
op = s.op,
% msTime is the time in milliseconds, truncated to the nearest multiple of 10. msTime = trunc((timestamp(e)−timestamp(s))/10ms)∗10
end Apply;
interval lgm = intv@ImageRd lgm metrics
width = s.width, height = s.height,
area = s.width∗s.height,
msTime = trunc((timestamp(e)−timestamp(s))/10ms)∗10
end lgm;
interval Page =
s: call@Lectern GotoPage, e: call@Lectern GotoPage where e.page !=s.page
metrics
time = trunc((timestamp(e)−timestamp(s))/1sec)
end Page;
interval Doc =
s: call@Lectern ReadDoc, e: call@Lectern ReadDoc
metrics
pages ={count p : Page}+1
[image:25.612.130.535.147.634.2]end Doc;
interval Chunk =
s: every 1 day, e: after 1 day
metrics
% histogram of opcodes:
applyOps ={+a : Apply : a.op−→1},
% histogram of times for lgm:
lgmTimes ={+l : lgm : l.msTime−→1},
% histogram for each image size of times for lgm:
lgmTimeByArea ={+l : lgm : l.area−→(l.msTime−→1)},
% average pages read per document:
pagesPerDoc ={count p : Page}/({count d : Doc}+1),
% distribution of pages per document: pageDist ={+d : Doc : d.pages−→1},
% distribution of time per page:
pageTimes ={+l : Page : l.Time−→1}
end Chunk;
assert “1-day stats”:{& c : Chunk : false};
assert “1-sec max for display”:{& l : lgm : l.msTime<=1000};
[image:26.612.132.487.203.579.2]end lectern;
implicitly declares two event types, one of the form call@P (corresponding to a call of P) and the other of the form ret@P (corresponding to a return of P). The event type call@P has attributes as listed in the procedure declaration; the event type ret@P has an attribute if the optional returns clause is provided. These event types can be used in interval declarations and in defining metrics or writing assertions. Declaring a procedure P also declares an interval type intv@P, with start and end events named s and e, that corresponds to a single invocation of that procedure (from a call to a return in the same thread); the intervals Apply and lgm use this predeclared interval type to define a new interval subtype with additional metrics (e.g., Apply = intv@Lectern ApplyOp).
The call and return events and interval types resulting from the four declared procedures are used to define a number of additional interval types: Apply, which corresponds to a single invocation of ApplyOp; lgm, which corresponds to a single invocation of the lgm operation; Page, which corresponds to the interval from one call of GotoPage to the next; and Doc, which corresponds to the interval from one call of ReadDoc to the next. Informally, Apply is the interval during which a single user command is processed; lgm is the interval during which a page is read from a file and rendered to the screen; Page is the interval during which a single page is displayed on the screen; and Doc is the interval during which a single document is being examined by the user. The metrics for each of these intervals record or compute various useful pieces of information; for example, Apply, lgm, and Page all record the duration of the interval, lgm computes the size of the displayed image, and Doc computes the number of pages examined for the document.
An additional interval, Chunk, is defined to capture all of the events during a one-day period. It has a number of metrics that compute statistics about the use and behavior during that period. For example, the metric applyOps provides a his-togram of the different opcodes, mapping each opcode to a count of the number of times it was used during the one-day period. This metric definition uses a fea-ture of the PSpec language called a mapping (defined in the language reference in Appendix A). Briefly, a mapping is a partial function from integers to values; op-erators are provided to create single-element mappings and to combine mappings. Mappings can be used to construct histograms by making the domain of the map-ping identify the thing to be counted, by making the range of the mapmap-ping be 1 for each thing, and by combining the mappings with the+operator.
Notice that some Doc and Page intervals may overlap the boundaries of Chunk intervals and, hence, would not be contained in any Chunk interval. As a result, some pages and documents would not be accounted for in the statistics of any Chunk interval. For this application it doesn’t really matter, but we point it out as an example of the subtleties of writing useful time-based interval definitions.
of Lectern is running. The first, called 1-day stats, is a hack for printing each day’s Chunk. It asserts false for every Chunk interval. Since false always fails, this forces the system to report an assertion failure for every Chunk interval. When an assertion fails for an interval, the checker prints out the interval’s metrics; thus, all of the statistics computed for each one-day period are printed out at the end of the period.
The second assertion, called 1-sec max for display, asserts that the time for an lgm interval is no more than one second. Whenever an lgm interval fails this assertion, the checker prints out the metrics for the interval.
4.4.3 Results of Monitoring
We found no significant performance bugs in several months of monitoring Lectern. All instances of Lectern started by users in our laboratory were monitored during this period. Multi-second display times did occur, but rarely, and then they were only slightly greater than one second and never greater than two seconds. The information about people’s use of the program turned out to be less useful than we had hoped. Lectern was quite mature when we started monitoring it, and by the time we had accumulated enough data for it to be interesting, the designers of Lectern were no longer interested in tuning its user interface.
5
Evaluation and Lessons
In this section we evaluate our tools based on our experience using them as de-scribed in the previous section and discuss the lessons we learned about how con-tinuous monitoring needs to be done for it to be effective.
5.1
Successes
From the programmer’s perspective, using CMon in combination with etp was easy. For most applications, properties of interest could be monitored and tested by using etp to trace appropriate procedure calls; the application source did not need to be changed. (Running etp is straightforward.) Occasionally it was necessary to add “dummy” procedure calls to mark the occurrence of particular events.
The impact on programs was also small. Except for the overhead of logging events and sending them to a telemonitor (about 20 microseconds per log record on a 40-MHz MIPS R3000-based DECstation), CMon caused no significant perfor-mance impact. As long as the granularity of logging was reasonably coarse, over-head was undetectable by users. In all the applications we studied, the properties of interest could be tested using very coarse-grained logging. As for robustness, there were no reports of the CMon tools causing crashes or other problems with monitored applications. The system was designed so that snarflog would insulate applications from problems arising in the rest of the CMon system. We found this property to be quite useful while developing the system, since we frequently had cases where a telemonitor would crash but monitored applications would continue running. CMon also tolerates failures of the registry very well; both snarflog and the telemonitor reconnect when the registry restarts.
CMon permits experimenters to use a variety of log processing tools. The tele-monitor was designed to allow any program to be used to process logs, as long as it could take the log on standard input. The PSpec checker was set up to permit this, but we also used Unix shell scripts to save logs in files (named with distinct names based on the application name, machine name on which the application ran, and the process id of the application). In some cases we used shell scripts to save the log in files and at the same time process it continuously with the checker. It would have been useful to have more tools that could perform interesting “continuous” processing of etp logs. For example, online graphical display of data extracted from a set of logs might be very useful for building a “watch” tool for monitoring systems.
5.2
Lessons Learned
reconfig-ure the state of a telemonitor.
It would also be useful to have built-in support in the telemonitor for notifying someone when a problem is detected. This could be cobbled together using shell scripts to look for particular patterns in the output of the PSpec checker and then send email to an appropriate user, but built-in support would be easier to use.
A related problem is the need to save relevant log data when a problem is detected. CMon makes it easy to save the entire log (e.g., using the Unix utility “tee”), but we believe it would be useful to save a chunk of the log containing events from a relatively short time period in which a problem is detected in order to save disk space. The problem here is determining what chunk to save; should it be based on time, on event-based intervals, on total log size, or something else? We discussed several options, but never implemented any of them. This issue would need to be resolved to allow people to understand what caused a problem after it was reported without saving all of the log data generated by a monitored program. The CMon system processes the logs from separate instances of the same ap-plication independently. It would be very useful to be able to process all the logs together with a single tool, particularly for collecting data about the usage of a program. The same is true (but less important) for using logs to detect perfor-mance problems. Allowing a single tool invocation to process logs from multiple instances would also reduce the load on the system running the telemonitor by not creating a separate tool process for each instance of a monitored application.
In a similar vein, CMon supports monitoring of multi-threaded programs with a single log from the entire program, but provides no way to merge the logs from distributed pieces of a single distributed program. This was not a problem for the systems we monitored, but it could be for other systems.
Finally, one needs to ensure that logs can be interpreted even if the program that generated them has changed or been deleted. The developers of Juno-2 were actively changing the program while they were running performance experiments. An executable’s symbol table is needed to correctly process a corresponding etp log. Hence, changing the executable causes old logs to become meaningless. Bet-ter automatic support for saving the appropriate symbol table information (and occasionally, the old executables) and correlating it with the logs would have made processing the logs much easier.
6
Conclusions
build-ing and usbuild-ing CMon, we are convinced that a monitorbuild-ing system like CMon with more complete hands-free operation could be invaluable in making it easy to mon-itor a wide range of systems.
7
Acknowledgments
We are grateful to the following people for help with this work. Mike Burrows, the author of etp, graciously accommodated our requests for modifications that would allow etp to deliver logs to CMon easily and efficiently. Greg Nelson participated in the initial design of CMon as well as helping with the Juno monitoring exper-iments. Allan Heydon has been our most active PSpec and CMon user and has provided many helpful bug reports and suggestions. Lance Berc assisted with the Argo experiments. Andrew Birrell and Paul McJones assisted with the Lectern experiments.
A
PSpec Language Specification
This appendix gives a complete description of the PSpec language. See Appendix D for an extended example of using PSpec.
A.1
Definitions
First, some definitions. A PSpecevent stream is a sequence of primitive compo-nents called events. Each event has a type and a sequence of named, numeric-valued attributes. An event stream is derived from amonitoring log, which is pro-duced by executing an instrumented program. Most of the events in an event stream correspond directly to events in a monitoring log. (The details of this correspon-dence are implementation-dependent. See, for example, the section of Appendix B on monitoring using etp.)
Some of the events in an event stream are fabricated by the PSpec system. For example, events may be fabricated to mark the start and end of the log. In addition, a performance specification can introduce periodic events that are fabricated based on time; these are calledvirtual time events.
Aninterval corresponds to a contiguous subsequence of an event stream start-ing at some start event and endstart-ing at some end event. An interval has associated metrics, which are named and have values (not necessarily numeric). Intervals may be disjoint, may overlap, or may nest. An interval i is nested inside another inter-val j if i ’s start and end events are properly between j ’s start and end events in the event stream.
Values are mathematical entities with types. Some examples of value types are events, intervals, numbers, and booleans. PSpec also has a special value called UNDEFINED, which is a value of all types. UNDEFINED is used as the value of certain expressions that do not have sensible values for particular event streams.
Anexpression specifies a computation that produces a value.
A.2
Types
Every value in a specification has a type that dictates how the value may be in-terpreted. With the exception of event and interval types, types are never named explicitly in specifications. However, the type of any value or expression can al-ways be inferred statically.
The base types arenumber, boolean, and string. From these base types, triple andmapping types can be constructed.
Atriple consists of three numbers and represents a measurement (or combina-tion of measurements) with associated error. The triple [t,p,m] represents a number in the range [t-m,t+p], where t is the measured orfavored value, and p and m are always non-negative. For example, a timestamp taken from a discrete clock mea-suring elapsed time represents a time value sometime between the time at which the clock last ticked and the next time it will tick. Such a timestamp is represented as a triple with a favored value as the clock value (the time of the last tick), a p value of one clock tick, and an m value of zero.
Amapping is a partial function from integers to values.
In addition to the above types, specification writers can declareevent and in-terval types. The declarations for these types are described in the next section. Event and interval types have names that uniquely identify them (i.e., two types are equivalent if and only if they have the same name).
A.3
Declarations
A declaration introduces a name for a constant, event type, or interval type into the global scope. The name is available in all expressions that follow the declaration. An interval type name is not available in metric definitions for that type (thus, interval declarations are not recursive). A declaration may also introduce a name for an unknown number to be solved for later. It is an error to redeclare a name in the same scope (but a name may be redeclared in a nested scope).
A.3.1 Constants
If id is an identifier and e is an expression, then:
def id = e
declares id as a constant bound to the value of e. e is evaluated in the global scope. The declaration
declares id to be an unknown. Unknowns are recognized by psolve, the PSpec solver, and are different from UNDEFINED values.
A.3.2 Event Types
If id is an identifier and alist is a (possibly empty) comma-separated list of identi-fiers, then the two declarations
event id ( [ alist ] )
and
timed event id ( [ alist ] )
declare id as an event type.1 Events of the type have attributes named in alist. The second form also indicates that events of type id have an implicit timestamp attribute, which is used by the elapsed function on intervals and the timestamp and elapsed functions on events. Note that the timed events in a log need not necessarily occur in timestamp order.
A.3.3 Interval Types
An interval type declaration introduces a new interval type, which identifies a set of intervals in an event stream. An interval type declaration provides predicates for determining whether an event in the event stream is the start or end event for an interval of the type, and expressions for computing the metric values for an interval of the type.
An interval declaration may also introduce virtual time events into the event stream to mark the start or end of an interval based on time. These are described in the next section.
The basic interval type definition identifies an interval by the types of its start and end events in an event stream. If id, s, and e are identifiers, stype and etype are event type names, and spred and epred are boolean-valued expressions, then:
[ nested ] interval id = s: stype [ where spred ] , e: etype [ where epred ] [ metrics
mlist ]
end id
1The square brackets here and in the rest of the appendix indicate optional elements and are not
declares an interval with type name id. mlist is a comma-separated list of metric definitions of the form m = expr where m is an identifier and expr is an expression. The declaration defines an interval of type id to be one that has a start event named s of type stype for which spred is true, and an end event named e that is the next event in the event stream of type etype following the start event for which epred is true.
An interval declaration may be modified slightly by inserting the keyword
nested before interval. A nested interval type has the further condition that the
end event e is not an end event for any other interval of type id that starts after the event s. In this case, e is the end event for the interval started by the nearest preced-ing s that does not already have an end event. Thus, without the nested restriction, multiple intervals of the type may share the same end event. With the restriction, all intervals of the type will have different end events and will nest like parentheses. It is always the case that multiple intervals of different types may share end events. For each interval of type id in the event stream, its metrics are computed as follows. A new scope is introduced with s and e bound to the start and end events for the interval. The metric expressions are evaluated in this scope over the portion of the event stream enclosed by the interval, and their values are bound to the inter-val’s metric names. This binding is, in effect, simultaneous for all of an interinter-val’s metric definitions; hence metric definitions may not reference each other. Metric expressions that aggregate over events or intervals may not refer to the end event e (because of implementation efficiency considerations).
The where-clause for the start or end event may be omitted, in which case it defaults to true. The metrics mlist clause may be omitted, in which case the interval has no metrics (but the elapsed function may still be applicable for the interval).
The identifier s is available in spred and epred. The identifier e is available in epred. Both identifiers are available in the metric expressions, as explained above. The identifier id cannot be referenced inside mlist. Moreover, expressions in mlist cannot reference constants that are defined in terms of aggregate expressions.
A.3.4 Time-based Interval Types
In an interval type declaration, the start event declaration
s: stype [ where spred ]
can be replaced by the declaration:
s: [ from oexpr ] every texpr
is the interval type name) into the event stream. The events have timestamp values startts + oexpr + (i * texpr), for i = 0,1,. . ., where startts is the first event times-tamp in the log. In other words, the virtual time events occur starting oexpr time units after the first event in the log, and every texpr time units thereafter. Each such virtual time event starts a new interval of the type. The from clause may be omitted, in which case oexpr defaults to 0.
If the events in the log are in timestamp order, the virtual time events are in-serted in timestamp order, up to the last real event in the log. If a virtual event has the same timestamp as a real event, the virtual event is inserted before the real event. If two virtual events have the same timestamp, their relative order is undefined.
If the events in the log are not in timestamp order, then the sequencing is more complicated. For each declaration of an interval type I, virtual eventsve0, ve1, . . ., of type start$I, are inserted into the event stream as follows:
1. ve0, which has timestamp t0 = startts+oexpr, is inserted before the first real event whose timestamp is at least t0.
2. vei, which has timestamp ti =startts+oexpr+(i∗texpr)(for i =1,2, . . .),
is inserted after vei−1, and before the first real event whose timestamp is at least ti and that occurs after vei−1. If no such real event exists, vei is
discarded (as are all subsequent virtual events resulting from this interval type declaration).
In addition, two virtual events that are adjacent in the event stream are in timestamp order.
Similarly, the end event declaration for an interval type,
e: etype [ where epred ]
may be replaced by the declaration:
e: after texpr
A.3.5 Interval Subtypes
If id is an identifier, inttype is the name of a previously declared interval type, and mlist is a comma-separated list of metric definitions, then
interval id = inttype
[ metrics mlist ]
end id
defines a new interval type, named id, that is a subtype of inttype. The new interval type is nested if inttype is nested, and has the same start and end event specification as inttype. It inherits all of inttype’s metric definitions, in addition to those newly defined in mlist. If mlist is supplied, the metric names in mlist must be different from inttype’s metric names.
A.3.6 Procedure Sugar
A proc statement provides a convenient syntax for declaring events and intervals corresponding to procedures in a program. If p, a1, a2,. . ., an, and r are identifiers,
a statement of the form
proc p ( [ a1, a2, ..., an] ) [ returns r ]
has the effect of declaring two new events types named call@p and ret@p and a new interval type named intv@p. (These identifiers are special since @ cannot appear in an identifier supplied by a PSpec user). The declarations for these new types are equivalent to:
timed event call@p( [ a1, a2,. . ., an] ); ret@p( [ r, exact ] );
nested interval intv@p =
s: call@p,
e: ret@p where thread(s) = thread(e)
end intv@p
The argument list and returns-clause are optional.
An event of type call@p corresponds to a call of procedure p with integer argu-ments a1through an, and an event of type ret@p corresponds to a return of p with
result r. Any of a1through anmay be replaced by the symbol ?, if the
the log and may be later than the actual time at which the procedure exited. (This is to accommodate some monitoring techniques; for example, inexact timestamps result when procedures exit with exceptions rather than normal returns.) Note that in the interval type intv@p, the start and end events are always named s and e, respectively.
A.4
Imports
An import statement allows names declared in one specification to be used in an-other specification. A statement of the form: import idlist makes available to the specification containing the import statement the event and interval types defined in the specifications listed in idlist. These types are referenced by prefixing the name of the declaring specification followed by “.” to the name of the type. For example, if specification S declares event type E, a specification T that imports S may refer to S.E. The name S.E is in T’s global scope and is called aqualified name.
Event and interval types produced by the proc statement are a special case. These are never qualified by a specification name. If proc p appears in a specifica-tion S, the event types call@p and ret@p, and the interval type intv@p are referred to in any specification that imports S without qualification. If proc p appears multi-ple times, its last occurrance takes precedence. (Imports are processed in the order in which they occur in the import statement.)
A.5
Assertions
An assertion is a predicate (boolean-valued expression) that is expected to be true when a specification is checked against a log. If e is a predicate, then assert e is an assertion that e should evaluate to true. e is evaluated in the global scope. An error is reported by the checker if e has the value UNDEFINED.
An assertion may be labelled with a double-quoted string for easier identifica-tion in messages produced by the checker. A labelled asseridentifica-tion has the form
assert “string” : e
A.6
Solve Declarations
solve e
solve data id : idtype [ where pred : e ] [ , var v ] [ , cor c ] solve data id in domain(m) [ where pred : e ] [ , var v ] [ , cor c ]
See the psolve manual page in Appendix D for more information about how solve declarations are used.
A.7
Print Statements
If e is an expression (possibly string-valued), then print e evaluates e in the global scope and prints its value on the standard output.
A.8
Specifications
If id is an identifier and stmts is a semi-colon separated list of statements, which may be declarations, assertions, solve statements, imports, or print statements, then:
perfspec id
stmts
end id
is a specification. id must be different from any top-level identifier in stmts.
A.9
Expressions
An expression specifies a computation that produces a value. Expressions are either operands (identifiers or literals), operators applied to arguments that are themselves expressions, triple constructors, mapping constructors, or aggregate expressions.
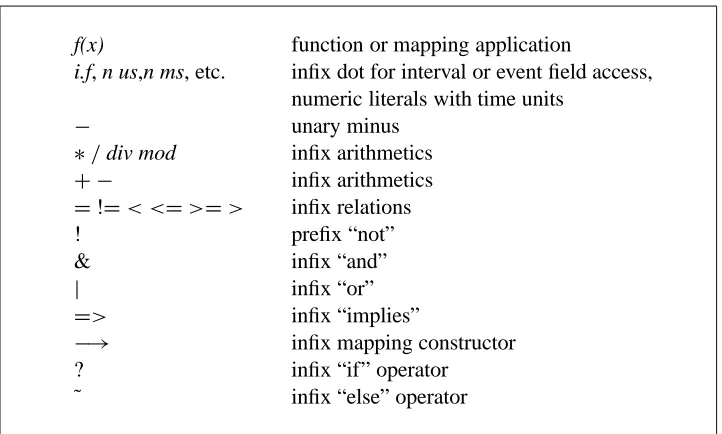
The operators that have special syntax are classified and listed in decreasing precedence in Figure 7. All infix operators are left associative. Parentheses can be used to override the default precedence rules.
Except as noted below, most operators deal with UNDEFINED values by prop-agating them. That is, if any of the arguments to an operator has the value UNDE-FINED, the result of applying the operator to its arguments produces the value UNDEFINED.
A.9.1 Literals
f(x) function or mapping application
i.f, n us,n ms, etc. infix dot for interval or event field access, numeric literals with time units
− unary minus
∗/div mod infix arithmetics
+ − infix arithmetics
=!=< <=>=> infix relations
! prefix “not”
& infix “and”
| infix “or”
=> infix “implies”
[image:40.612.126.487.127.344.2]−→ infix mapping constructor ? infix “if” operator ˜ infix “else” operator
Figure 7: Operators in order of decreasing binding power.
Numeric literals denote non-negative numbers and use the Modula-3 [7] syntax for integer, real, and longreal literals. All numbers are converted into longreal format internally, but we can still check when necessary whether a number has an integral value.
A string literal is similar to a Modula-3 text literal (although extended char-acters are not currently supported). No operations are provided on string literals. (Thus, strings can only be printed, assigned to identifiers or metric names, and stored in mappings.)
A.9.2 Triple Constructors
If v, p, and m, are numeric-valued expressions, then [v,p,m] is the triple whose components are the values of v, p, and m, in that order. Both p and m must be non-negative.
A.9.3 Mappings
mapped to UNDEFINED. If the value of i is UNDEFINED then the value of the mapping is UNDEFINED.
If e1,e2, . . . ,en are constant single-element mapping constructor expressions,
then the comma-separated, parenthesized expression (e1,e2, . . . ,en) evaluates to
a multi-element mapping. The set of domain values in the multi-element mapping is the union of the domain values of e1 through en and their range values are the
corresponding range values. All of the component single-element mappings must have the same type of range value and different domain values; if not, an error is reported.
If m is a mapping and i is a number-valued expression, then m(i) evaluates to the value to which m maps i. If i is not in m’s domain, m(i) evaluates to UNDEFINED. The expression mapped(m,i) evaluates to true if and only if i is in m’s domain.
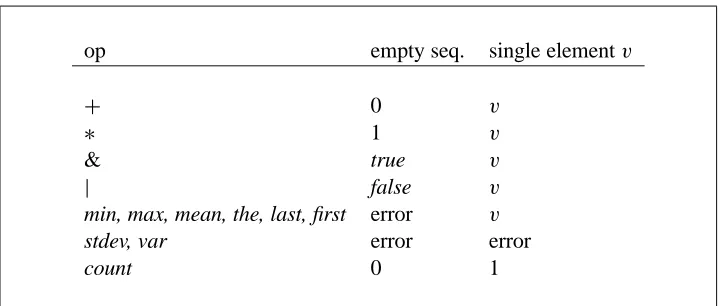
Some of the arithmetic and logical operators are overloaded to work on map-pings. These operators provide various ways of combining mapmap-pings. In particular,
+,∗,&,|,min, and max can take mappings as arguments. The result of combining a sequence of mappings m1, . . . ,mn with one of the above operators op is a new
mapping r whose domain is the union of the domains of m1 through mn. For any
number i in r’s domain, r(i)is the value obtained by applying op to the sequence of values mk(i)for all mk such that mapped(mk, i ) = true.
A.9.4 Field Access
If id is an identifier bound to an event or interval and f is one of its field names (a metric or an attribute), then id.f evaluates to the value of the field.
A.9.5 Time Units
Numeric values are unitless. Times computed using the elapsed function are also unitless as values, but they represent a time value in some time unit specific to the implementation. In order that a specification writer may use these time values in a sensible way (e.g., to compare them to literals), operators are provided to convert literals in specified time units to their equivalent values in internal time units. If n is a numeric literal, then any of the following operators can follow n in an expression:
week or weeks weeks cyc cycles
For example, 10 ms evaluates to the real number of internal time units equal to 10 milliseconds. Hence, if n is a time in internal time units, n/(1 ms)is the same amount of time in milliseconds.
A.9.6 Arithmetic Operations
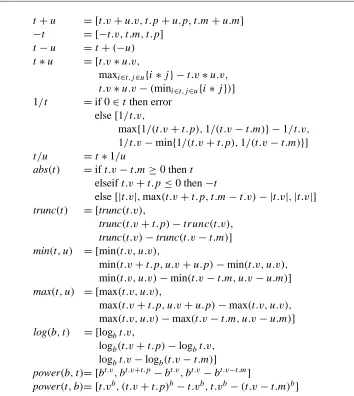
Some arithmetic operations are overloaded to work with triples and mappings as well as numbers. The operations on numbers and triples are described here. The section on mapping expressions describes operations on mappings.
A.9.7 Numeric Operations
The numeric operations are: - (unary), - (infix), +, *, / , div, mod, min, max, log, power, abs, and trunc. The first five of these are defined as in Modula-3.
div and mod are infix operations whose arguments must be integral values. They produce integral results and are defined as in Modula-3.
min and max are invoked as functions, each taking two numeric arguments and returning a number. min returns the minimum of its arguments and max returns the maximum.
If a and b are numeric expressions, then the logarithm to the base a of b is written log(a,b), and a raised to the b power is written power(a,b). Both of these operations return numbers.
If n is a numeric expression, then abs(n) is the absolute value of n. trunc(n) returns the greatest integral number that is at most n for n positive, and the smallest integral number that is at least n for n negative.
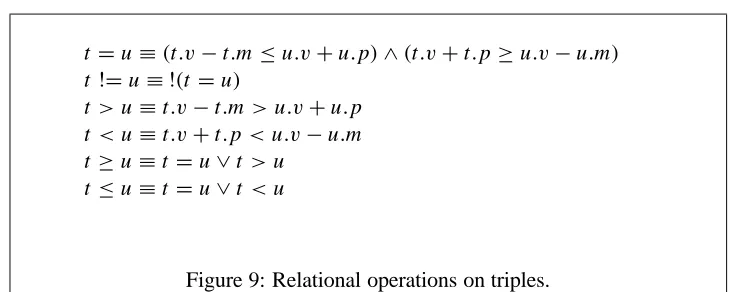
A.9.8 Relational Operations
The relational operations are: <, <=, >, >=, =, and != (not equal). These are defined both on numbers and on triples, and the result is a boolean. Their definitions for numbers are as expected. Their definitions on triples are discussed below. An expression of the form “a op b op c,” where op is a relational operator, is equivalent to the expression “a op b & b op c.”
A.9.9 Operations On Triples