www.impactjournals.com/oncotarget/ Oncotarget, Vol. 6, No. 25
Identification of novel long non-coding RNAs in triple-negative
breast cancer
Xiaokun Shen1,2,*, Bojian Xie1,*, Zhaosheng Ma1,*, Wenjie Yu1, Wenmin Wang1,
Dong Xu1, Xinqiang Yan1, Beibei Chen3, Longyao Yu4, Jicheng Li2, Xiaobing Chen3,
Kan Ding4 and Feilin Cao1
1 Department of Surgical Oncology, Taizhou Hospital, Wenzhou Medical University, Taizhou, Zhejiang, China 2 Institute of Cell Biology, Zhejiang University, Hangzhou, China
3 Department of Internal Oncology, Hennan Cancer Hospital, The Affiliated Cancer Hospital of Zhengzhou University,
Zhengzhou, Hennan, China
4 Glycobiology and Glycochemistry Lab, Shanghai Institute of Materia Medica, Chinese Academy of Sciences, Shanghai,
China
* These authors have contributed equally to this work
Correspondence to: Xiaobing Chen, email: [email protected] Correspondence to:: Kan Ding, email: [email protected] Correspondence to: Feilin Cao, email: [email protected]
Keywords: triple-negative breast carcinomas; long non-coding RNAs
Received: January 06, 2015 Accepted: May 02, 2015 Published: June 10, 2015
This is an open-access article distributed under the terms of the Creative Commons Attribution License, which permits unrestricted use, distribution, and reproduction in any medium, provided the original author and source are credited.
ABSTRACT
Triple-negative breast carcinomas (TNBC) are characterized by particularly poor outcomes, and there are no established markers significantly associated with prognosis. Long non-coding RNAs (lncRNAs) are subclass of noncoding RNAs that have been recently shown to play critical roles in cancer biology. However, little is known about their mechanistic role in TNBC pathogenesis. In this report, we investigated the expression patterns of lncRNAs from TNBC tissues and matched normal tissues with Agilent Human lncRNA array. We identified 1,758 lncRNAs and 1,254 mRNAs that were differentially expressed (≥ 2-fold change), indicating that many lncRNAs are significantly upregulated or downregulated in TNBC. Among these, XR_250621.1 and NONHSAT125629 were the most upregulated and downregulated lncRNAs respectively. qRT-PCR was employed to validate the microarray analysis findings, and results were consistent with the data from the microarrays. GO and KEGG pathway analysis were applied to explore the potential lncRNAs functions, some pathways including microtubule motor activity and DNA replication were identified in TNBC pathogenesis. Our study revealed that a set of lncRNAs were differentially expressed
in TNBC tissues, suggesting that they may play role in TNBC. These results shed light
on lncRNAs’ biological functions and provide useful information for exploring potential therapeutic targets for breast cancer.
INTRODUCTION
Breast cancer is a heterogeneous neoplasm that comprises subtypes with substantial differences in biology and diverse clinical outcomes. As more molecularly targeted therapeutic agents are launched, more clinical remission problems are arising [1]. Therefore,
identification of novel therapeutic targets is essential
understood. Various studies show that TNBC have broad and diverse categories for which additional subclasses are needed. Thus, there is considerable interest in
understanding potential biomarkers that are significantly
associated with TNBC prognosis.
Long non-coding RNAs (lncRNAs) are a subclass of noncoding RNAs (ncRNAs) and have sequence lengths of 200 bp and above [2, 3]. It has become increasingly apparent that lncRNAs contribute to tumor development through many different cellular processes, ranging from transcriptional and post-transcriptional regulation to the control of cell cycle distribution, cell differentiation
and epigenetic modifications[4, 5]. LncRNAs modulate
gene transcription regulation by rearranging chromatin via chromosomal looping and by affecting the binding of transcription factors. LncRNAs also affect miRNA functions by controlling pre-mRNA splicing or as miRNA sponges. Recently, accumulating evidence indicates that there is aberrant expression of lncRNAs in many cancer types, including glioma, lung, colorectal and hepatocellular cancers, etc [6-8]. Although prognostic
lncRNAs expression signatures have been defined for
some invasive breast carcinomas, little is known about
lncRNAs expression in TNBC, and the underlying pathways regulating TNBC aggressiveness remain poorly understood [9].
Here, we analyzed the expression patterns of lncRNAs and mRNAs in TNBC samples and compared them with the corresponding patterns in adjacent
non-tumorous tissue samples. We identified more than 1,200 unique lncRNAs and mRNAs significantly differentially
expressed using microarray technology. Several of
the differentially expressed lncRNAs were verified by
qPCR in other 12 pairs of tissue samples. To determine the biological roles of these differentially expressed lncRNAs and mRNAs, GO and Pathway analyses were used. Coding-non-coding gene co-expression network
identified many lncRNAs, such as lncRNA XR_250621.1,
RESULTS
LncRNAs and mRNAs expression profiles in
TNBC
LncRNAs profiling detected 1,403 lncRNAs with significant differential expression levels with at
least a two-fold change in TNBC tissues compared with paired normal tissues, with 853 up-regulated and 550 down-regulated respectively. The list of the top 30
differentially expressed lncRNAs identified by microarray
analysis was shown in Table 1. Among the dysregulated
lncRNAs transcripts, XR_250621.1 (humanseq85285)
was the most down-regulated, with an FC of 291.3, whereas NONHSAT125629 (humanseq51739) was the most up-regulated, with an FC of 23.9. Using the same
criteria as the lncRNAs, we found 574 up-regulated and 445 down-regulated mRNA transcripts. The most
up-regulated and downup-regulated mRNA transcripts were
CDCA2 (NM_152562) and ANKRD30A (NM_052997),
with FCs of 22.8 and 155.3, respectively (shown in Table
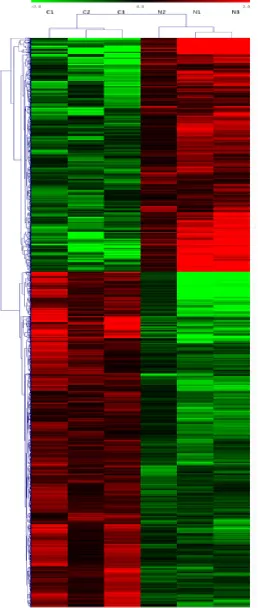
2). Hierarchical clustering of the lncRNAs and mRNAs
profile was performed using cluster 3.0.2; Hierarchical clustering of the expression of the 1,403 lncRNAs and
1,019 mRNAs based on centered Pearson correlation clearly separated TNBC from normal tissues (Figure 1).
Validation of the microarray data using qPCR
The most upregulated lncRNA XR_250621.1 and
downregulated lncRNA NONHSAT125629 were selected for validation using qPCR. In addition, two lncRNAs (ENST00000503938 and NONHSAT012762) were randomly selected to validate the microarray consistency using qPCR. The results demonstrated that lncRNAs NONHSAT125629 and ENST00000503938 were
up-regulated and that XR_250621.1 and NONHSAT012762
Figure 1: Heat map and hierarchical clustering of lncRNA profile comparison between the TNBC and normal breast samples. Each row represents one lncRNA, and each column represents one tissue sample. The relative lncRNA expression is depicted
according to the color scale. Red indicates up-regulation; green indicates down regulation. 2.0, 0 and -2.0 are folds changes in the
Figure 2: Comparison between microarray data and qPCR results. A. ENST00000503938 , B. NONHSAT012762 C.
XR_250621.1 and D. NONHSAT125629 which were determined to be differentially expressed in TNBC samples compared with NT samples in 3 paired patients by microarray was validated by qPCR in 12 paired tissues. The heights of the columns in the chart represent
the log-transformed median fold changes in expression across the 12 patients for the lncRNA validation; the bars represent standard errors.
[image:5.612.124.494.59.361.2]The validation results of the lncRNAs indicated that the microarray data correlated well with the qPCR results.
[image:5.612.78.551.424.712.2]Go and KEGG pathway analysis
To predict the functions of the lncRNAs, we adopted
method originally demonstrated in this paper[10]. Briefly, we first calculated the co-expressed mRNAs for each of
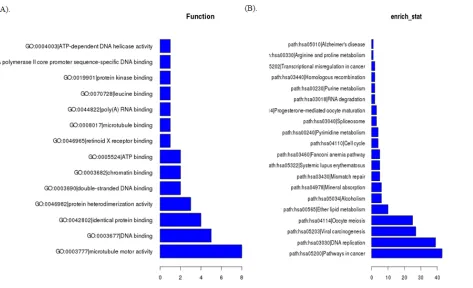
the differentiated lncRNAs, and then we conducted a functional enrichment analysis of this set of co-expressed mRNAs. The enriched functional terms were used as the predicted functional terms for each given lncRNA. To explore potential biological associations, we ran GO and Pathway analysis with the top 500 differentially expressed lncRNAs and mRNAs. GO analysis indicated that several functional pathways were enriched. Among
these pathways, protein binding, fibroblast growth
factor-activated receptor activity, structural constituent of ribosome, protein kinase binding and poly(A) RNA binding signaling were the most closely associated with TNBC (Figure 3A). Furthermore, using the same criteria
as the GO analysis, KEGG Pathway analysis showed
that some pathways corresponded, including ribosome, pathways in cancer, NOD-like receptor signaling pathway, cell cycle, DNA replication, etc. (Figure 3B).
Construction of co-expression network
To explore which lncRNAs and mRNAs play a critical role in TNBC progression, we constructed a co-expression network based on the correlation analysis between the differentially expressed lncRNAs and mRNAs. LncRNAs and mRNAs with Pearson’s
correlation coefficients of no less than 0.99 were used to
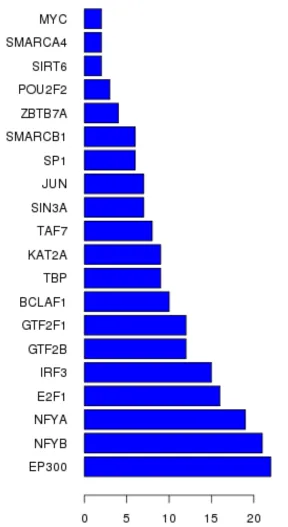
construct the network. To explore lncRNAs that possibly have trans-regulating functions, we compared the mRNAs that coexpressed with these lncRNAs with the mRNAs that are regulatory targets of certain Transcription factors (TFs). Results show that EP300, NFYB and E2F1 may
play central roles in lncRNAs process (Figure 4). The
co-expression network indicated that one mRNA or lncRNA might correlate with one to ten lncRNAs (Figure 2S). The co-expression network may suggest that the inter-regulation of lncRNAs and mRNAs is involved in TNBC.
DISCUSSION
Pathogenesis of breast cancer remains unclear;
therefore, further study of breast cancer is of great importance. As lncRNAs constitute an important class of gene expression regulatory factors, their aberrant expression would inevitably lead to abnormal gene expression levels, which might result in tumorigenesis [2, 5]. To date, there have been few studies studying
lncRNAs expression profile in breast cancer or predicating
the association of lncRNA expression with clinical pathological features and outcomes in breast cancer [11,
7, 12, 9, 13, 14]. Thus, lncRNAs have opened a new field
of breast cancer genomics. Although there are no drugs that act against lncRNAs presently, it will be fascinating to
observe whether drugs could be developed that specifically
target lncRNAs. Notably, lncRNAs can be detected in
human body fluids and hold great promise as biomarkers.
In the present study, we investigated lncRNAs expression signature of TNBC tumor samples from patients. With abundant and varied probes amounting to
78,243 human lncRNAs and 30,215 coding transcripts
in the microarray, a large number of lncRNAs could be
determined quantitatively and significant differential
expression in cancer tissue compared to normal breast
tissue was observed. 1,758 lncRNAs and 1,254 mRNAs were found to be significantly differentially expressed.
In addition, qRT-PCR was employed to validate the
microarray analysis findings, and results were consistent
with the data from the microarrays. These results revealed that there were unique lncRNAs expression signatures in these tissues. However, the majority of differentially expressed lncRNAs corresponded to novel transcripts of
unknown functions [4, 15]. In order to obtain insight into lncRNA target gene functions, GO analysis and KEGG
pathway annotation were applied to the lncRNA target gene pool. GO analysis revealed that the number of genes corresponding to down-regulated mRNAs were larger than that corresponding to up-regulated mRNAs. These pathways may play important roles in the occurrence and development of TNBC. Increased understanding of the role of these potential endogenous lncRNAs in breast cancer cells could provide additional insight on the role these pathways play in mediating breast cancer progression.
An increasing number of studies have demonstrated that a number of lncRNAs are not transcriptional noise, but have important functions, such as regulating gene expression at various molecular levels, including protein, RNA, miRNA and DNA[16, 17]. Few studies have focused on how lncRNA genes themselves were transcriptionally regulated. Yang et al. developed a system by which users could browse transcription factor binding sites in the regulatory regions of lncRNAs [18]. However, lncRNAs are temporally and spatially expressed and regulated, and motif-based sequence analysis cannot capture the dynamic regulation of lncRNAs by transcription factors. In this study, we constructed a transcription factors-lncRNAs-mRNA network based on expressions in the TNBC tissue
and binding sites in the regulatory regions of a specific
lncRNA. Results showed that EP300, NFYB and E2F1 played central roles in lncRNAs process and TNBC development, which were consist with previous reports [19-21]. As more data become available, it will facilitate the research on the transcriptional regulation of lncRNAs.
technology promises to unravel previously inaccessible
complexities in the transcriptome, such as allele-specific
expression and novel promoters and isoforms. However, datasets produced are large and complex and interpretation is not straight forward. Second, the sample size of each
dataset is relatively small, the significance and robustness of the signature requires further confirmation, ideally with
large prospective patient cohorts with prognostic date. Last but not least, although the roles of the lncRNAs in
TNBC pathogenesis are presently unclear, our findings
suggest that lncRNAs deserve further studied. Additional functional investigations of these lncRNAs on cancer cell lines and xenograft models may increase our outstanding of their roles in determining TNBC prognosis.
To summarize, comprehensive in-depth analysis
of the expression profiles of lncRNAs was executed in
this study. A set of lncRNAs with differential expression were found in TNBC compared with normal breast tissue. Furthermore, potential roles for these lncRNAs
[image:7.612.181.469.180.707.2]in the regulation of protein binding, fibroblast growth
factor-activated receptor activity, structural constituent of ribosome, protein kinase binding and poly (A) RNA
binding signaling pathways will be identified. Further investigation of the lncRNAs identified in this study
will likely focus on their biological functions and their association with TNBC. Our study provides useful information for exploring potential therapeutic targets for breast cancer.
MATERIALS AND METHODS
Ethics statement
This study was approved by the human ethics committee of the Zhejiang Taizhou Hospital, People’s Republic of China. All patients are informed and have declared written informed consent that their samples can be used for research.
All patients received tumor resection at Zhejiang Taizhou Hospital and were diagnosed with TNBC histopathologically after surgery. Immunochemical staining of estrogen receptor/progesterone receptor and ErbB2 receptor in 3 samples are shown in Figure S1. There was no radiotherapy or chemotherapy prior to surgery. 3 paired samples were used for microarray analysis of lncRNAs and 12 paired samples were used for an extra evaluation by real-time PCR. Demographic and clinical characterizations of the study population are summarized in Table S1.
Tissue collection and RNA extraction
Paired TNBC tissues and adjacent normal breast tissues from every subject were snap-frozen in liquid nitrogen immediately after resection and stored at -80 °C until use. The mirVanaTM RNA Isolation Kit (Ambion, Foster City, CA, United States) was used to extract total RNA from frozen samples, according to the manufacturer’s protocols, which were then eluted with 100
mL of nuclease-free water. Total RNA was quantified with the NanoDrop ND-2000 (Thermo Scientific) and the RNA
integrity was assessed using Agilent Bioanalyzer 2100 (Agilent Technologies).
LncRNA and mRNA microarray expression profiling
The microarray profiling was conducted in the
laboratory of the OE Biotechnology Company in Shanghai, People’s Republic of China. The sample labeling, microarray hybridization and washing were performed based on the manufacturer’s standard protocols.
Briefly, mRNA was purified from total RNA after removal
of rRNA by using an mRNA-ONLY Eukaryotic mRNA
IsolationKit (Epicentre Biotechnologies, USA). Then,
each sample was transcribed to double strand cDNA, then synthesized into cRNA and labeled with Cyanine-3-CTP. The labeled cRNAs were hybridized onto the Human
lncRNA array V4.0 (4 × 180 K, Agilent), including the global profiling of 78,243 human lncRNAs and 30,215
coding transcripts. After washing, the arrays were scanned with the Agilent Scanner G2505C (Agilent Technologies). Feature Extraction software (version 10.7.1.1, Agilent Technologies) was used to analyze array images and extract the raw data. Genespring (Version 12.5, Agilent
Technologies) was employed to finish the basic analysis of
the raw data. To begin with, the raw data were normalized with the quantile algorithm. The probes that had at least 1
condition out of 2 conditions flagged as “P” were chosen
for further data analysis. Differentially expressed lncRNAs
and mRNAs were then identified through fold-change as
well as P values calculated with t-test. The threshold set
for up- and down-regulated genes was fold change ≥ 2.0
and p value ≤ 0.05. Afterwards, Hierarchical Clustering
was performed to display the distinguishable lncRNAs and mRNAs expression patterns among the samples.
Functional group analysis
GO analysis and KEGG analysis were applied
to determine the biological roles of these differentially
expressed mRNAs, base on the latest KEGG (Kyoto
Encyclopedia of Genes and Genomes) database (http:// www.genome.jp/kegg/). The p value (Hypergeometric-P
value) denotes the significance of the pathway correlated
to the conditions. The recommend p-value cut-off is 0.05.
Construction of the co-expression network
Potentially trans-regulated protein-coding
genes were defined as coexpressed and beyond 100
Real-time quantitative reverse transcription-PCR
A two-step reaction process was used for
quantification reverse transcription (RT) and PCR. Each RT reaction consisted of 0.5 μg RNA, 2 μL of Primer Script Buffer, 0.5 μL of oligo dT, 0.5 μL of random 6 mers and 0.5 μL of Primer Script RT Enzyme Mix I (TaKaRa, Japan), in a total volume of 10 μL. Reactions were
performed in a GeneAmp® PCR System 7500 (Applied Biosystems) for 15 min at 37 °C, followed by heat
inactivation of RT for 5 s at 85 °C. The 10 μL RT reaction
mix was then diluted 10-fold in nuclease-free water and held at -20 °C. At the end of the PCR cycles, melting curve
analysis was performed to validate the specific generation
of the expected PCR product. All experiments were done in triplicate. The expression levels of lncRNAs were normalized to glyceraldehyde-3-phosphate dehydrogenase
and were calculated using the 2-ΔΔCt method. The primer
sequences were designed in the laboratory based on the DNA sequences and is shown in Table S2.
Statistical analysis
The Statistical Program for Social Sciences (SPSS) 18.0 software (SPSS, Chicago, IL, United States) was employed to perform all the statistical analyses. All data were expressed as the mean ± SD or proportions where appropriate. For comparisons, paired t-tests and unpaired
t-tests were performed where appropriate. GraphPad Prism 5.0 for Microsoft Windows (GraphPad Software, San Diego, CA, United States) was used to plot all graphs. P
values of 0.05 (two-tailed) were considered statistically
significant.
ACKNOWLEDGMENTS
This work was supported by the National Science Foundation for Distinguished Young Scholars of China (81125025), National Natural Science Foundation of
China (81202103, 31370810, 81172240, 81472714, and 81171914) Zhejiang Provincial Natural Science
Foundation of China (LY15H160002) and Henan
outstanding youth fund projects (2014011016).
CONFLICTS OF INTEREST
The authors declare no financial conflicts of interest.
Data availability
The authors confirm that all data underlying the findings are fully available without restriction. All relevant
data are within the paper and its Supporting Information
files, or in a public repository (submitted to the GEO
repository, number is GSE64790).
REFERENCES
1. Pal SK, Childs BH, Pegram M (2011) Triple negative breast
cancer: unmet medical needs. Breast cancer research and
treatment 125:627-636. doi:10.1007/s10549-010-1293-1.
2. Hung T, Chang HY (2010) Long noncoding RNA in genome regulation: prospects and mechanisms. RNA biology 7:582-585.
3. Di Gesualdo F, Capaccioli S, Lulli M (2014) A
pathophysiological view of the long non-coding RNA world. Oncotarget 5:10976-10996.
4. Zhao W, Luo J, Jiao S (2014) Comprehensive
characterization of cancer subtype associated long
non-coding RNAs and their clinical implications. Scientific reports 4:6591. doi:10.1038/srep06591.
5. Prensner JR, Chinnaiyan AM (2011) The emergence of
lncRNAs in cancer biology. Cancer discovery 1:391-407.
doi:10.1158/2159-8290.CD-11-0209.
6. Zhang J, Zhang P, Wang L, Piao HL, Ma L (2014)
Long non-coding RNA HOTAIR in carcinogenesis and
metastasis. Acta biochimica et biophysica Sinica 46:1-5.
doi:10.1093/abbs/gmt117.
7. Vikram R, Ramachandran R, Abdul KS (2014) Functional significance of long non-coding RNAs in breast cancer. Breast cancer 21:515-521. doi:10.1007/s12282-014-0554-y. 8. Tu ZQ, Li RJ, Mei JZ, Li XH (2014) Down-regulation
of long non-coding RNA GAS5 is associated with the prognosis of hepatocellular carcinoma. International journal
of clinical and experimental pathology 7:4303-4309. 9. Pickard MR, Williams GT (2014) Regulation of apoptosis
by long non-coding RNA GAS5 in breast cancer cells: implications for chemotherapy. Breast cancer research and
treatment 145:359-370. doi:10.1007/s10549-014-2974-y.
10. Guttman M, Rinn JL (2012) Modular regulatory principles
of large non-coding RNAs. Nature 482:339-346.
doi:10.1038/nature10887.
11. Chisholm KM, Wan Y, Li R, Montgomery KD, Chang
HY, West RB (2012) Detection of long non-coding RNA in archival tissue: correlation with polycomb protein expression in primary and metastatic breast carcinoma. PloS
one 7:e47998. doi:10.1371/journal.pone.0047998.
12. Reiche K, Kasack K, Schreiber S, Luders T, Due EU, Naume B, Riis M, Kristensen VN, Horn F, Borresen-Dale AL, Hackermuller J, Baumbusch LO (2014) Long
non-coding RNAs differentially expressed between normal versus primary breast tumor tissues disclose converse changes to breast cancer-related protein-coding genes. PloS one 9:e106076. doi:10.1371/journal.pone.0106076.
13. Meng J, Li P, Zhang Q, Yang Z, Fu S (2014) A four-long
non-coding RNA signature in predicting breast cancer survival. Journal of experimental & clinical cancer research
14. Su X, Malouf GG, Chen Y, Zhang J, Yao H, Valero V, Weinstein JN, Spano JP, Meric-Bernstam F, Khayat D, Esteva FJ (2014) Comprehensive analysis of long
non-coding RNAs in human breast cancer clinical subtypes.
Oncotarget 5:9864-9876.
15. Gumireddy K, Li A, Yan J, Setoyama T, Johannes GJ,
Orom UA, Tchou J, Liu Q, Zhang L, Speicher DW, Calin
GA, Huang Q (2013) Identification of a long non-coding
RNA-associated RNP complex regulating metastasis at
the translational step. The EMBO journal 32:2672-2684.
doi:10.1038/emboj.2013.188.
16. Guo L, Zhao Y, Yang S, Zhang H, Wu Q, Chen F (2014)
An integrated evolutionary analysis of miRNA-lncRNA
in mammals. Molecular biology reports 41:201-207. doi:10.1007/s11033-013-2852-4.
17. Xing Z, Lin A, Li C, Liang K, Wang S, Liu Y, Park PK,
Qin L, Wei Y, Hawke DH, Hung MC, Lin C, Yang L
(2014) lncRNA Directs Cooperative Epigenetic Regulation
Downstream of Chemokine Signals. Cell 159:1110-1125.
doi:10.1016/j.cell.2014.10.013.
18. Yang X, Gao L, Guo X, Shi X, Wu H, Song F, Wang B (2014) A network based method for analysis of
lncRNA-disease associations and prediction of lncRNAs implicated in diseases. PloS one 9:e87797. doi:10.1371/journal. pone.0087797.
19. Vleugel MM, Shvarts D, van der Wall E, van Diest PJ (2006) p300 and p53 levels determine activation of HIF-1 downstream targets in invasive breast cancer. Human pathology 37:1085-1092. doi:10.1016/j. humpath.2006.03.015.
20. Bryan EJ, Jokubaitis VJ, Chamberlain NL, Baxter SW, Dawson E, Choong DY, Campbell IG (2002) Mutation analysis of EP300 in colon, breast and ovarian carcinomas. International journal of cancer Journal international du
cancer 102:137-141. doi:10.1002/ijc.10682.
21. Ngwenya S, Safe S (2003) Cell context-dependent differences in the induction of E2F-1 gene expression by 17 beta-estradiol in MCF-7 and ZR-75 cells. Endocrinology