Georgia State University Georgia State University
ScholarWorks @ Georgia State University
ScholarWorks @ Georgia State University
Public Health Theses School of Public Health
Spring 5-15-2010
Alcohol Misuse and Depressive Symptomology among Males with
Alcohol Misuse and Depressive Symptomology among Males with
a History of Service in the U.S. Armed Forces
a History of Service in the U.S. Armed Forces
Ashley Davis
Georgia State University
Follow this and additional works at: https://scholarworks.gsu.edu/iph_theses Part of the Public Health Commons
Recommended Citation Recommended Citation
Davis, Ashley, "Alcohol Misuse and Depressive Symptomology among Males with a History of Service in the U.S. Armed Forces." Thesis, Georgia State University, 2010.
https://scholarworks.gsu.edu/iph_theses/95
Abstract
Ashley Davis
Alcohol misuse and depressive symptomology among males with a history of service in the U.S. Armed Forces
(Under the direction of Kymberle Sterling, Faculty Member)
BACKGROUND: Soldiers face extraordinary circumstances while serving in the U.S. Armed Forces. Soldiers are required at times to live away from family and friends for extended periods of time and work in hazardous environments. Once soldiers become veterans, the experiences of military life may continue to affect them long after their duties have been carried out. These conditions put them at greater risk for alcohol misuse and depression. The purpose of this is to determine whether there is an association between alcohol misuse and depression symptomology among males who have a history of service in the U.S. Armed Forces.
METHODS: Secondary data from NHANES 2005-2008 were used to analyze 1,381 men who expressed alcohol misuse and depressive symptomology. Chi-square tests were used to attain descriptive frequencies for alcohol misuse and depressive symptomology and demographic factors. Binary logistic regression was used for univariate and multivariate to test for associations between alcohol misuse, depressive symptomology, and demographic variables.
RESULTS: Alcohol misuse and depressive symptomology were significantly associated with male veterans with a history of service in the Armed Forces, p= .041. Age (p< .001), race (p< .05) marital status (p<.05), and educational attainment (p< .01) are the best predictors of alcohol misuse among male veterans. Similarly, depressive symptomology had the same predictors as alcohol misuse, except race.
CONCLUSIONS: The complex relationship between alcohol misuse and depressive
symptomology among male veterans warrants further research. Public health professionals need to clearly establish standard measurement instruments for diagnosing these conditions. Once established, appropriate interventions can be implemented in order to combat these alcohol misuse and depressive symptomology among male veterans.
Alcohol misuse and depressive symptomology among males with a history of service in the U.S. Armed Forces
by
Ashley Davis
B.S., State University of New York at Albany, 2005
A Thesis Submitted to the Graduate Faculty of Georgia State University in Partial Fulfillment of the
Requirements for the Degree
MASTER OF PUBLIC HEALTH
ATLANTA, GEORGIA
2010
Alcohol misuse and depressive symptomology among males with a history of service in the U.S. Armed Forces
by
Ashley Davis
Approved:
Kymberle Sterling, DrPH Committee Chair
Ike Okosun, MS, MPH, Ph.D., FRSPH Committee Member
Frances McCarty, Ph.D., M. Ed. Committee Member
Acknowledgements
I would like to especially thank my wonderful committee members, Dr. Kymberle Sterling, Dr. Ike Okosun, and Dr. Frances McCarty who showed patience and assisted me throughout this entire process. I would also like to thank the Institute of Public Health’s faculty and staff for their support.
I would like to give special thanks to my best friend, Sara Smith, who stayed up many late nights with me, allowing me to share my ideas with her. Last, I would like to thank my family for their continued support while pursuing my MPH.
Author’s Statement Page
In presenting this thesis as a partial fulfillment of the requirements for an advanced degree from Georgia State University, I agree that the Library of the University shall make it available for inspection and circulation in accordance with its regulations governing materials of this type. I agree that permission to quote from, to copy from, or to publish this thesis may be granted by the author or, in his/her absence, by the professor under whose direction it was written, or in his/her absence, by the Associate Dean, College of Health and Human Sciences. Such quoting, copying, or publishing must be solely for scholarly purposes and will not involve potential financial gain. It is understood that any copying from or publication of this dissertation which involves potential financial gain will not be allowed without written permission of the author.
Ashley Davis
Signature of theAuthor
Notice to Borrowers Page
All theses deposited in the Georgia State University Library must be used in accordance with the stipulations prescribed by the author in the preceding statement.
The author of this thesis is: Ashley Davis
314 Pine Tree Circle Decatur, GA 30032
The Chair of the committee for this thesis is: Kymberle Sterling, DrPH
Institute of Public Health Georgia State University P.O. Box 4018
Atlanta, GA 30302-4018
Users of this thesis who not regularly enrolled as students at Georgia State University are required to attest acceptance of the preceding stipulation by signing below. Libraries borrowing this thesis for the use of their patrons are required to see that each user records here the
information requested.
NAME OF USER ADDRESS DATE TYPE OF USE
vi
ASHLEY MICHELLE DAVIS
[email protected] 314 Pine Tree Circle
Decatur, GA 30032 (478) 951-8933
EDUCATION Georgia State University (GSU), Atlanta, GA
Masters of Public Health concentration in Prevention Sciences, May 2010
University at Albany, College of Arts and Sciences, Albany, NY
Bachelor of Science in Human Biology, May 2005
RESEARCH EXPERIENCE
Graduate Research Assistant 08/08-Present
Dr. Kymberly Sterling, Institute of Public Health, GSU,Atlanta, GA
Undergraduate Research Assistant 06/03-08/03
Dr. Anne Walsh, New York State Department of Health, Wadsworth Laboratory, Albany, NY
WORKEXPERIENCE
AmeriCorps Member 09/07-08/08
Volunteer Macon, Macon, Georgia
Academic Resource Specialist 10/06-08/07
Macon State College, Macon, Georgia
Tutor 11/05-06/06
Community Reach Incorporated, Jonesboro, GA
NYS Assembly Intern 01/05-05/05
New York State Assembly, Albany, NY
Lab Assistant 08/01-12/03
Dr. Greg Lnenicka, Biology Department at SUNY Albany, Albany, NY
COMPUTER SKILLS Proficient in Microsoft Word, Excel, and PowerPoint, and SPSS
TECHNICAL SKILLS
vii
Table of Contents
Acknowledgements... iv
List of Table...ix
Introduction...1
Alcohol Misuse and Depression in the General Population.......1
Alcohol Misuse and Depression in the U.S. Armed Forces.......3
Study Purpose...4
Research Questions...5
Review of the Literature.....6
Alcohol Misuse in the U.S...6
Alcohol Misuse among Groups...7
Alcohol Misuse among Veterans...11
Depression...14
Depression in the United States...15
Depression among Subgroups...15
Depression among Veterans...18
Alcohol Misuse and Depression ... 20
Alcohol Misuse and Depression among Veterans...20
Summary...22
Materials and Methods...23
Data Source ...23
Survey Procedures...23
Participants....24
Study Variables...26
Statistical Analyses... 26
Results... 31
Descriptive Characteristics... 31
Univariate Analyses...32
Multivariate Analyses...35
Discussion and Conclusion...41
Discussion...41
Alcohol Misuse and Depressive Symptomology...42
Limitations...44
Recommendations...45
Conclusion...46
viii
List of Tables
Table 1.1: Demographic Statistics and Frequencies of Eligible Armed Services
Population...28 Table 2.1: Demographic Statistics of Eligible Armed Services Population who Misuse
Alcohol...29 Table 2.2: Descriptive Statistics and T-Test for Age by Alcohol Misuse Group...30 Table 2.3: Demographic Statistics of Eligible Armed Services Sample with Depressive
Symptomology………... 31 Table 2.4: Descriptive Statistics and T-Test Results for Age by Presence of Depressive
Symptomology……... 32 Table 3.1: Univariate Logistic Regression for Alcohol Misuse and Associated
Variables………... 32 Table 3.2: Univariate analysis of Depressive Symptomology with Associated Independent Variables………... 34 Table 4.1: Multivariate Analysis of Associated Variables and Alcohol
Misuse... 37 Table 4.2: Multivariate Analysis with independent variables for Depression... 39
1
Chapter I
Introduction
1.1 Alcohol Misuse and Depression in the General Population
Alcohol misuse is a major public health concern because the condition is costly
yet preventable. Alcohol misuse is heavy consumption of alcohol, drinking more than 5
drinks of alcohol per occasion (Cherpitel & Ye, 2008). Men misuse alcohol more than
women. Only 4.6% of women have 12 or more days of heavy drinking (5 drinks per day),
compared to 16.5% of men (National Institute of Alcohol Abuse and Alcoholism, 2009).
As males get older, the percentage engaging in heavy drinking for 12 or more days a year
decreases from over 25% between ages 18 to 24 to 4.5% at age 65 and older (National
Institute of Alcohol Abuse and Alcoholism, 2009). Differences in alcohol misuse among
males exist within race, marital status, educational level, and income (National Institute
of Alcohol Abuse and Alcoholism, 2009).
Misuse of alcohol is one of the leading causes of morbidity and mortality,
resulting in over 107, 000 alcohol-related deaths every year (Fernandez, Hartman, &
Olshaker, 2006). Additionally, excessive alcohol use can have far-reaching effects on
physical and mental health. Alcohol misuse has been linked with liver disease, peripheral
Montgomery, & Tyas, 2009). As a result of these implications, alcohol misuse is one of
the costliest public health problems in the United States (Williams, et al., 2006).
2
Another health concern that is rising in prevalence and whose notoriety has
increased as a global public health issue is depression (Watts, 2008). Major depression is
estimated to affect 6.7% of Americans aged 18 and older (Chakraburtty, 2009). Similar to
alcohol misuse, depression has been associated with numerous health issues. Some of
these conditions are impairment, poor health, and mortality (Hasin, Goodwin, Stinson, &
Grant, 2005).
The marked similarities between alcohol misuse and depression have made both
disorders targets for research to find causal agents or risk factors for both. Substance use
and depressive disorders frequently co-exist (Gratzer, et al., 2004). Due to their common
co-occurrence, often one condition is recognized and the other condition is completely
neglected. The National Comorbidity Study found that 48.5% of women and 24.3% of
men with a lifetime alcohol-related problems also presented with major depression
(Curran, Flynn, Kirchner, & Booth, 2000). It is reported that of individuals who suffer
from depression, 25% acknowledge excessive alcohol consumption (Watts, 2008).
Symptoms of depression can be caused by drinking or the subsequent withdrawal from
drugs or alcohol (Curran, Booth, Kirchner, & Deneke, 2007). Alone, alcohol misuse and
depression are devastating conditions, but together, they have much larger implications
such as increased risk for suicide and deteriorating physical and mental health
An affliction with one disorder increases the risk for developing the other
disorder. Severe alcohol misuse can extend the length of time a person is depressed.
3
Excessive drinking can make life more stressful and relationships more difficult, which in
turn promotes depression (Conner, Pinquart, & Gamble, 2009). Alcohol misuse is also
associated with a downed mood and all-consuming sadness (Watts, 2008). On the other
hand, untreated depression increases the risk for relapse once alcohol use is abstained
(Pettinati, 2004). An individual suffering from depression may turn to alcohol under the
pretense that it will soothe their feelings (Watts, 2008). The cyclical nature of alcohol
misuse and depression can make the conditions much more difficult to detect and treat
(Watts, 2008).
1.2 Alcohol Misuse and Depression in the U.S. Armed Forces
Since excessive alcohol misuse and depression are complex disorders, they pose
special problems for those who are currently serving or have served in the United States
Armed Forces (Fernandez, et al., 2006). Life in the armed forces places extraordinary
demands on soldiers, which can extend out beyond the service obligation. Soldiers are
forced to live away from family and friends for periods of time and work in unsafe and
unpredictable environments (Fernandez, et al., 2006). These conditions put soldiers at
greater risk of alcohol abuse and depression.
Alcohol use is an integral part of military culture (Fernandez, et al., 2006). Men
constitute 85% of military personnel and also have heavier drinking patterns than women
co-workers, amount of alcohol consumption, and expectations of repercussions associated
with drinking, such as fighting, arguing with supervisors, sleeping on the job, and
4
showing up for work hung over (Fernandez, et al., 2006). Heavy alcohol use appears to
be more prevalent among younger soldiers; with certain branches of the armed forces
having higher prevalence than others (Fernandez, et al., 2006).
The prevalence of heavy drinking among soldiers 18 to 25 years old within the
last month was 27.3% compared to 15.3% among civilians of the same age (Fernandez, et
al., 2006). Among the branches of the military, Marines have the highest prevalence of
heavy drinkers aged 18 to 25 at 35.4%, while the Army, Navy, and Air Force have
prevalence rates of 27.6%, 26.0%, and 19.8% respectively (Fernandez, et al., 2006).
Alongside high rates of drinking, depression may also be rampant (Dedert, et al., 2009),
stemming from the cyclical nature of these disorders. Determining the existence of a
relationship between unhealthy alcohol use and depression among veterans is important
because of the trauma this group may have been exposed to during devastating wars
which may increase their risk for these conditions. Studying these issues among this
group can increase awareness of the comorbidity of alcohol misuse and depressive
symptoms and help with diagnosis of these conditions.
1.3 Purpose of Study
The aim of this study is to determine whether there is an association between
alcohol misuse and depressive symptomology among males who have served in the
makes this population a valuable source to study within public health. Extensive studies
have attempted to address causation as well as the association between the two
5
conditions. Although much research has been concentrated in populations such as the
elderly, emergency department patients, and primary care patients, few have examined
veteran groups. As a result of the special circumstances these groups face, exploring the
relationship veteran status has with both alcohol misuse and depressive symptomology
can have important public health implications for both the military and civilian worlds.
1.4 Research Questions
The purpose of this study is to extend current research on the relationship between
alcohol misuse and depressive symptomology among males who have served in the
armed forces. The following question will be addressed in this study:
1. Is there an association between alcohol misuse and depressive symptomology,
6
Chapter II
Review of the Literature
The aim of this study was to determine whether there was an association between alcohol
misuse, depressive symptomology, age, and racial/ethnic status among males with a history in
the U.S. Armed Forces. A literature review was needed to determine the association between
alcohol misuse and depressive symptoms and how age and racial/ethnic status influenced those
relationships. The literature review will include studies about alcohol misuse and depression in
the general population, followed by studies relating to alcohol misuse and depressive
symptomology among military personnel and veterans.
2.1 Alcohol Misuse in the United States
Alcohol consumption is common in the United States. Per capita, Americans consumed
2.31 gallons of ethanol for 2007 (National Institute on Alcohol Abuse and Alcoholism, 2009).
Ethanol is the main agent used in the production of alcoholic beverages. According to the
National Institute of Alcohol Abuse and Alcoholism, a standard drink contains 0.5 fl oz of
absolute ethanol which translates into 12 fl oz of beer, 5 fl oz of wine, or 1.5 fl oz of 80 proof
distilled liquor (National Institute on Alcohol Abuse and Alcoholism, 2005). Alcohol use
(National Institute on Alcohol Abuse and Alcoholism, 2005). Alcohol use can be categorized
into levels based on risk of developing alcohol-related problems. Categories of alcohol use are as
7
follows: low-risk drinking is non-problematic alcohol use consisting of 7 drinks per week; at-risk
drinking is drinking more than one drink per day; problem-drinking results in negative physical,
psychological, and social consequences; alcohol abuse results in lack of the ability to fulfill
responsibilities; and alcohol dependence is the total loss of control and the obsession with
alcohol and causes symptoms of withdrawal (Blow & Barry, 2003).
Alcohol misuse is defined as consuming five or more units of alcohol per occasion
(Cherpitel & Ye, 2008). Based on how alcohol misuse is defined, the condition does not fit into
any particular alcohol category. Alcohol misuse falls between at-risk drinking and problem
drinking. From January 2009 through June 2009, 23% of adults had at least 5 or more drinks in a
day at least once in the past year, increasing 1% from 22% in 2008 (National Center for Health
Statistics, 2009). Alcohol misuse has been estimated as low as 2% in primary care settings
(Fiellin, Reid, & O'Connor, 2000) to as high as 29% in primary care settings (Whitlock, Polen,
Green, Orleans, & Klein, 2004).
2.2 Alcohol Misuse Among Groups
2.2.1 Race
Prevalence among alcohol misuse between racial groups has not been thoroughly
documented through epidemiological studies or reports, but it has been established with national
with 17.5%, and African Americans with the lowest prevalence at 11.1% for 2008 (National
Institute of Alcohol Abuse and Alcoholism, 2009). The information that is reported in
epidemiological studies or reports is frequency of consumption and frequency of days of use. As
8
reported by the Office of Applied Studies, Alaska Natives and American Indians, who are
current drinkers, drank more on days they drank (6 drinks) than other racial groups. Current
drinkers were defined as individuals who drank alcohol in the last 30 days. Hispanics were the
next group to drink the most with 4 drinks, followed by whites and blacks with 3 drinks each,
and Asians with 2.5 drinks (Office of Applied Studies, 2003). On the other hand, the Substance
Abuse and Mental Health Service Administration reported whites having alcohol use rates of
51%, while blacks, Hispanics, and American Indian Natives/Alaska Natives had rates of 35.6%,
39.94% and 34.8% respectively (Department of Health and Human Services & Substance Abuse
and Mental Health Service Administration, 2000).
2.2.2 Age
Aside from racial dissimilarities, age is also a factor in alcohol misuse. The elderly is a
particularly sensitive population to alcohol misuse, because of biological, social, and
psychological changes associated with aging (Loukissa, 2007). As a result of these reasons, the
elderly tend to drink more. Some factors of these changes include loneliness, social isolation, the
loss of a significant other, and declining health due to acute or chronic conditions (Loukissa,
2007). In terms of determining prevalence in the elderly, ages 65 and older, the nature of the
survey affects the frequency of reported alcohol misuse. For instance, community surveys report
(Johnson, 2000). It is important to consider alcohol misuse among the elderly for the following
reasons: the under detection of alcohol misuse among the elderly, the comorbidity associated
with misuse, and the impact of this population on public health (Loukissa, 2007; Sarfraz, 2003).
9
The elderly are quickly becoming a large population who will place huge demands on the health
care system. Recognition of alcohol misuse among this group can greatly increase their quality
of life.
2.2.3 Education Level
Race plays a determining factor in how educational attainment affects alcohol misuse in
young adulthood. Paschall et al., found that low educational attainment was associated with
alcohol misuse among African-American young adults (2000). On the other hand, high
educational attainment was associated with alcohol misuse among Caucasian young adults
(Paschall, Flewelling, & Faulkner, 2000). Factors such as unemployment or emotional distress
did not account for the effect of low educational attainment on alcohol misuse. Overall, college
status and favorable alcohol use attitudes accounted for the racial differences in the relationship
between educational attainment and alcohol misuse (Paschall, et al., 2000). Although light or
moderate drinking is associated with consumption patterns in the middle and upper classes (van
Oers, Bongers, van de Goor, & Garretsen, 1999), cultural conceptions also play a large role in
consumption patterns.
Much like African Americans, Hispanic men are also at more risk for alcohol misuse
given low educational attainment and incomes of $20,000 or more (Slone, et al., 2006). Among
higher prevalence of consumption than Hispanics of Caribbean descent (Slone, et al., 2006;
Vega, Sribney, & Achara-Abrahams, 2003). Mexican American drinking patterns tend to shift
toward United States norms after being in the States for 5 years (Slone, et al., 2006). Mexican-
10
born men have a tendency to drink less overall but more per occasion, compared to Mexican
American men (Caetano & Mora, 1988). Overall, most research has shown that Hispanics have a
higher incidence of alcohol-related problems than Whites (Slone, et al., 2006).
2.2.4 Gender
Apart from race, gender differences are also present in alcohol misuse problems. Men
tend to have more problems with alcohol use and drink more than women (Nolen-Hoeksema,
2004). Differences between the genders have not been clarified (Slone, et al., 2006).
Interestingly, the difference between the genders disappears in heavy alcohol consumption
(Caetano, 1997). There are several risk factors that affect men and women’s consumption of
alcohol. One risk factor for this difference is the way in which men and women cope with
problems. It is suggested that men are more likely to avoid dealing with issues, making them
more prone to alcohol misuse than women (Cooper, Russell, Skinner, Frone, & Mudar, 1992).
Negative physiological activities may deter women from misusing alcohol, compared to
men (Nolen-Hoeksema & Hilt, 2006). Alcohol is metabolized faster in men than women, due to
women’s high fat to water ratio (Angove & Fothergill, 2003).Also, men are larger in stature than
women, leading women to quickly achieve higher levels of blood alcohol concentrations than
men who drink the same amount of alcohol (Scott, 2000). Even development of disease is
period of time and by drinking less alcohol than men (Angove & Fothergill, 2003).Men have a
slower advancement to brain damage than women who misuse alcohol (Nolen-Hoeksema & Hilt,
2006). Last, men drinking 6 or more drinks per day raise their risk for heart disease, while
11
women only need to consume 3 or more drinks per day to have the same level of risk for heart
disease (Nolen-Hoeksema & Hilt, 2006).
In addition to physiological factors, social factors also influence men and women’s
drinking habits. Women feel there is more social stigma for them drinking than for men
(Nolen-Hoeksema, 2004). One explanation for this occurrence is gender roles. Alcohol consumption is
considered to be acceptable as part of the male gender role, but not for the female gender role
(Chassin, Tetzloff, & Hershey, 1985). Research has shown that individuals who embody
feminine traits are less likely to consume alcohol regularly and when drinking alcohol, drink less,
particularly among women (Ricciardelli, Connor, Williams, & Young, 2001). Also, masculine
traits like aggression and overcontrol of emotion have been associated with heavy drinking in
men and women (Nolen-Hoeksema & Hilt, 2006).
2.3 Alcohol Misuse among Veterans
Each branch of the United States Armed Forces has a substance abuse program intended
to deal with alcohol and drug abuse among active duty military personnel only. Military
members that are identified as drug or alcohol dependent are detoxified, rehabilitated or referred
(Department of Defense, 1985). Core capabilities of the substance abuse program include:
education, deterrence, identification, referral, screening, targeted intervention, rehabilitation, and
affected military personnel (Department of Defense, 1985). Failure to comply with follow-up
and continued use of alcohol or drugs results in discharge from the military (Department of
Defense, 1985). Veterans of the Armed Forces are treated for alcohol abuse through the Veterans
12
Administration (VA) outpatient or inpatient rehabilitation center (United States Department of
Veteran Affairs, 2010).
Much of the information gathered about veterans and military personnel, with respect to
alcohol misuse, has been conducted within the VA health-care system or while soldiers are
deployed abroad. In 2003, 22.6% of veterans, compared to 21.6% of civilians, reported alcohol
misuse (Office of Applied Studies, 2005). An overwhelming consensus is that alcohol misuse is
the greatest threat among men younger than 30 (Hawkins, Lapham, Kivlahan, & Bradley, 2010).
Another risk factor that poses a problem for veterans and alcohol misuse is combat exposure.
Combat exposure was measured using the Combat Experiences Scale (CES). Exposure was
assessed through items such as being attacked or ambushed, seeing human remains, and other
items (Wilk, et al., 2010). The link between the two has been established in studies involving the
United Kingdom Armed Forces, the National Guard and active duty personnel, and Operation
Iraqi Freedom military personnel (Jacobson, et al., 2008; Milliken, Auchterlonie, & Hoge, 2007;
Rona, et al., 2007).
Rona et. al (2007) investigated the number and duration of deployments to Iraq and
Afghanistan with mental health and severe alcohol problems among the United Kingdom Armed
Forces. Among 5,547 veterans, deployments lasting longer than 9 months were significantly
experiencing severe alcohol problems, p< .001. Furthermore, soldiers with more than one
deployment were more likely to severely misuse alcohol. Up to 18% of soldiers struggled with
alcohol-related problems as a result of multiple deployments, p< .001.
13
Jacobson et. al (2008) explored alcohol use and pre- and post deployment among 48,481
United States military personnel, 45% white, 73.8% male. The study found a higher risk for
beginning heavy weekly drinking, binge drinking, and alcohol–related problems for Reserve and
National Guard deployed personnel than for nondeployed Reserve and National Guard
personnel. The study outlined several potential explanations for Reserve and National Guard
personnel to have elevated risk for new-onset heavy weekly drinking after deployment. Those
reasons included: improper training and preparation for these soldiers for the added tensions of
combat exposure; the stress of transitioning between military and civilian life, for the soldiers, as
well as their families; and diminished access to support services.
Milliken and colleagues (2007) studied the health effects of 88,235 active duty (90.8%
male) and National Guard soldiers returning from Iraq. One of the findings showed that soldiers,
both active duty and National Guard, returning from the war tested positive for alcohol problems.
Between 11% and 15% of active duty and National Guard soldiers, respectively, displayed
alcohol problems, but were rarely referred for treatment. Although treatment should be
considered the best solution, it can be perceived as counterproductive (Milliken, et al., 2007).
Once a soldier refers him or herself, his or her commander is involved and if the soldier is
non-compliant with the treatment program, this could reflect negatively on the soldier’s career
Alcohol misuse has been thoroughly linked to combat. But what many studies have
failed to investigate is the association between combat exposure and later alcohol misuse (Wilk,
et al., 2010). Wilk and colleagues (2010) found 25% of soldiers (1,120 soldiers, 96% male, ages
14
18-39) within their study screened positive for alcohol misuse 3-4 months after returning from
deployment. Combat exposures were found to be associated with screening positive for alcohol
misuse. Specifically, combat experiences that involved the threat of death or injury to oneself
were more likely to be associated with a positive screening for alcohol misuse. The atrocities and
casualties that soldiers see can continue to have effects on them long after the physical war has
ended. This can have damaging effects for veterans and increase their risk for alcohol misuse
(Wilk, et al., 2010).
2.4 Depression
According to the Diagnostic and Statistical Manual of Mental Disorders IV (DSM-IV),
major depressive disorder (MDD) is defined as having an abnormal mood or a loss of all interest
or pleasure which drastically interferes with an individual’s life for 2 weeks or more (American
Psychiatric Association, 2000). Additionally, five of the following symptoms must be present
during the depressed two weeks: appetite or weight change, unusual weight loss or a loss of
appetite, uncommon weight gain or an increase in appetite; sleep disturbances, either insomnia or
hypersomnia; activity disturbance; a general lack of energy; unusual guilt or self-reproach;
trouble concentrating or indecisiveness; and thoughts of death or suicide. Depression cannot be
due to physical illness, normal bereavement or bipolar disorder (American Psychiatric
2.5 Depression in the United States
It is estimated by the World Health Organization that up to 340 million people worldwide
will experience depression (Harris, 2004). Within the United States, almost 18 million people
15
have had a major depressive episode (National Institute of Mental Health). Data for the
prevalence of MDD has varied widely due to differences in instrument measures (Hasin, et al.,
2005). Based on the Epidemiologic Catchment Area (ECA), the prevalence of depression is 1.7%
to 3.4% for 12-month and 3.0% to 5.9% for lifetime (Kessler, et al., 2003). The National
Comorbidity Survey found current rates of the disorder at 8.6% and for lifetime rates, 14.9%
(Hasin, et al., 2005). Despite differences in prevalence rates, both the ECA and NCS concurred
that MDD is common within the United States (Hasin, et al., 2005; Kessler, et al., 2003).
2.6 Depression among subgroups
2.6.1 Age
Although MDD usually starts in the mid-20’s, the disorder can begin at any age (Harris,
2004). Children and the elderly manifest symptoms of MDD differently from other adults
(Harris, 2004). Children who suffer from depression may feign illness, refuse to go to school,
become clingy, or may fear the death of a parent. On the other hand, older adolescents may pout,
become disruptive at school, or may be irritable or pessimistic (National Institute of Mental
Health). Studies have concluded that about 2.5% of children and almost 8.3% of adolescents in
the United States suffer from depression (Birmaher, et al., 1996). A study sponsored by the
National Institute of Mental health of adolescents aged 9 to 17 reported the 6-month prevalence
of major depression at 4.9% (National Institue of Mental Health, 2000).
Furthermore, depression appears to be higher in young adulthood, tapers off in middle
Among the elderly, depressive symptomology has been found among 10-20% of
community-dwellers (Blazer, Burchett, Service, & George, 1991; Kennedy, et al., 1989). Depression is
16
particularly burdensome to the elderly because of the likelihood of greater medical illness,
disability, functional decline, and mortality (Whooley, Stone, & Soghikian, 2000).
Whooley et al. (2000) explored case-finding on depression and its effect on the number
of depression diagnoses, prevalence of the condition, and health care utilization of the elderly
over 2 years. Case-finding was determining whether a patient suffered from depression from a
Geriatric Depression Scale (GDS) and if so determining the severity. Dependent on the severity
of depression, if symptoms were mild or moderate, patients were evaluated and treated. If the
depression was severe, then the patient was referred to the Psychiatry Department. The study
found among 2,346 elderly, aged 65 and older, of whom almost 50% were male, initially, 14% of
patients were found to have depression. Among the patients, there was no difference in the
number of depression diagnoses (p= .39), prevalence of depression (p= .41), and health care
utilization (p= .15), between the case-finding group and the controls. In general, 50% of elderly
patients who were depressed were still depressed at the conclusion of the 2 year follow-up.
2.6.2 Gender
Among children and adolescents, gender and age differences in depressive symptoms
have been validated through the literature (Hankin & Abramson, 2001). Symptoms tend to be
relatively constant for girls up to age 12, where they increase, and peak at age 15. Contrastingly,
boys’ symptoms are slightly higher at age 12, but remain consistent otherwise (Twenge &
but for adolescents, there is a marked difference. Girls have an inclination to score higher on
depression measures, starting at age 13 (Hankin & Abramson, 2001). Besides gender and age,
17
racial and ethnic differences persist throughout depressive symptoms among children and
adolescents.
2.6.3 Race
The meta-analysis conducted by Twenge et al. (2002) corroborated previous literature of
higher rates of depression in Hispanic populations (Roberts, Roberts, & Chen, 1997). Hispanic
children disclosed more depressive symptoms than either Caucasian or African American
children. Additionally, depressive scores for Hispanic children were more than one standard
deviation higher than African American children and more than two thirds of a standard
deviation higher than Caucasian children (Twenge & Nolen-Hoeksema, 2002). Although this
difference is very significant, research has not addressed nor answered why depressive
symptoms are heightened among Hispanic children (Twenge & Nolen-Hoeksema, 2002).
Aside from racial and ethnic differences among children, variation in major depression
rates among racial and ethnic lines exists in adults as well. Differences between races for
depression largely depend on the type of depression being studied (Riolo, Nguyen, Greden, &
King, 2005). As reported by Kessler et al. (2003), African Americans report lower rates of major
depressive episode than Caucasians, when sociodemographic variations are taken into account.
Whites have been found to have a higher risk of suffering from depression when they are
impoverished (Riolo, et al., 2005). Hispanics have been shown to have rates of major depressive
Uneducated Mexican Americans have been found to have a higher prevalence of major
depression, compared to other races (Riolo, et al., 2005). Among Asians, depression rates are as
low as 3.5% (Zheng, et al., 1997).
18
Few studies have sufficiently assessed the rates of major depressive episode among
Native Americans because of the small numbers (Beals, et al., 2005). One important finding of
the Beals et al. (2005) study is rates of depression are lower among American Indian groups than
the general population. This finding highlighted the influence of cultural differences on the
instrument used for depression measurement. Some of the interview questions were difficult for
the tribes to understand and answer. Among some tribes, admittance of depressive symptoms
shows signs of weakness.
2.7 Depression among Veterans
Amongst veterans entering the VA health care system from 2000-2007, 14% were
diagnosed with depression (National Alliance on Mental Illness, 2009). Similar to alcohol
misuse, combat exposure and combat-related post-traumatic stress disorder (C-PTSD) have been
linked to depression among veterans (Koenen, et al., 2003). Koenen and colleagues (2003) found
these associations among Vietnam veterans. Amidst 237 veterans, ages 36-55, male-male twin
pairs, 90.4% white, twins with major depression were more likely to have combat exposure and
C-PTSD than twins without major depression, p< .05. Even after adjusting for combat exposure,
C-PTSD continued to be a predictor of major depression, p< .05.
A similar study by Dedert et al. (2009) examined the affiliation of lifetime trauma
exposure to psychiatric symptoms in 356 veterans (mean age 37; 78% male; 46% white) who
increased odds of major depressive disorder (p< .01). Additionally, co-morbidity of PTSD and
major depressive disorder was associated with combat exposure (p< .01). Furthermore, accidents
or disasters (such as natural disasters, serious motor-vehicle accidents, and any other serious
19
accidents) were also linked with depression (p< .01) and both depression and PTSD (p< .01),
with an increased odds of 192% and 258% respectively. Exposure to traumatic life experiences
were assessed for before, during, or after military service. Overall, trauma exposure besides
war-related traumatic stress was war-related to current psychiatric status among veterans who served after
9/11 (Dedert, et al., 2009).
The Veterans Health Administration (VHA) provides specialty inpatient and outpatient
mental health services at its medical centers and community-based outpatient clinics.
Readjustment counseling is also available for veterans at any of the VA’s Vet Centers. The
program is centered around recovery, making sure each veteran achieves their full potential.
Some of the VA’s many services include: specialized PTSD services, psychosocial rehabilitation
and recovery services, suicide programs, and evidence based psychotherapy programs. These
services are available in specialty clinics, primary care clinics, nursing homes, and residential
care facilities (United States Department of Veteran Affairs, 2010).
2.8 Alcohol Misuse and Depression
Many studies have found an association between depression and level of alcohol
consumption (Alati, et al., 2005; Dixit & Crum, 2000). But, in other studies, the relationship has
been negative for some measures of alcohol consumption (Graham & Schmidt, 1999; Wang &
Patten, 2001). Study findings may differ as a result of the ways depression and alcohol are
Graham et al. (2007) concluded that the magnitude of the relationship between
depression and alcohol consumption is influenced by measurement of these variables.
Depression is sensitive to measurement when determining gender differences between
20
depression scores. The link between alcohol consumption and depression was consuming large
amounts of alcohol per occasion, which was stronger for women than for men. Alcohol
consumption’s link to depression was consuming larger amounts per occasion, which appeared
to be even stronger for women than men. This finding also validated that drinking patterns play
a more significant role in depression than overall volume of consumption (Rehm J. , et al., 2004).
Haynes and colleagues (2005) tested alcohol consumption as a risk factor for depression
and anxiety. Men who binge drank on a monthly basis had a three-fold increased odds of anxiety
and depression at follow-up. No such association was established among women (Haynes, et al.,
2005). This finding supports the idea that drinking patterns may be more significant than volume
of consumption.
2.9 Alcohol Misuse and Depression Among Veterans
Alcohol misuse and depression have been studied among soldiers currently deployed
during war. Felker and colleagues (2008) examined the characteristics of military personnel of
Operation Iraqi Freedom (OIF) who sought mental health during deployment. Of 296 soldiers,
almost 75% were male between the ages of 18 and 24, 32% presented with depressive disorders
and 11% experienced severe alcohol misuse. Uncertainty regarding alcohol misuse existed
because the AUDIT-C asks about use over the last 12 months. Additionally, there may have been
Gutierrez, & McFall, 2008). This study found that although women were a smaller subset of the
population, they were more likely to access mental health services.
21
The co-morbidity between alcohol misuse and depressive symptoms has been shown to
exist well beyond war times. A study by Babic and colleagues (2004) analyzed whether there
were differences between PTSD, depression, and alcohol misuse among former prisoners of war
and veterans with no detainment. Among 160 male war veterans, former prisoners of war
experienced higher levels of trauma than war veterans who were not detainees, p< .05. Former
prisoners of war exhibited symptoms of PTSD 22% more than war veterans, p< .05. Likewise,
former prisoners of war experienced 20% more depressive disorders than veterans without
detainment experience, p< .05. Statistically significant differences were not found for alcohol
misuse among both prisoners of war and those who were not prisoners of war. Overall, the
severity and extent of prisoners of war traumatic experiences increased the higher numbers of
PTSD and depression diagnoses among this group, as compared to veterans who were not
prisoners of war.
2.10 Summary
Today, the Armed Forces are filled to capacity with individuals who have volunteered to
serve their country. Presently, a major war is ongoing that is changing the lives of both the
occurring. Once these soldiers leave the military, they also carry with them the casualties and
trauma that they have experienced. Soldiers exposed to these types of ordeals are at more risk for
22
developing mental illness and alcohol-related problems. Public health professionals need to be
aware of the special circumstances facing this vulnerable group of people.
Many of the studies addressing this complex issue have been extremely localized. Studies
have focused exclusively on VA populations or active duty soldiers after deployment. Very little
has focused on a representative, national sample of veterans or active duty soldiers. Through this
study, a nationally representative sample of veterans will be used to address the association
23
Chapter III
Methods
3.1 Data Source
Data from NHANES 2005-2008 were used for this study. NHANES data is collected
through the National Center for Health Statistics. This data is a cross-sectional survey of the
non-institutional US civilian population with no identifiers. About 5,000 people are surveyed yearly.
NHANES oversamples people older than age 60, African Americans, and Hispanics to ensure
representativeness. Individuals range in age from 0 to over 80 years old. Survey topics included
demographic information, anthropometric measures, socioeconomic indicators, and dietary and
health-related questions. Consecutive surveys from 2005 through 2008 were used to increase the
sample size. The NHANES data for this study for the years 2005-2008 utilized stratified
multistage probability sampling. Sampling was based on selection of clusters among households
within single counties (National Center for Health Statistics, 2005). NHANES data was used for
this study because it was a publicly available data set on a nationally representative sample.
3.2 Survey Procedures
Households selected to participate in the survey are notified through a letter from the
National Center for Health Statistics Director.Interviews are then conducted in participants’
24
homes via computer-assisted technology and interviewers. Mobile centers are set up within the
county to gather participants’ health measurements.
3.3 Participants
The population targeted in this study was males, ages 20 and older, who have served in
the United States Armed Forces. The sample included men of all races: Hispanic, Mexican,
White, Black, and those who classified themselves as multiracial. The total number of subjects
included 1,381 men.
3.4 Study Variables
The following variables were selected from the demographic and questionnaire sections
for the study. All variables were self-reported by the participants.
Race
Race included Hispanic, Mexican, White, Black, Other, Indian, Alaska Native,
Guamanian, Samoan, Other Pacific Islander, Asian Indian, Chinese, Filipino, Japanese, Korean,
and Vietnamese. Race was measured by the following question, “What race {do you/does SP}
combining Hispanic and Mexican into Hispanic. Those whose race was not white or black were
coded as other.
Age
25
Age was reported in years. Age was determined based on the question, “Best age in years
of the sample person at time of HH screening.” The variable was recoded into 4 categories:
20-39 years old, 40-59 years old, 60-79 years old, and 80 years of age and higher.
Marital Status
Marital status included married, widowed, divorced, separated, living with partner, and
never married. The variable was recoded into 3 categories: Married/Living with Partner,
Widowed/Divorced/Separated, and Never Married.
Education Level
Education level included two questions in NHANES, one for youth ages 6-19 and the
other for adults aged 20 and older. This study utilized the question asking the education level for
those aged 20 and older. Education level categories included on NHANES were: less than 9th
grade, 9th-11th grade, high school diploma or GED, some college or associates degree, and
college graduate or above. For purposes of this study, some college and associates degree were
combined into some college. The variable was recoded into 4 categories: less than high school,
high school diploma/general equivalency diploma, some college, and college graduate or higher.
Income was categorized and ranged from $0- $100,000 or more. For this study, the
variable was recoded into 5 categories: $0-$19,999, $20,000-$34,999, $35,000-$54,999,
$55,000-$74,999, and $75,000 and higher.
Alcohol Misuse
Alcohol misuse was defined as consuming 5 or more drinks per occasion. Misuse was
determined by the number of drinks a person consumed on days that an individual drank. The
measure for alcohol misuse was one question: Was there ever a time in your life when you drank
26
5 or more drinks of any kind of alcoholic beverage almost every day? The variable was
dichotomized into: 0- no (for those who did not misuse alcohol) and 1- yes (for those who
misused alcohol).
Depressive Symptomology
Depressive symptomology was defined as a composite score of 5 or more ascertained
from a composite score of NHANES survey questions based on depressed mood, interest or
pleasure in doing things, sleep habits, energy levels, changes in appetite, self-worth,
concentration, changes in speech, and thoughts of death. The measures for depressive
symptomology included the following set of questions: Over the last 2 weeks, how often have
you been bothered by the following problems: little interest or pleasure in doing things?; feeling
down, depressed, or hopeless?; trouble falling or staying asleep, or sleeping too much?; poor
appetite or overeating?; feeling bad about yourself - or that you are a failure or have let yourself
or your family down?; trouble concentrating on things, such as reading the newspaper or
watching TV?; and thoughts that you would be better off dead or of hurting yourself in some
depression by the DSM IV’s definition, the sample size turned out very small. It was appropriate
to examine symptoms of depression instead.
3.5 Statistical Analysis
SPSS 17.0 for Windows was used to perform all analyses. Descriptive frequencies were
obtained for demographics and included the sample number and percentages. Additionally,
descriptive frequencies were obtained for alcohol misuse and depressive symptomology using
chi-square tests to attain the frequencies, percentages, and p-values. T-test statistics for
27
continuous variables were used to acquire the mean, standard deviation, and p-value for both
alcohol misuse and depressive symptomology. Age was treated as a continuous variable to obtain
the mean age of both the alcohol misuse and depressive symptomology groups and was treated
as categorical to determine which age groups were more at risk of alcohol misuse and depression
symptoms.
Binary logistic regression was used to test for associations between alcohol misuse and
depressive symptomology. This procedure was also used to test these dependent variables
against educational attainment, income, race, marital status, and age, which served as
independent variables and covariates. Logistic regression was used to address association
between alcohol misuse, depressive symtomology, and veteran status, which was the first
research question. Logistic regression was also used to address the second and third research
questions of veteran status and its association to age, depressive symptomology and alcohol
misuse and whether race/ethnicity was associated with alcohol misuse and depressive symptoms
28
Chapter IV
Results
The sample consisted of 1,381 males who had a history of serving in the United States
Armed Forces (Table 1.1). This sample consisted of mostly white, 60-79 year old men whose
income ranged between $20,000- $54,999. Most individuals within this cohort were married,
with some college experience. Additionally, it is important to note that, income level had a large
amount of missing with participants refusing to answer or not knowing their yearly income.
4.1 Descriptive Characteristics
Table 1.1 Demographic Statistics and Frequencies of Eligible Armed Services Population
Variables N %
Hispanic 123 8.9
White 934 67.6
Black 295 21.4
Other 29 2.1
Total 1381 100.0
Marital Status
Married/Living with Partner 966 69.9
Widowed/Divorced/Separated 316 22.9
Never Married 98 7.1
Total 1380 99.9
Education Level
<High School 270 19.6
HS/GED 379 27.4
Some College 437 31.6
College Graduate+ 295 21.4
Total 1381 100.0
Age
20-39 116 8.4
40-59 310 22.4
60-79 689 49.9
80+ 266 19.3
Total 1381 100.0
Income
0-19,999 237 17.2
20,000-34,999 322 23.3
35,000-54,999 285 20.6
55,000-74,999 147 10.6
75,000+ 144 10.0
[image:39.612.69.549.583.711.2]Total 1135 82.2
Table 2.1 Demographic Statistics of Eligible Armed Services Population who Misuse Alcohol
Variables Alcohol
Misuse
P-Value
N Yes N No
Race .045
Hispanic 19 17.3% 62 8.8%
White 70 63.6% 486 68.8%
Black 18 16.4% 142 20.1%
Other 3 2.7% 16 2.3%
Total 110 100.0% 706 100.0%
Marital Status <.001
Married/Living with Partner 66 60.0% 518 73.4%
Widowed/Divorced/Separated 26 23.6% 145 20.5%
Never Married 18 16.4% 43 6.1%
Total 110 100.0% 706 100.0%
Education Level .001
<High School 19 17.3% 93 13.2%
HS/GED 41 37.3% 180 25.5%
Some College 38 34.5% 242 34.3%
College Graduate+ 12 10.9% 191 27.1%
Total 110 100.0% 706 100.0%
Age <.001
20-39 33 30.0% 58 8.2%
40-59 45 40.9% 161 22.8%
60-79 31 28.2% 369 52.3%
80+ 1 0.9% 118 16.7%
Total 110 100.0% 706 100.0%
Income .134
0-19,999 20 21.5% 100 17.3%
20,000-34,999 23 24.7% 167 28.9%
35,000-54,999 24 25.8% 138 23.9%
55,000-74,999 18 19.4% 76 13.1%
75,000+ 8 8.6% 97 16.8%
Total 93 100.0% 578 100.0%
Depression .041
No 84 77.1% 593 84.8%
Yes 25 22.9% 106 15.2%
Total 109 100.0% 699 100.0%
For alcohol misuse, only 816 participants completed the questionnaire. Of these, 110
males were classified as misusing alcohol, based on the definition of drinking 5 or more drinks
per occassion (Table 2.1). Both income level and depression do not total 110 because of missing
data. Observed among the group race (p< .05), marital status (p< .001), education level (p=
.001), age (p < .001), and depressive symptomology (p< .05) were all statistically significant
with respect to alcohol misuse. Among those that suffered from alcohol misuse the majority were
white. This group was either married or living with a partner and completed high school or a
GED. Over 40.0% of the population was between the ages of 40-59. Alcohol misusers with
depressive symptomology were less than 25% of the entire group. Table 2.2 provides the mean
age of individuals misusing and not misusing alcohol. . In this sample, those classified as
misusing alcohol were significantly (p<.001) younger (M=48.3 years) than those who did not
misuse (M=64.14).
[image:41.612.64.546.350.395.2]31
Table 2.2 Descriptive Statistics and T-Test for Age by Alcohol Misuse Group
Variable Alcohol Misuse P-Value
Yes No
Age 48.30+15.768 64.14+14.458 <.001
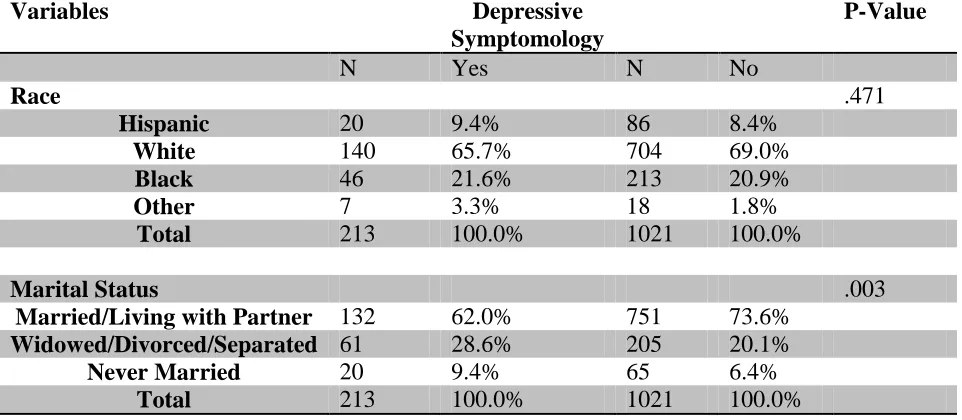
Table 2.3 Demographic Statistics of Eligible Armed Services Sample with Depressive Symptomology
Variables Depressive
Symptomology
P-Value
N Yes N No
Race .471
Hispanic 20 9.4% 86 8.4%
White 140 65.7% 704 69.0%
Black 46 21.6% 213 20.9%
Other 7 3.3% 18 1.8%
Total 213 100.0% 1021 100.0%
Marital Status .003
Married/Living with Partner 132 62.0% 751 73.6%
Widowed/Divorced/Separated 61 28.6% 205 20.1%
Never Married 20 9.4% 65 6.4%
[image:41.612.67.548.502.712.2]Education Level .011
<High School 51 23.9% 173 16.9%
HS/GED 55 25.8% 288 28.2%
Some College 74 34.7% 318 31.1%
College Graduate+ 33 15.5% 242 23.7%
Total 213 100.0% 1021 100.0%
Age <.001
20-39 15 7.0% 91 8.9%
40-59 77 36.2% 209 20.5%
60-79 86 40.4% 541 53.0%
80+ 35 16.4% 180 17.6%
Total 213 100.0% 1021 100.0%
Income .004
0-19,999 53 29.6% 153 18.2%
20,000-34,999 51 28.5% 248 29.5%
35,000-54,999 42 23.5% 213 25.3%
55,000-74,999 20 11.2% 110 13.1%
75,000+ 13 7.3% 118 14.0%
Total 179 100.0% 842 100.0%
Alcohol Misuse .041
No 106 80.9% 593 87.6%
Yes 25 19.1% 84 12.4%
Total 131 100.0% 677 100.0%
A total of 213 males exhibited depressive symptomology. Neither income nor alcohol
misuse totaled 213 because of missing data. Table 2.3 displays the characteristics of the sample.
All variables were statistically significant at p < .05, with the exception of race. Similar to those
who did not experience depressive symptoms, males experiencing depressive symptoms were
either married or living with a partner. Additionally, almost half of the sample had some college
experience. This group was older, with almost half of those males being between the ages of
60-79. Table 2.4 gives the mean age of individuals with depression symptoms to be 62.11. Income
levels are significantly lower in this group, with many making less than $20,000 a year. Only
about one fifth of males in this group are categorized as misusing alcohol.
Table 2.4 Descriptive Statistics and T-Test Results for Age by Presence of Depressive Symptomology
Variable Depressive
Symptomology
P-Value
Yes No
Age 62.11+15.439 64.42+14.860 .046
4.2 Univariate Analyses
33
Table 3.1 Univariate Logistic Regression for Alcohol Misuse and Associated Variables
Variables Odds Ratio (OR) P-Value 95% CI
Race
White 1.00 .052 Reference
Black 0.88 .649 (0.51-1.53)
Hispanic 2.13 .010 (1.20-3.77)
Other 1.30 .681 (0.37-4.58)
Marital Status
Married/Living with Partner 1.00 .001 Reference
Widowed/Divorced/Separated 1.41 .172 (0.86-2.30)
Never Married 3.29 < .001 (1.79-6.03)
Education Level
<High School 3.25 .002 (1.52-6.98)
HS/GED 3.63 < .001 (1.85-7.12)
Some College 2.50 .008 (1.27-4.91)
College Graduate+ 1.00 .002 Reference
Age
20-39 67.14 < .001 (8.96-503.14)
40-59 32.98 .001 (4.48-242.68)
60-79 9.91 .025 (1.34-73.40)
80+ 1.00 < .001 Reference
Income
[image:43.612.63.549.356.721.2]20,000-34,999 1.67 .233 (0.72-3.88)
35,000-54,999 2.11 .082 (0.91-4.89)
55,000-74,999 2.87 .020 (1.19-6.96)
75,000+ 1.00 .148 Reference
Depression
No 1.00 --- Reference
[image:44.612.68.546.73.185.2]Yes 1.67 .042 (1.02-2.72)
Table 3.1 displays the univariate logistic regression analysis predicting alcohol misusers
from race, marital status, education, age, income, and depression status. Reference groups were
34
selected because the literature indicated that each reduced the likelihood of misusing alcohol.
The reference groups were: being white, either living with a partner or being in a marriage,
attaining a bachelor’s degree or higher, older age, a high income, and no depressive
symptomology.
The variable with the strongest association to alcohol misuse was age (p= < .001).
Compared to the reference group, 20-39 year olds had the highest odds (OR= 67.14; CI=
8.96-503.14), followed by 40-59 year olds (OR= 32.98; CI= 4.48-242.68), and 60-79 year olds (OR=
9.91; CI= 1.34-73.40). All levels of educational attainment were significantly associated with
alcohol misuse compared to the reference group. Generally, the odds of alcohol misuse were
higher for those with less education, compared to those who were college graduates.
Non-completion of high school (OR= 3.25; CI= 1.52-6.98) and a high school diploma or GED (OR=
3.63; CI= 1.85-7.12) unveiled a 252% and 263% increased odds of misusing alcohol,
respectively. Marital status also revealed a strong association to alcohol misuse (p= .001). Never
group (OR= 3.29; CI= 1.79-6.03). For race, being Hispanic was the only statistically significant
group with increased odds of 122% for alcohol misuse (OR= 2.22; CI= 1.20-3.77). Males
earning less than $20,000 and those earning $55,000-$74,999 were highly associated with
alcohol misuse. High earners exhibited a 187% increased odds of alcohol misuse (OR= 2.87; CI=
1.19-6.96), compared to those making over $75,000. Low income earners presented a 143%
increased odds of alcohol misuse (OR= 2.43; CI= 1.02-5.77). Overall, income was not a
significant variable in the model, p= .148. Last, suffering from depressive symptomology was
positively associated with alcohol misuse (OR= 1.67; CI= 1.02-2.72).
[image:45.612.63.547.402.712.2]35
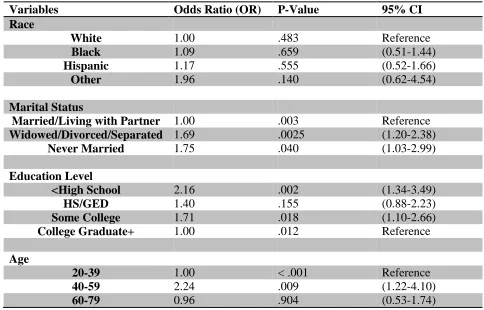
Table 3.2 Univariate analysis of Depressive Symptomology with Associated Independent
Variables
Variables Odds Ratio (OR) P-Value 95% CI
Race
White 1.00 .483 Reference
Black 1.09 .659 (0.51-1.44)
Hispanic 1.17 .555 (0.52-1.66)
Other 1.96 .140 (0.62-4.54)
Marital Status
Married/Living with Partner 1.00 .003 Reference
Widowed/Divorced/Separated 1.69 .0025 (1.20-2.38)
Never Married 1.75 .040 (1.03-2.99)
Education Level
<High School 2.16 .002 (1.34-3.49)
HS/GED 1.40 .155 (0.88-2.23)
Some College 1.71 .018 (1.10-2.66)
College Graduate+ 1.00 .012 Reference
Age
20-39 1.00 < .001 Reference
40-59 2.24 .009 (1.22-4.10)
80+ 1.18 .621 (0.61-2.27)
Income
0-19,999 3.14 .001 (1.64-6.04)
20,000-34,999 1.87 .059 (0.98-3.57)
35,000-54,999 1.79 .085 (0.92-3.47)
55,000-74,999 1.65 .188 (0.78-3.48)
75,000+ 1.00 .005 Reference
Alcohol Misuse
No 1.00 --- Reference
Yes 1.70 .010 (1.13-2.53)
[image:46.612.67.545.73.238.2]36
Table 3.2 presents the associations between depressive symptomology and the
independent variables. Again, reference groups were determined based on review of the
literature. The reference group for age was switched from the 80 and older group to the 20-39
year old group because younger persons are less likely to suffer from depression than older
persons. The reference groups selected decreased the likelihood of experiencing depressive
symptomology: being white, either living with a partner or being in a marriage, attaining a
bachelor’s degree or higher, younger age, a high income, and no alcohol misuse. Race was the
only variable that yielded no association to depressive symptomology. However, income
revealed the strongest association to depressive symptomology. Low-income males, $0-$19,000,
had a 214% increased odds of experiencing depressive symptomology (OR= 3.14; CI=
1.64-6.04). The next strongest association was age. Males ages 40-59 had a 124% times increased
odds of facing depressive symptoms (OR= 2.24; CI= 1.22-4.10) compared to the reference
symptoms (OR= 2.16; CI= 1.34-3.49) than veterans who were college graduates. Even those
with some college background had a 71% increased odds of enduring depression symptoms
(OR= 1.71 CI= 1.10-2.66) as compared to college graduates. Another factor that showed an
increased risk among this population was having never been married or being separated,
divorced, or widowed. Veterans with no history of being married were 75% more likely to
encounter depressive symptomology (OR= 1.75; CI= 1.03-2.99). Similarly, widowers, divorcees,
and separated veterans were almost 70% more likely to encounter depressive symptoms (OR=
1.69; CI= 1.20-2.38). Those misusing of alcohol were equally as likely to experience depressive
37
symptomology as widowers, divorcees, and separated veterans at 70% (OR= 1.70; CI=
1.13-2.53).
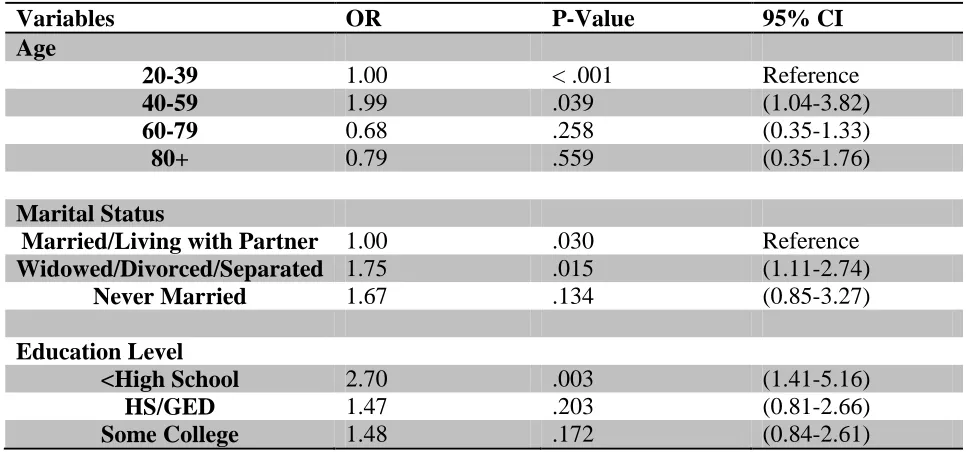
4.3 Multivariate Analyses
Among the independent variables, education level and income were moderately
associated and significant, r(1135)= .388, p= < .001. The significant Pearson’s coefficient
suggests an overlap in education and income. As a result of this relationship, education level was
used in place of income as an indicator of socioeconomic status in the multivariate analyses.
Controlling for age, race, marital status, and educational attainment with respect to
[image:47.612.65.545.673.717.2]alcohol misuse, all were statistically significant except for race.
Table 4.1 Multivariate Analysis of Associated Variables and Alcohol Misuse
Variables OR P-Value 95% CI
Age
40-59 39.04 < .001 (5.19-293.76)
60-79 10.62 .021 (1.42-79.54)
80+ 1.00 < .001 Reference
Race
White 1.00 .026 Reference
Black 0.49 .020 (0.27-0.90)
Hispanic 1.59 .145 (0.85-2.97)
Other 0.80 .748 (0.21-3.05)
Marital Status
Married/Living with Partner 1.00 .011 Reference
Widowed/Divorced/Separated 1.87 .024 (1.09-3.20)
Never Married 2.33 .016 (1.17-4.61)
Education Level
<High School 3.85 .001 (1.68-8.82)
HS/GED 3.01 .003 (1.47-6.16)
Some College 1.73 .133 (0.85-3.55)
[image:48.612.65.547.72.352.2]College Graduate+ 1.00 .002 Reference
Table 4.1 displays the independent variables that were associated with alcohol misuse.
Age was clearly significant for all categories. The strongest association was among the 20-39
year olds (OR= 71.42; CI= 9.24-551.79). Next, 40-59 year olds were at 3804% increased odds
of misusing alcohol than veterans older than 80 (OR= 39.04; CI= 5.19-293.76). Last, senior
citizens between the ages of 60 and 79 were 962% as likely to misuse alcohol compared to those
over the age of 80 (OR= 10.62; CI= 1.42-79.54). As age increased, alcohol misuse risk
decreased.
The only racial/ethnic group with any association with alcohol misuse is blacks. But
within this group, being black serves as a protective factor against alcohol misuse (OR= 0.49;
CI=0.27-0.90), with a 51% reduction in the odds of misusing alcohol.
Widowers, divorcees, and separated and those that have never been married had an
elevated risk of alcohol misuse. Veterans who have never married had the highest risk at 133%