www.hydrol-earth-syst-sci.net/20/3027/2016/ doi:10.5194/hess-20-3027-2016
© Author(s) 2016. CC Attribution 3.0 License.
Mekong River flow and hydrological extremes under climate change
Long Phi Hoang1, Hannu Lauri2, Matti Kummu3, Jorma Koponen2, Michelle T. H. van Vliet1, Iwan Supit1, Rik Leemans4, Pavel Kabat1,5, and Fulco Ludwig1
1Water Systems and Global Change Group, Wageningen University, P.O. Box 47, 6700 AA Wageningen, the Netherlands 2EIA Finland Ltd., Sinimäentie 10B, 02630 Espoo, Finland
3Water & Development Research Group, Aalto University, P.O. Box 15200, Aalto, Finland
4Environmental Systems Analysis group, Wageningen University, P.O. Box 47, 6700 AA Wageningen, the Netherlands 5International Institute for Applied System Analysis, Schlossplatz 1, 2361 Laxenburg, Austria
Correspondence to:Long Phi Hoang ([email protected]; [email protected])
Received: 16 October 2015 – Published in Hydrol. Earth Syst. Sci. Discuss.: 10 November 2015 Revised: 10 June 2016 – Accepted: 29 June 2016 – Published: 29 July 2016
Abstract. Climate change poses critical threats to water-related safety and sustainability in the Mekong River basin. Hydrological impact signals from earlier Coupled Model In-tercomparison Project phase 3 (CMIP3)-based assessments, however, are highly uncertain and largely ignore hydrolog-ical extremes. This paper provides one of the first hydro-logical impact assessments using the CMIP5 climate projec-tions. Furthermore, we model and analyse changes in river flow regimes and hydrological extremes (i.e. high-flow and low-flow conditions). In general, the Mekong’s hydrological cycle intensifies under future climate change. The scenario’s ensemble mean shows increases in both seasonal and annual river discharges (annual change between+5 and+16 %, de-pending on location). Despite the overall increasing trend, the individual scenarios show differences in the magnitude of discharge changes and, to a lesser extent, contrasting di-rectional changes. The scenario’s ensemble, however, shows reduced uncertainties in climate projection and hydrologi-cal impacts compared to earlier CMIP3-based assessments. We further found that extremely high-flow events increase in both magnitude and frequency. Extremely low flows, on the other hand, are projected to occur less often under climate change. Higher low flows can help reducing dry season wa-ter shortage and controlling salinization in the downstream Mekong Delta. However, higher and more frequent peak dis-charges will exacerbate flood risks in the basin. Climate-change-induced hydrological changes will have important implications for safety, economic development, and ecosys-tem dynamics and thus require special attention in climate change adaptation and water management.
1 Introduction
The Mekong River basin is one of the most important trans-boundary rivers in Southeast Asia. Starting from the Tibetan Plateau, the 4800 km long river flows across six different countries, namely China, Myanmar, Laos PDR, Thailand, Cambodia, and finally Vietnam before draining into the East Sea (also known as South China Sea). The economies and societies along the Mekong are strongly linked to its abun-dant water resources (Mekong River Commission – MRC, 2010). The most important water-dependent economic sec-tors include agriculture, energy (i.e. hydropower production), and fishery (Västilä et al., 2010; MRC, 2011a). Currently, the Mekong basin is home to about 70 million people and this population is expected to increase to 100 million by 2050 (Varis et al., 2012). Economic development has been accel-erating rapidly over the last decades together with substan-tial increases in water resources use (Jacobs, 2002; Lebel et al., 2005; Piman et al., 2013). Given high dependencies on water in the basin, the issues of securing water safety and long-term sustainability are especially important for water resources management.
devel-opments. For instance, Västilä et al. (2010) and Hoanh et al. (2010) modelled the Mekong’s flow regimes under sev-eral climate change scenarios and suggested a likely inten-sification of the hydrological cycle, resulting in increases in annual and seasonal river discharges. Consequently, they also suggest increasing flood risks during the wet season in the Cambodian and Vietnamese floodplain due to increasing river flow. Other studies (e.g. Lauri et al., 2012; Kingston et al., 2011) also suggest possible discharge reduction in the dry season under some individual climate change scenarios.
Although many studies about climate change impacts on the Mekong’s hydrology exist, two major challenges in understanding hydrological responses to climate change remain. First, existing hydrological impact assessments prove highly uncertain. In particular, impact signals differ markedly in the magnitudes and even directions of changes across the individual global circulation models (GCMs) and climate change scenarios. Kingston et al. (2011) quantified uncertainties related to the choice of GCMs and climate sce-narios in projecting monthly discharge changes and show a large range between−16 and+55 %. They also noted that hydrological changes under different GCMs and scenarios differ remarkably in magnitude and even in contrasting di-rections. Another study by Lauri et al. (2012) also reported a wide range of discharge change between−11 and+15 % during the rainy season and between−10 and+13 % during the dry season. Both studies noted the uncertainty in hydro-logical impact signals, which is mainly associated with un-certainties in the climate change projection, especially pre-cipitation changes. Given these uncertainties, they all also stress the importance of using multiple GCMs and several scenarios (i.e. an ensemble approach) rather than relying on a single model or climate change projection. Compared to uncertainties in the future climate, uncertainties relating to hydrological models’ schematization and parameterization seem less important for the Mekong basin. Regarding hy-drological models’ skill, many studies including Hoanh et al. (2010), Västilä et al. (2010), Kingston et al. (2011), and Lauri et al. (2012) reported sufficient performance in captur-ing the dynamics of the Mekong’s hydrology. Several pre-vious studies also reported lower modelling skill in the up-stream stations (e.g. Chiang Saen) compared to the down-stream stations (Kingston et al., 2011; Lauri et al., 2012; Wang et al., 2016).
Notably, all earlier studies are based on the SRES emission scenarios (Nakicenovic et al., 2000), which were used in the Coupled Model Intercomparison Project phase 3 (CMIP3). These scenarios, which only include non-intervention sce-narios, have recently been replaced by the Representative Concentration Pathways (RCPs) scenarios (Van Vuuren et al., 2011; Stocker et al., 2013), resulting in a broader range of climate change. These most recent climate change scenar-ios (i.e. the CMIP5) are not yet routinely used to assess the hydrological impacts in the Mekong basin. The CMIP5 sce-narios also exhibit important improvements, both in terms
of the GCMs’ technical development (Taylor et al., 2011; Knutti and Sedláˇcek, 2013) and the efficiency to reproduce the historic climate conditions (Hasson et al., 2016). These important improvements and updates are highly relevant and require one to update the hydrological projections for the Mekong. In this study, we will do this update and reflect whether the CMIP3 uncertainties relating to the hydrologi-cal signal will be reduced as well.
Second, although hydrological extremes under future cli-matic change are very relevant for water management and climate change adaptation (Piman et al., 2013; Cosslett and Cosslett, 2014), very few insights have been gained on this topic so far in the Mekong. Previous studies typi-cally analysed hydrological changes at monthly and seasonal timescales and few studies focused on changes in frequency and severity of extreme events (i.e. climate-change-induced floods and droughts). This knowledge gap also relates to the fact that uncertainties, especially those relating to future monsoon and precipitation changes, prevail in the CMIP3 cli-mate change projections. Given high level of policy relevance and important improvements in CMIP5 climate change pro-jections, future changes in extreme high and low river flows should be comprehensively assessed and made available to decision makers.
In this paper, we aim to address these knowledge gaps in understanding the Mekong’s hydrology under climate change. A distributed hydrological model was set up and calibrated for the whole Mekong River (Sects. 3.1 and 4.1). We selected a set of 10 climate change experiments for five GCMs and two RCPs from the CMIP5 and performed a downscaling and bias correction on the climate model out-put (Sect. 3.2). Future changes in precipitation and temper-ature (Sect. 4.2) and subsequently the Mekong’s annual and monthly discharge changes were quantified (Sect. 4.3). In ad-dition, we quantified changes in hydrological extremes, fo-cusing on both extreme low and high flows (Sect. 4.4). We will also reflect on the robustness of the hydrological signals and show improvements in uncertainty compared to other CMIP3-based studies (Sect. 5.1).
2 The Mekong River basin
Figure 1.The Mekong River basin’s elevation map and locations of mainstream gauging stations.
above 5000 m in the Tibetan Plateau to only a few metres above sea level in the downstream river delta.
The Mekong’s hydrological regime is largely driven by monsoonal activities, most importantly the south-west mon-soon and to a lesser extent the north-east monmon-soon (Costa-Cabral et al., 2008; MRC, 2009; Delgado et al., 2012). The south-west monsoon is dominant from May to Septem-ber, whereas the north-east monsoon is active from Novem-ber to February. These monsoonal activities characterize the basin’s hydrology into two hydrological seasons with distinc-tive flow characteristics. A substantially larger proportion of the annual flow is generated during the wet seasons (June– November). Depending on location, the wet season flow ac-counts for between 75 and 85 % of the total annual flow (cal-culated from MRC, 2005). Seasonal variation in river flow, especially the flood pulse occurring in the downstream delta (i.e. the Tonle Sap Lake in Cambodia and the Vietnamese Mekong delta), supports a highly productive aquatic ecosys-tem and one of the world’s major rice production areas (Lam-berts and Koponen, 2008; Arias et al., 2012).
Hydrological changes, including changes in extreme high and low flows, increase safety risks and undermine eco-nomic productivity in the basin, especially in the low-lying river delta (Eastham et al., 2008; Arias et al., 2014). Ex-treme floods caused by intensive and widespread precipita-tion events result in vast inundaprecipita-tion thereby damaging crops, infrastructure, and, in very extreme cases (e.g. flood events in 2000 and 2011), disrupting how the whole downstream delta functions. The catastrophic flood in 2000 with an
esti-mated total economic loss of over USD 200 million (Cosslett and Cosslett, 2014) illustrates the severe flood damage that can occur in this area. Extreme low flows also affect agri-culture production, which largely depends on surface water irrigation in many parts of the basin. Lack of upstream inflow during the dry season also exacerbates the risk of salt water intrusion, affecting the downstream delta’s ecosystems, do-mestic water supply, and agricultural production (Smajgl et al., 2015).
3 Methodology
3.1 Hydrological model
VMod (Lauri et al., 2006) is a distributed hydrological model using a square grid representation of river basins. This grid uses multiple raster layers containing data for flow direc-tion, river network, soil, and land use. The simulation process starts with interpolating climate input for each grid cell from climate input data. VMod requires minimally four daily cli-mate forcing variables (i.e. maximum, minimum, and aver-age air temperatures, and precipitation). Climate forcing data are calculated for each grid cell using an inverse distance-weighted interpolation. Potential evapotranspiration (PET) is calculated using the Hargraeves–Samani method (Har-graeves and Samani, 1982), where PET is calculated using daily maximum and minimum temperatures, latitude, and calendar day of the year. The soil is simulated as two distinc-tive layers and soil surface processes are simulated following Dingman (1994). After calculating the water balance, runoff is routed from cell to cell and finally into the river network. A detailed description of the VMod model’s algorithms and equations is available in the model’s manual (Lauri et al., 2006).
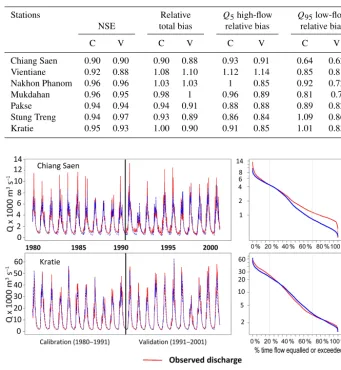
We calibrated and validated the hydrological model against observed daily river discharges at seven gauging sta-tions: Chiang Saen, Vientiane, Nakhon Phanom, Mukdahan, Pakse, Stung Treng, and Kratie (Fig. 1). Observed discharge data were obtained from the Mekong River Commission’s hydrological database (MRC, 2011b). Calibration and vali-dation periods are 1981–1991 and 1991–2001, respectively. The hydrological model’s performance was assessed using discharge plots and model performance indices. In partic-ular, the daily river discharges plots and the flow duration curves (Vogel and Fennessey, 1995) were used to visually check the goodness of fit between observed and simulated data. Furthermore, the Nash–Sutcliffe efficiency (NSE; Nash and Sutcliffe, 1970) and relative biases indices were used to quantify the model’s performance during calibration and val-idation. The model’s over- and underestimation of total an-nual river discharge, high-flow, and low-flow indices (i.e.Q5 andQ95, respectively) were assessed by calculating the rel-ative biases. These Q5 (high flow) andQ95 (low flow) are commonly used indices in hydrological analyses, defined as the values that exceed the discharge time series data by 5 and 95 % of the time, respectively. The biases are calculated as simulated values divided by observed values under the same time period of interest.
We started the model calibration by using the initial pa-rameterization from Lauri et al. (2012). Simulation perfor-mance was further improved by manually adjusting several model’s parameters. In particular, discharge amount and tim-ing at key stations were calibrated to better match with ob-served data by changing the two soil layers’ depth and their water storage capacities. Vertical and horizontal infiltration rates were also adjusted to further improve simulations of high flows and low flows. Lastly, snowmelt rate and temper-ature thresholds for snow precipitation and snowmelt were adjusted to improve model performance at the upper catch-ment above Chiang Saen (northern Thailand). All parameter values were adjusted within the physically realistic range de-scribed in Lauri et al. (2006) and Sarkkula et al. (2010).
3.2 Climate data
We prepared climate data for the historic period (1971–2000) and the future period (2036–2065) using various data sets. Historic temperature was prepared from the WATCH forc-ing data (Weedon et al., 2011), which is a global historic cli-mate data set for the 1958–2001 period, produced from the 40-year ECMWF Re-Analysis (Uppala et al., 2005) and bias-corrected using the CRU-TS2.1 observed data (Mitchell and Jones, 2005). This data set is widely used in various global and regional studies (e.g. van Vliet et al., 2013; Leng et al., 2015; Veldkamp et al., 2015). Precipitation data were ex-tracted from the APHRODITE data set (Yatagai et al., 2012), which is an observation-based precipitation data set, devel-oped from a high-density network of rain gauges over Asia. This data set has been evaluated as one of the best gridded
precipitation data sets for hydrological modelling purposes in the Mekong basin (Lauri et al., 2014). We further dis-cuss potential implications of using the combined WATCH-APHRODITE data in Sect. 5.3.
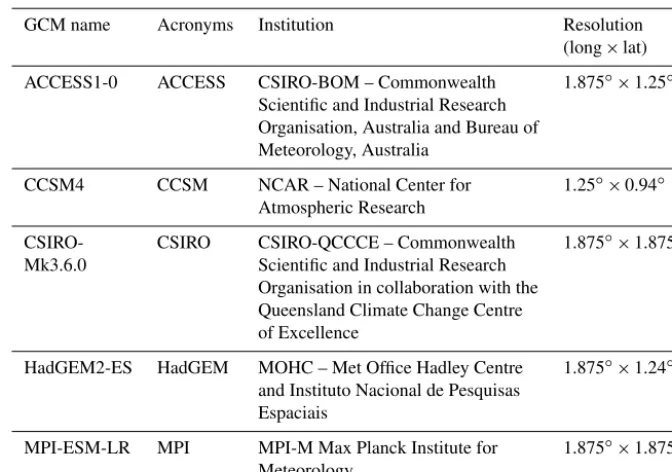
We used the most recent CMIP5 climate projection to de-velop climate change scenarios. The scenarios were devel-oped for the 2036–2065 period, i.e. mid-21st Century, which is a relevant time frame for long-term water resources plan-ning and adaptation (MRC, 2011a). Since the regional cli-mate model data of the Coordinated Regional Clicli-mate Down-scaling Experiment (CORDEX; Giorgi and Gutowski, 2015) so far only covers one GCM for the Mekong region, we de-cided to use GCM projections as basis for this climate im-pact assessment. We therefore downscaled the GCM projec-tions ourselves. Given the relatively large number of GCMs under CMIP5, we first did a model selection by reviewing literature on GCM performance. We selected those GCMs that better reproduce historic tropical temperature and pre-cipitation conditions, implying their suitability to be used in the Mekong region. For historic temperature simulations, Huang et al. (2014) assessed the CMIP5 models efficiency for the Mekong basin and suggested BCC-CSM1-1, CSIRO-MK3-6-0, HadGEM2-ES, and MIROC-ESM-CHEM as the better-performing models. Hasson et al. (2016) evaluated the GCM’s performance in simulating seasonal precipitation fo-cusing on monsoonal activities for three major river basins in South and Southeast Asia, including the Mekong. They concluded that the MPI models, MIROC5 and CSIRO-Mk3-6-0, CCSM4, CESM1-CAM5, GFDL-ESM2G, IPSL-CMA-MR, MIROC-ESM, and MIROC-ESM-CHEM perform bet-ter than other GCMs in the assessment. Furthermore, we also consulted the model evaluation of Sillmann et al. (2013) to represent climate extremes. They indicated that ACCESS-1.0, CCSM4, MPI models, and HadGEM2-ES are amongst the better-performing models. Based on these GCM evalu-ations, we selected five GCMs for this study (Table 1). For each GCM, we extracted climate data for two different RCPs, namely RCP4.5 and RCP8.5. The RCP4.5 is a medium to low scenario assuming a stabilization of radiative forcing to 4.5 W m−2by 2100 (Thomson et al., 2011). The RCP8.5 is a high radiative-forcing scenario assuming a rising radiative forcing leading to 8.5 W m−2 by 2100 (Riahi et al., 2011). By selecting a mid-range and a high-end scenario, we expect to capture a reasonable range in climatic and hydrological projections for the Mekong basin. Given our focus on hydro-logical extremes under climate change, we did not consider RCP2.6, which is the lowest radiative-forcing scenario.
ob-Table 1.Selected CMIP5 GCMs for climatic and hydrological change assessment.
GCM name Acronyms Institution Resolution (long×lat)
ACCESS1-0 ACCESS CSIRO-BOM – Commonwealth 1.875◦×1.25◦ Scientific and Industrial Research
Organisation, Australia and Bureau of Meteorology, Australia
CCSM4 CCSM NCAR – National Center for 1.25◦×0.94◦ Atmospheric Research
CSIRO- CSIRO CSIRO-QCCCE – Commonwealth 1.875◦×1.875◦ Mk3.6.0 Scientific and Industrial Research
Organisation in collaboration with the Queensland Climate Change Centre of Excellence
HadGEM2-ES HadGEM MOHC – Met Office Hadley Centre 1.875◦×1.24◦ and Instituto Nacional de Pesquisas
Espaciais
MPI-ESM-LR MPI MPI-M Max Planck Institute for 1.875◦×1.875◦ Meteorology
served climatology. We used the WATCH forcing data and APHRODITE as independent data sets. The developed trans-fer functions were then applied on the future climate data to correct the biases in the GCM’s future climate projection. Detailed information on the bias-correction method is avail-able in Piani et al. (2010).
3.3 Analysing hydrological changes
We employed several techniques to analyse different as-pects of hydrological changes. First, annual and monthly dis-charge statistics were calculated to understand changes in the river’s flow regime. Second, we calculated the Q5 and Q95 to analyse changes in high-flow and low-flow condi-tions, respectively. Lastly, we fitted discharge data to suitable extreme value distributions to investigate the magnitude and frequency of extreme high flows and low flows. Yearly peak river discharges data were fitted to the generalized extreme value distribution (Stedinger et al., 1993; Dung et al., 2015). Similarly, maximum cumulative discharge deficit, defined as the total deficit under a threshold, were fitted to the gener-alized Pareto distribution (Tallaksen et al., 2004; Hurkmans et al., 2010) to analyse extreme low flows. The threshold to calculate cumulative discharge deficit is defined as Q75 (discharge value exceeded 75 % of the time) under future climate change (Hisdal et al., 2004). Hydrological changes were calculated under individual scenarios and under en-sembles, i.e. average changes from multiple GCMs and both RCPs.
4 Results
[image:5.612.129.465.84.320.2]Table 2.Model performance indices calculated from daily time series for calibration (C) and validation (V) periods. See station locations in Fig. 1.
Stations Relative Q5high-flow Q95low-flow NSE total bias relative bias relative bias
C V C V C V C V
Chiang Saen 0.90 0.90 0.90 0.88 0.93 0.91 0.64 0.62 Vientiane 0.92 0.88 1.08 1.10 1.12 1.14 0.85 0.81 Nakhon Phanom 0.96 0.96 1.03 1.03 1 0.85 0.92 0.72 Mukdahan 0.96 0.95 0.98 1 0.96 0.89 0.81 0.7 Pakse 0.94 0.94 0.94 0.91 0.88 0.88 0.89 0.82 Stung Treng 0.94 0.97 0.93 0.89 0.86 0.84 1.09 0.86 Kratie 0.95 0.93 1.00 0.90 0.91 0.85 1.01 0.83
Figure 2.Daily discharge plots (left panels) and flow duration curves (right panels) during calibration and validation at Chiang Saen (upper panels) and Kratie (lower panels). See station locations in Fig. 1.
4.2 Climate change projection
We analysed future changes in temperature and precipitation projected by the GCMs and RCPs by comparing climate data between the baseline (1971–2000) and future (2036–2065) periods. Since we only assessed hydrological changes down to Kratie (Cambodia), we excluded the downstream area be-low this station (i.e. south of latitude 12.5◦N) when calculat-ing temperature and precipitation changes.
Overall, surface air temperature increases consistently un-der all GCMs and RCPs (Fig. 3). All GCMs project higher temperature increase in the RCP8.5 than in the RCP4.5. In particular, the RCP8.5 ensemble shows an increase of
+2.4◦C, whereas the RCP4.5 ensemble projects +1.9◦C. Temperature increase differs amongst the individual GCMs and RCPs. The lowest basin-average temperature increase of 1.5◦C is projected by the MPI-RCP4.5, whereas the
ACCESS-RCP8.5 projects the highest increase of 3.5◦C. A majority of scenarios project temperature increases between 1.5 and 2.5◦C, including CCSM-RCP8.5, CSIRO-RCP4.5, CSIRO-RCP8.5, HadGEM-RCP4.5, HadGEM-RCP8.5, and MPI-RCP4.5. Notably, the ACCESS GCM shows markedly more temperature increase compared to other models. The spatial patterns of temperature increases are relatively simi-lar between the scenarios: temperature tends to increase more in the upper catchment area in China, large parts of Thailand, and sometimes also in the Vietnamese Mekong delta (Fig. 3). Areas with lower future temperature increases are located mostly in the eastern part of the Mekong’s lower basin in-cluding eastern Cambodia and the central highlands of Viet-nam.
Figure 3.Projected change in daily mean temperature (◦C) under future climate (2036–2065) compared to baseline situation (1971–2000).
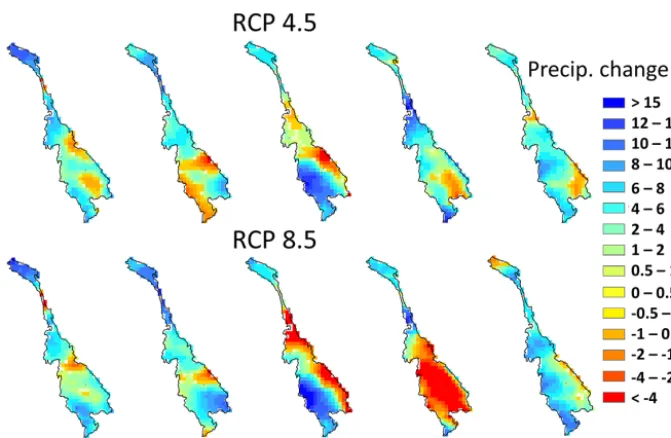
Figure 4.Projected change in total annual precipitation (%) under future climate (2036–2065) compared to the baseline climate (1971–2000).
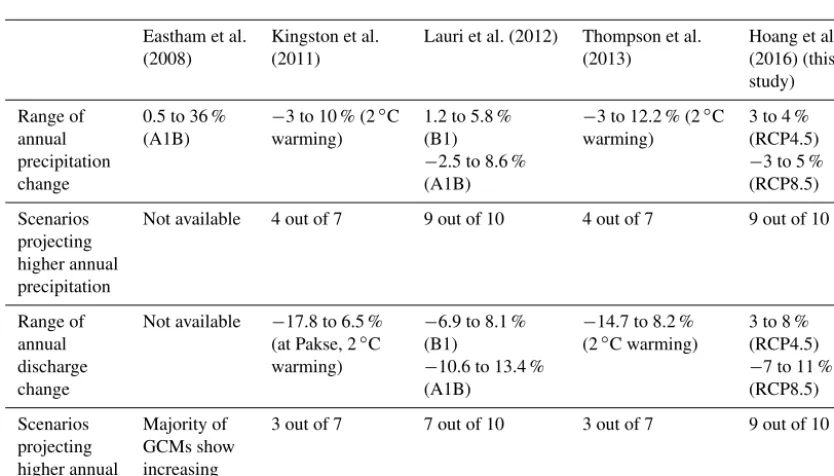
reduction (i.e.−3 %) in annual precipitation. Annual precipi-tation changes between−3 % (HadGEM-RCP8.5) and+5 % (CCSM-RCP8.5), with an ensemble mean of +3 % across all the scenarios. The scenarios also show larger range of basin-wide precipitation changes under the RCP8.5 (i.e. be-tween −3 and +5 %) compared to that under the RCP4.5 (i.e. between+3 and+4 %). Notably, these ranges of precip-itation changes are typically smaller than those derived from earlier CMIP3-based assessments (i.e. Eastham et al., 2008; Kingston et al., 2011; Lauri et al., 2012; Thompson et al., 2013). Details on cross-study comparisons are shown in Ta-ble 4. Reduced uncertainties in precipitation projection will likely improve the robustness of the projected hydrological changes.
[image:7.612.128.464.290.509.2]Table 3.Relative changes in annual river discharges at the Mekong’s mainstream stations for 2036–2065 relative to 1971–2000. The lowest and highest changes are presented with the corresponding climate change scenarios.
Station RCP4.5 RCP8.5
Ensemble Range (%) Ensemble Range (%) mean (%) mean (%)
Chiang Saen +14 +4 to+29 +15 −1 to+33 CSIRO – ACCESS CSIRO – ACCESS
Vientiane +9 +1 to+17 +9 −1 to+20 CSIRO – ACCESS CSIRO – ACCESS
Nakhon Phanom +7 −1 to+12 +6 −2 to+13 CSIRO – ACCESS CSIRO – ACCESS
Mukdahan +6 −1 to+11 +5 −4 to+13 CSIRO – ACCESS HadGEM – ACCESS
Pakse +6 +2 to+10 +5 −6 to+13 CCSM – ACCESS HadGEM – MPI
Stung Treng +5 +3 to+8 +5 −7 to+10 CCSM – ACCESS HadGEM – ACCESS
Kratie +5 +3 to+8 +5 −7 to+11 CCSM – ACCESS HadGEM – MPI
Table 4.Comparing projected precipitation and discharge changes across studies.
Eastham et al. Kingston et al. Lauri et al. (2012) Thompson et al. Hoang et al. (2008) (2011) (2013) (2016) (this
study)
Range of 0.5 to 36 % −3 to 10 % (2◦C 1.2 to 5.8 % −3 to 12.2 % (2◦C 3 to 4 % annual (A1B) warming) (B1) warming) (RCP4.5) precipitation −2.5 to 8.6 % −3 to 5 %
change (A1B) (RCP8.5)
Scenarios Not available 4 out of 7 9 out of 10 4 out of 7 9 out of 10 projecting
higher annual precipitation
Range of Not available −17.8 to 6.5 % −6.9 to 8.1 % −14.7 to 8.2 % 3 to 8 % annual (at Pakse, 2◦C (B1) (2◦C warming) (RCP4.5) discharge warming) −10.6 to 13.4 % −7 to 11 %
change (A1B) (RCP8.5)
Scenarios Majority of 3 out of 7 7 out of 10 3 out of 7 9 out of 10 projecting GCMs show
higher annual increasing discharge trend
4.3 Changes in the flow regime
This section presents changes in annual, seasonal, and monthly river discharges under climate change. Annual changes are presented for all seven mainstream stations (see locations in Fig. 1) while we limit the rest of the results to three representative stations to maintain the paper’s focus.
These stations are Vientiane (Laos PDR), Mukdahan (Thai-land), and Kratie (Cambodia), each representing the upper, middle, and lower parts of the basin, respectively.
[image:8.612.92.509.375.613.2]under climate change. Annual discharges increase between
+5 % (at Kratie and Stung Treng) and +15 % (at Chiang Saen), indicating a more substantial increase in the upstream stations compared to the downstream ones. Despite the gen-eral increasing signal based on ensemble mean, annual dis-charges also reduce slightly under some individual scenar-ios. The reductions range from−1 % (at Chiang Saen, sce-nario CSIR0-RCP4.5) to−7 % (at Stung Treng and Kratie, scenario HadGEM-RCP8.5). While the ensemble means un-der the two RCPs are very similar, the RCP8.5 exhibits a larger range in projected discharge changes (Table 3). This larger range is associated with more differentiated precipi-tation changes under individual GCMs in the RCP8.5 com-pared to those in the RCP4.5 (see Fig. 4).
Figure 5 shows changes in monthly river discharges under climate change. Overall, the scenario ensembles show higher monthly river flow at all considered stations, except for a slight reduction in June. Absolute discharge increases are more substantial in the wet season compared to those in the dry season. In terms of timing, the RCP4.5 shows the largest increases in November, while the RCP8.5 shows the largest increase in August. Although absolute increases are more substantial during the wet season months, relative increases are higher during the dry season. For instance, discharge in April could increase up to +40 % (+360 m3s−1) at Vien-tiane and+25 % (+480 m3s−1) at Kratie. Despite the over-all increasing trends, discharge in June is projected to reduce slightly at all three stations, ranging between −810 m3s−1 (−8 %) at Kratie, followed by−530 m3s−1(−8 %) at Muk-dahan and−210 m3s−1(−5 %) at Vientiane. On the seasonal timescale, discharges increase at all stations during both the wet and dry seasons.
[image:9.612.309.548.61.427.2]Cross-GCM comparisons show that monthly discharge changes during the wet season are more variable compared to the dry season. Figure 5 clearly shows that the ensemble’s projection ranges become markedly larger in the wet season, implying higher uncertainty in the hydrological change sig-nal. For example, projected river discharge in August at Muk-dahan ranges between 15 400 m3s−1 (scenario HadGEM-RCP8.5) and 22 300 m3s−1(scenario MPI-RCP8.5). This is a spread of 6900 m3s−1, equivalent to 36 % of the average discharge in August. Moreover, the individual GCMs also show contrasting directional discharge changes in the wet season months. The CSIRO and HadGEM models project reductions in discharge during June–October, whereas the other models project discharge increases during the same period. These contrasting directional changes mainly result from the disagreement among GCMs on the future precipi-tation regime in the Mekong basin. This disagreement high-lights one of the key uncertainties in projecting future cli-matic change and subsequently hydrological responses in the Mekong basin, as also noted by Kingston et al. (2011).
Figure 5.Projected monthly river discharge under climate change for 2036–2065 relative to 1971–2000.
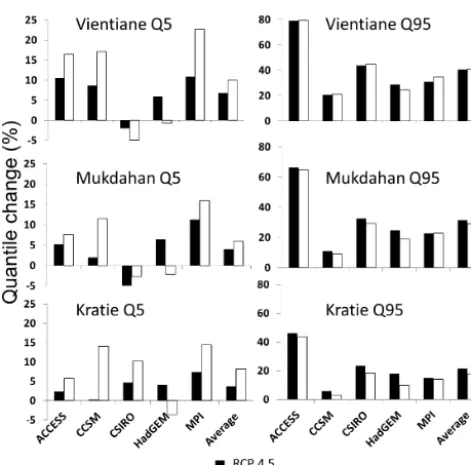
4.4 Changes in hydrological extremes
This section subsequently presents changes in Q5 (high flow),Q95 (low flow), and hydrological extremes. Relative changes in high flows (Q5) and low flows (Q95) at Vien-tiane, Mukdahan, and Kratie are shown in Fig. 6. Overall, high flows are projected to increase at all considered stations. The scenario ensemble means show increases inQ5of+8,
+5, and+6 % at Vientiane, Mukdahan, and Kratie, respec-tively. However, high flows also slightly reduce in two sce-narios. In particular, the CSIRO-RCP8.5 projects high-flow reduction at Vientiane (−6 %) and Mukdahan (−3 %). Simi-larly, the HadGEM-RCP8.5 also suggests reductions of−1,
Figure 6.Projected changes inQ5(high flow) andQ95(low flow) under climate change for 2036–2065 relative to 1971–2000.
The non-exceedance curves of yearly peak discharges (Fig. 7) show substantial increases in extremely high flow at all considered stations. The baseline’s non-exceedance curves are always lower than those from the GCM ensem-ble means, implying increases in both the magnitude and fre-quency of annual peak flows. At Vientiane, for instance, the maximum river discharge occurring once every 10 years is projected to increase from 23 800 to 27 900 m3s−1(RCP4.5) and 28 500 m3s−1 (RCP8.5). Similarly, yearly peak dis-charges at Kratie increase from 61 700 to 65 000 m3s−1 (RCP4.5) and 66 900 m3s−1(RCP8.5).
Lastly, both magnitude and frequency of extremely low flows are projected to reduce due to more water availabil-ity during the dry season. Higher dry season discharge re-sults in reductions in the total discharge deficits, defined as the total deficit under a threshold (Q75 value under cli-mate change). The non-exceedance curves in Fig. 8 shows that these deficits reduce substantially at all three repre-sentative stations. Discharge deficits are lowest at Vien-tiane, ranging between 68,000m3/s (2-year return period) and 100 000 m3s−1 (20-year return period) under the baseline condition. These deficits are projected to reduce by almost 50 %, to 30 000 and 58 000 m3s−1 under the RCP8.5 sce-nario. Similarly, discharge deficits also reduce substantially at Mukdahan and Kratie. Figure 8 also shows that future dis-charge deficits are relatively similar between the RCP4.5 and the RCP8.5.
5 Discussion
We have presented climatic and hydrological changes in the Mekong River basin based on a relatively large ensemble of CMIP5 GCMs and climate change scenarios. Motivated by improvements in CMIP5 GCMs technicalities and perfor-mance, we further analysed changes in extreme hydrological conditions under climate change. As such, our results provide important updates and new insights to the current knowledge base about hydrological response to climate change. Addi-tionally, the results also reveal important implications for wa-ter resources management and climate change adaptation.
5.1 Comparison: impact signal and improvements in uncertainties
Our results further confirm and solidify the Mekong’s hy-drological intensification in response to climate change (Sect. 4.3 and 4.4). In general, hydrological impact signals from the CMIP5 scenarios are in line with findings from most previous CMIP3-based studies. This study projects an increase of+5 % in average annual river discharge at Kratie, compared to +10,+4, and+3 % by Hoanh et al. (2010), Västilä et al. (2010), and Lauri et al. (2012), respectively. Similar to these studies, our results also show increasing monthly and seasonal river discharges. Despite the differ-ences in GCMs choices, climate experiment generations (i.e. CMIP5 versus CMIP3), and downscaling approaches, the increasing trend in annual and seasonal river flow is ro-bust across different studies. Therefore, certain confidence can be placed on the general direction of the Mekong’s hy-drological change under climate change.
Figure 7.Non-exceedance curves of yearly peak discharges under baseline (1971–2000) and future climate (2036–2065).
Figure 8.Non-exceedance curves of yearly maximum cumulative discharge deficits (i.e. total deficit below theQ75threshold) under baseline and future climate.
B1) and a high scenario (i.e. RCP8.5 versus SRES-A1B). Overall, our CMIP5-based projection exhibits lower uncertainty, shown by lower coefficients of variation for both the mid-range scenarios (24 % vs. 38 %) and the high sce-nario (25 % vs. 38 %). Reduced uncertainty detected in our study is also in line with studies by Sperber et al. (2013) and
Hasson et al. (2016), where they found improved representa-tions of the Asian summer monsoon with the CMIP5 models.
5.2 Implications for water management
[image:11.612.127.470.341.580.2]im-portant implications for water management in the river basin. First, higher peak discharges occurring at higher frequencies during the wet season will increase the flood risks across the basin. Higher flood risks will be particularly relevant for hu-man safety and agricultural production in the lower Mekong region, including the Cambodian and Vietnamese delta. Vast agriculture areas along the main rivers and in the delta’s floodplain will likely experience higher flood water levels, thus having higher risks of reduced productivity and crop failure. Higher river flow, combined with sea level rise will also result in higher flood risks for urban areas in the Mekong Delta.
Second, increased water availability during the dry sea-son suggested by theQ95and discharge deficit analyses can have positive implications. The projected higher river dis-charge during the dry season months could help to mitigate water shortage in the basin. Higher dry season flow will also contribute to control salt water intrusion in the Vietnamese Mekong delta, where fresh water flow from upstream is cur-rently used to control the salt gradient in rivers and canals in the coastal area. Additionally, projected discharge reduction at the beginning of the wet season (i.e. in June) probably has negative impacts on ecological and agricultural productivity. Flow alteration in the early wet season will likely change the sediment and nutrient dynamics in the downstream flood-plains, which are very important for existing ecosystems and agricultural practices (Arias et al., 2012). Lastly, rainfall re-duction in some areas of the lower Mekong could damage agricultural production, especially rainfed agriculture.
5.3 Limitations and way forward
We acknowledge several limitations and potential sources of error in this research. First, combining two historic climate data sets (i.e. the WATCH and the APHRODITE) may in-troduce errors due to inconsistencies. However, our data set selection is motivated by careful consideration of data quality and availability. Although APHRODITE provides high qual-ity precipitation data (Vu et al., 2012; Lauri et al., 2014), this data set lacks temperature data needed for the hydrological model. We therefore supplement temperature data from the commonly used WATCH Forcing Data. Furthermore, cali-bration and validation results show that our hydrological sim-ulation based on the combined climate forcing data is able to realistically reproduce historic river discharge. Given rela-tively lower modelling skill at Chiang Saen, interpreting the hydrological impact signal at this station requires extra cau-tion. Combinations of temperature and precipitation data sets were also shown by Lauri et al. (2014) to yield sufficient accuracy in hydrological modelling in the Mekong basin. Second, this paper only uses one bias-correction method (i.e. Piani et al., 2010) for climate data preparation. This could affect the derived hydrological impact signal (Hage-mann et al., 2011) but is unlikely to change the main signal of hydrological change. Additionally, including other
bias-correction methods is outside this paper’s scope given our primary interest to understand how the Mekong’s hydrol-ogy will change under climate change. Third, due to limited data availability, we could not include climate change pro-jections from regional climate models (e.g. CORDEX) in our study. Such inclusion of such high-resolution climate projec-tions could be useful, not only for this study, but also for the current knowledge base about the Mekong’s hydrology under climate change. The scope of this study is to under-stand how climate change will affect Mekong’s hydrology including extremes. Hydrological changes, however, are si-multaneously driven by multiple factors including irrigated land expansion, urbanization, hydropower dams, and inter-basin water transfer. For example, several studies, including Lauri et al. (2012), Piman et al. (2013), and MRC (2011a), have shown that irrigation expansion, hydropower dam con-struction, and water transfer projects can largely alter flow regime. Such anthropogenic factors should be subjected to future studies in order to yield more comprehensive insights about the Mekong’s future hydrology and water resources. Of special importance in this regard is the need to assess the interactions between different drivers and the resulted hydro-logical changes.
6 Conclusions
This study is one of the first hydrological impact assessments for the Mekong River basin focusing on hydrological ex-tremes under climate change. We aim to cover this particu-larly important knowledge gap, and thereby better supporting policy and decision making in Southeast Asia’s largest river basin.
Climate change scenarios show that temperature consis-tently increases across the basin, with higher rises in the upper basin in China, large parts of Thailand and the Viet-namese Mekong delta. Baswide precipitation also in-creases under a majority of scenarios (9 out of 10), but certain areas also exhibit reducing signal. As a result, the Mekong’s hydrology will intensify, characterized by increases in an-nual river discharge at all stations. The scenario ensemble means also show increases in seasonal discharges, for both wet and dry seasons. Discharge increases are more substan-tial during the wet season, but the ensemble ranges are more variable compared to the dry season. Considerably different and sometimes contrasting directional discharge changes ex-ist in our scenarios ensemble. This uncertainty, although re-duced markedly compared to earlier CMIP3-based assess-ments, highlights a challenge in quantifying future hydro-logical change. It emphasizes the importance of, first, us-ing ensemble approach in hydrological assessments, and sec-ond developing robust, adaptive approaches to water man-agement under climate change.
Water availability during dry season increases under all cli-mate change scenarios, suggesting positive impacts on water supply and salinization control in the downstream delta. Wet season discharges and annual peak flows will increase sub-stantially, implying important consequences for risk manage-ment, especially in securing safety of water infrastructures, and in controlling flood risks in the Mekong Delta. Given ro-bust evidences of changes in hydrological extremes, shifting research and management focuses to these low-probability but potentially highly damaging events is important to reduce climate change impacts and associated risks.
The Supplement related to this article is available online at doi:10.5194/hess-20-3027-2016-supplement.
Acknowledgements. We would like to thank our colleagues at the Water Systems and Global Change Group, especially Wi-etse Franssen, and Chu Thai Hoanh (at IWMI) for their useful supports and suggestions. Long Phi Hoang received funding from the Dutch-Vietnamese Mekong Delta Plan project. Matti Kummu received funding from Academy of Finland project SCART (grant no. 267463) and Emil Aaltonen foundation (“eat-less-water” project). Michelle van Vliet was financially supported by a Veni-grant (project 863.14.008) of NWO Earth and Life Sciences (ALW). Lastly, we thank the editor and three anonymous reviewers for providing their useful and constructive comments on this paper.
Edited by: F. Tian
Reviewed by: three anonymous referees
References
Adamson, P. T.: Hydrological perspectives on the Lower Mekong Basin: The potential impacts of hydropower developments in Yunnan on the downstream flow regime, Int. Water Power Dam Constr., 16–21, 2001.
Adamson, P. T., Rutherfurd, I. D., Peel, M. C., and Conlan, I. A.: Chapter 4 – The Hydrology of the Mekong River, in: The Mekong, Academic Press, San Diego, 53–76, doi:10.1016/B978-0-12-374026-7.00004-8, 2009.
Arias, M. E., Cochrane, T. A., Piman, T., Kummu, M., Caruso, B. S., and Killeen, T. J.: Quantifying changes in flooding and habi-tats in the Tonle Sap Lake (Cambodia) caused by water infras-tructure development and climate change in the Mekong Basin, J. Environ. Manage., 112, 53–66, 2012.
Arias, M. E., Cochrane, T. A., Kummu, M., Lauri, H., Holtgrieve, G. W., Koponen, J., and Piman, T.: Impacts of hydropower and climate change on drivers of ecological productivity of South-east Asia’s most important wetland, Ecol. Model., 272, 252–263, doi:10.1016/j.ecolmodel.2013.10.015, 2014.
Cosslett, T. and Cosslett, P.: Major Threats to Mekong Delta: Cli-mate Change and Mainstream Dams, in: Water Resources and Food Security in the Vietnam Mekong Delta, vol. 44, Natural Re-source Management and Policy, Springer International
Publish-ing, Cham, Heidelberg, New York, Dordrecht, London, 75–96, doi:10.1007/978-3-319-02198-0_3, 2014.
Costa-Cabral, M. C., Richey, J. E., Goteti, G., Lettenmaier, D. P., Feldkötter, C., and Snidvongs, A.: Landscape structure and use, climate, and water movement in the Mekong River basin, Hydrol. Process., 22, 1731–1746, doi:10.1002/hyp.6740, 2008.
Dai, A. and Trenberth, K. E.: Estimates of Freshwater Dis-charge from Continents: Latitudinal and Seasonal Vari-ations, J. Hydrometeorol., 3, 660–687, doi:10.1175/1525-7541(2002)003<0660:eofdfc>2.0.co;2, 2002.
Delgado, J. M., Merz, B., and Apel, H.: A climate-flood link for the lower Mekong River, Hydrol. Earth Syst. Sci., 16, 1533–1541, doi:10.5194/hess-16-1533-2012, 2012.
Dingman, S. L.: Water in soils: infiltration and redistribution, in: Physical hydrology, Vol. 575, Englewood Cliffs, Prentice Hall, NJ, 1994.
Dung, N. V., Merz, B., Bárdossy, A., and Apel, H.: Handling uncer-tainty in bivariate quantile estimation – an application to flood hazard analysis in the Mekong Delta, J. Hydrol., 527, 704–717, 2015.
Eastham, J., Mpelasoka, F., Mainuddin, M., Ticehurst, C., Dyce, P., Hodgson, G., Ali, R., and Kirby, M.: Mekong River Basin wa-ter resources assessment: Impacts of climate change, Wawa-ter for a Healthy Country National Research Flagship report, CSIRO, 2008.
FAO: WRB map of world soil resources, Food and Agriculture Or-ganization of United Nations (FAO), Land and Water Develop-ment Division, Rome, 2003.
Giorgi, F. and Gutowski Jr., W. J.: Regional Dynamical Down-scaling and the CORDEX Initiative, Annu. Rev. Environ. Resour., 40, 467–490, doi:10.1146/annurev-environ-102014-021217, 2015.
GLC2000: Global Land Cover 2000 database, European Com-mission, Joint Research Centre, http://forobs.jrc.ec.europa.eu/ products/glc2000/glc2000.php (last access: July 2016), 2003. Hagemann, S., Chen, C., Haerter, J. O., Heinke, J., Gerten, D.,
and Piani, C.: Impact of a Statistical Bias Correction on the Projected Hydrological Changes Obtained from Three GCMs and Two Hydrology Models, J. Hydrometeorol., 12, 556–578, doi:10.1175/2011JHM1336.1, 2011.
Hargraeves, G. H. and Samani, Z. A.: Estimating potential evapo-transpiration, J. Irrig. Drain. Divis.-ASCE, 108, 225–230, 1982. Hasson, S., Pascale, S., Lucarini, V., and Böhner, J.: Seasonal
cy-cle of precipitation over major river basins in South and South-east Asia: A review of the CMIP5 climate models data for present climate and future climate projections, Atmos. Res., doi:10.1016/j.atmosres.2016.05.008, in press, 2016.
Hisdal, H., Tallaksen, L. M., Clausen, B., Peters, E., and Gus-tard, A.: Hydrological drought characteristics in: Hydrological Drought: Processes and Estimation Methods for Streamflow and Groundwater, Elsevier, Amsterdam, Boston, Heidelberg, Lon-don, New York, Oxford, Paris, San Diego, San Francisco, Sin-gapore, Sydney, Tokyo, 139–198, 2004.
Hoanh, C. T., Jirayoot, K., Lacombe, G., and Srinetr, V.: Impacts of climate change and development on Mekong flow regime, First assessment – 2009, MRC Technical Paper No. 29, Mekong River Commission, Vientiane, Lao PDR, 2010.
Basin, Part I: temperature, Environ. Monit. Assess., 186, 7513– 7523, doi:10.1007/s10661-014-3944-x, 2014.
Hurkmans, R., Terink, W., Uijlenhoet, R., Torfs, P., Jacob, D., and Troch, P. A.: Changes in streamflow dynamics in the Rhine basin under three high-resolution regional climate scenarios, J. Cli-mate, 23, 679–699, 2010.
Jacobs, J. W.: The Mekong River Commission: transboundary water resources planning and regional security, Geograph. J., 168, 354– 364, doi:10.1111/j.0016-7398.2002.00061.x, 2002.
Jarvis, A., Reuter, H., Nelson, A., and Guevara, E.: Hole-filled SRTM for the globe Version 4, CGIAR-CSI SRTM 90 m Database, CGIAR, 2008.
Keskinen, M., Chinvanno, S., Kummu, M., Nuorteva, P., Snid-vongs, A., Varis, O., and Västilä, K.: Climate change and wa-ter resources in the Lower Mekong River Basin: putting adap-tation into the context, J. Water Clim. Change, 1, 103–117, doi:10.2166/wcc.2010.009, 2010.
Kingston, D. G., Thompson, J. R., and Kite, G.: Uncer-tainty in climate change projections of discharge for the Mekong River Basin, Hydrol. Earth Syst. Sci., 15, 1459–1471, doi:10.5194/hess-15-1459-2011, 2011.
Knutti, R. and Sedláˇcek, J.: Robustness and uncertainties in the new CMIP5 climate model projections, Nat. Clim. Change, 3, 369– 373, 2013.
Lamberts, D. and Koponen, J.: Flood pulse alterations and produc-tivity of the Tonle Sap ecosystem: a model for impact assess-ment, Ambio, 37, 178–184, 2008.
Lauri, H., Veijalainen, N., Kummu, M, Koponen, J., Virtanen, M., Inkala, A., and Sark, J.: VMod Hydrological Model Manual, Finnish Environment Institute, EIA Ltd., Helsinki University of Technology, Helsinki, 2006.
Lauri, H., de Moel, H., Ward, P. J., Räsänen, T. A., Keskinen, M., and Kummu, M.: Future changes in Mekong River hydrology: impact of climate change and reservoir operation on discharge, Hydrol. Earth Syst. Sci., 16, 4603–4619, doi:10.5194/hess-16-4603-2012, 2012.
Lauri, H., Räsänen, T. A., and Kummu, M.: Using Reanalysis and Remotely Sensed Temperature and Precipitation Data for Hy-drological Modeling in Monsoon Climate: Mekong River Case Study, J. Hydrometeorol., 15, 1532–1545, doi:10.1175/jhm-d-13-084.1, 2014.
Lebel, L., Garden, P., and Imamura, M.: The Politics of Scale, Po-sition, and Place in the Governance of Water Resources in the Mekong Region, Ecol. Soc., 10, 2, 2005.
Leng, G., Tang, Q., and Rayburg, S.: Climate change im-pacts on meteorological, agricultural and hydrological droughts in China, Global Planet. Change, 126, 23–34, doi:10.1016/j.gloplacha.2015.01.003, 2015.
Mitchell, T. D. and Jones, P. D.: An improved method of con-structing a database of monthly climate observations and as-sociated high-resolution grids, Int. J. Climatol., 25, 693–712, doi:10.1002/joc.1181, 2005.
MRC: Overview of the Hydrology of the Mekong Basin, Tech. rep., Mekong River Commission, Vientiane, Laos PDR, 2005. MRC: The flow of the Mekong, Mekong River Commission,
Vien-tiane, Laos PDR, 2009.
MRC: State of the Basin Report 2010, Mekong River Commission, Vientiane, Lao PDR, 2010.
MRC: Assessment of Basin-wide Development Scenarios: Main Report – Basin Development Plan Programme, Mekong River Commission, Vientiane, Lao PDR, 2011a.
MRC: Hydrometeorological database of the Mekong River Com-mission, Mekong River ComCom-mission, Vientiane, Lao PDR, 2011b.
Nakicenovic, N., Alcamo, J., Davis, G., De Vries, H. J. M., Fen-hann, J., Gaffin, S., Gregory, K., Grubler, A., Jung, T. Y., Kram, T., La Rovere, E. L., Michaelis, L., Mori, S., Morita, T., Papper, W., Pitcher, H., Price, L., Riahi, K., Roehrl, A., Rogner, H.-H., Sankovski, A., Schlesinger, M., Shukla, P., Smith, S., Swart, R., Van Rooijen, S., Victor, N., and Dadi, Z.: Emissions Scenarios, in: A Special Report of Working Group III of the Intergovern-mental Panel on Climate Change, Cambridge University Press, Cambridge, 2000.
Nash, J. and Sutcliffe, J. V.: River flow forecasting through concep-tual models part I – A discussion of principles, J. Hydrol., 10, 282–290, 1970.
Piani, C., Weedon, G. P., Best, M., Gomes, S. M., Viterbo, P., Hagemann, S. and Haerter, J. O.: Statistical bias correction of global simulated daily precipitation and temperature for the application of hydrological models, J. Hydrol., 395, 199–215, doi:10.1016/j.jhydrol.2010.10.024, 2010.
Piman, T., Lennaerts, T., and Southalack, P.: Assessment of hy-drological changes in the lower Mekong Basin from Basin-Wide development scenarios, Hydrol. Process., 27, 2115–2125, doi:10.1002/Hyp.9764, 2013.
Räsänen, T. A., Koponen, J., Lauri, H., and Kummu, M.: Down-stream hydrological impacts of hydropower development in the Upper Mekong Basin, Water Resour. Manage., 26, 3495–3513, 2012.
Renaud, F. G., Kuenzer, C., Delgado, J., Merz, B., and Apel, H.: Monsoon Variability and the Mekong Flood Regime, in: The Mekong Delta System, Springer Environmental Science and En-gineering, Springer Netherlands, 233–244, doi:10.1007/978-94-007-3962-8_9, 2012.
Riahi, K., Rao, S., Krey, V., Cho, C., Chirkov, V., Fischer, G., Kin-dermann, G., Nakicenovic, N., and Rafaj, P.: RCP 8.5 – A sce-nario of comparatively high greenhouse gas emissions, Climatic Change, 109, 33–57, doi:10.1007/s10584-011-0149-y, 2011. Sarkkula, J., Koponen, J., Lauri, H., and Virtanen, M.: IWRM
mod-elling report, Detailed Modmod-elling Support (DMS), Information and Knowledge Management Programme, Mekong River Com-mission, Vientiane, Laos PDR, 2010.
Sillmann, J., Kharin, V. V., Zhang, X., Zwiers, F. W., and Bronaugh, D.: Climate extremes indices in the CMIP5 multimodel ensem-ble: Part 1: Model evaluation in the present climate, J. Geophys. Res.-Atmos., 118, 1716–1733, doi:10.1002/jgrd.50203, 2013. Smajgl, A., Toan, T. Q., Nhan, D. K., Ward, J., Trung, N. H., Tri, L.
Q., Tri, V. P. D., and Vu, P. T.: Responding to rising sea levels in the Mekong Delta, Nat. Clim. Change, 5, 167–174, 2015. Sperber, K. R., Annamalai, H., Kang, I. S., Kitoh, A., Moise, A.,
Turner, A., Wang, B., and Zhou, T.: The Asian summer monsoon: an intercomparison of CMIP5 vs. CMIP3 simulations of the late 20th century, Clim. Dynam., 41, 2711–2744, 2013.
Stocker, T. F., Qin, D., Plattner, G.-K., Tignor, M., Allen, S. K., Boschung, J., Nauels, A., Xia, Y., Bex, V., and Midgley, P. M. (Eds.): Climate Change 2013: The Physical Science Basis, in: Contribution of Working Group I to the Fifth Assessment Re-port of the Intergovernmental Panel on Climate Change, Cam-bridge University Press, CamCam-bridge, UK and New York, NY, USA, 2013.
Tallaksen, L. M. and van Lanen, H. A. J. (Eds.): Hydrological Drought: Processes and Estimation Methods for Streamflow and Groundwater, in: Developments in Water Science, Vol. 48, El-sevier, Amsterdam, Boston, Heidelberg, London, New York, Ox-ford, Paris, San Diego, San Francisco, Singapore, Sydney, Tokyo, 579 pp., 2004.
Taylor, K. E., Stouffer, R. J., and Meehl, G. A.: An Overview of CMIP5 and the Experiment Design, B. Am. Meteorol. Soc., 93, 485-498, doi:10.1175/bams-d-11-00094.1, 2011.
Thompson, J. R., Green, A. J., Kingston, D. G., and Gosling, S. N: Assessment of uncertainty in river flow projections for the Mekong River using multiple GCMs and hydrological models, J. Hydrol., 486, 1–30, 2013.
Thomson, A., Calvin, K., Smith, S., Kyle, G. P., Volke, A., Patel, P., Delgado-Arias, S., Bond-Lamberty, B., Wise, M., Clarke, L., and Edmonds, J.: RCP4.5: a pathway for stabiliza-tion of radiative forcing by 2100, Climatic Change, 109, 77–94, doi:10.1007/s10584-011-0151-4, 2011.
Uppala, S. M., Kållberg, P. W., Simmons, A. J., Andrae, U., Bech-told, V. D. C., Fiorino, M., Gibson, J. K., Haseler, J., Hernandez, A., Kelly, G. A., Li, X., Onogi, K., Saarinen, S., Sokka, N., Allan, R. P., Andersson, E., Arpe, K., Balmaseda, M. A., Beljaars, A. C. M., Berg, L. V. D., Bidlot, J., Bormann, N., Caires, S., Chevallier, F., Dethof, A., Dragosavac, M., Fisher, M., Fuentes, M., Hage-mann, S., Hólm, E., Hoskins, B. J., Isaksen, L., Janssen, P. A. E. M., Jenne, R., McNally, A. P., Mahfouf, J. F., Morcrette, J. J., Rayner, N. A., Saunders, R. W., Simon, P., Sterl, A., Trenberth, K. E., Untch, A., Vasiljevic, D., Viterbo, P., and Woollen, J.: The ERA-40 re-analysis, Q. J. Roy. Meteorol. Soc., 131, 2961–3012, doi:10.1256/qj.04.176, 2005.
van Vliet, M. T. H., Franssen, W. H. P., Yearsley, J. R., Ludwig, F., Haddeland, I., Lettenmaier, D. P., and Ka-bat, P. : Global river discharge and water temperature un-der climate change, Global Environ. Change, 23, 450–464, doi:10.1016/j.gloenvcha.2012.11.002, 2013.
Van Vuuren, D. P., Edmonds, J., Kainuma, M., Riahi, K., Thomson, A., Hibbard, K., Hurtt, G. C., Kram, T., Krey, V., and Lamarque, J.-F. : The representative concentration pathways: an overview, Climatic Change, 109, 5–31, 2011.
Varis, O., Kummu, M., and Salmivaara, A.: Ten major rivers in mon-soon Asia-Pacific: An assessment of vulnerability, Appl. Geogr., 32, 441–454, doi:10.1016/j.apgeog.2011.05.003, 2012. Västilä, K., Kummu, M., Sangmanee, C. and Chinvanno, S.:
Mod-elling climate change impacts on the flood pulse in the Lower Mekong floodplains, Water Clim. Change, 1, 67–86, 2010. Veldkamp, T. I. E., Wada, Y., de Moel, H., Kummu, M., Eisner, S.,
Aerts, J. C. J. H., and Ward, P. J.: Changing mechanism of global water scarcity events: Impacts of socioeconomic changes and inter-annual hydro-climatic variability, Global Environ. Change, 32, 18–29, doi:10.1016/j.gloenvcha.2015.02.011, 2015. Vogel, R. M. and Fennessey, N. M.: Flow duration curves. II. A
review of applications in water resource planning, Water Resour. Bull., 31, 1029–1039, 1995.
Vu, M. T., Raghavan, S. V., and Liong, S. Y.: SWAT use of gridded observations for simulating runoff – a Vietnam river basin study, Hydrol. Earth Syst. Sci., 16, 2801–2811, doi:10.5194/hess-16-2801-2012, 2012.
Wang, W., Lu, H., Yang, D., Sothea, K., Jiao, Y., Gao, B., Peng, X., and Pang, Z.: Modelling Hydrologic Processes in the Mekong River Basin Using a Distributed Model Driven by Satel-lite Precipitation and Rain Gauge Observations, PloS One, 11, e0152229, doi:10.1371/journal.pone.0152229, 2016.
Weedon, G. P., Gomes, S., Viterbo, P., Shuttleworth, W. J., Blyth, E., Österle, H., Adam, J. C., Bellouin, N., Boucher, O., and Best, M.: Creation of the WATCH Forcing Data and Its Use to As-sess Global and Regional Reference Crop Evaporation over Land during the Twentieth Century, J. Hydrometeorol., 12, 823–848, doi:10.1175/2011jhm1369.1, 2011.