www.hydrol-earth-syst-sci.net/20/3493/2016/ doi:10.5194/hess-20-3493-2016
© Author(s) 2016. CC Attribution 3.0 License.
Using object-based geomorphometry for hydro-geomorphological
analysis in a Mediterranean research catchment
Domenico Guida1, Albina Cuomo1, and Vincenzo Palmieri2
1Department of Civil Engineering, University of Salerno, Fisciano, 84084, Italy 2ARCADIS, Agency for Soil Defense of the Campania Region, Naples, Italy
Correspondence to:Albina Cuomo ([email protected])
Received: 11 February 2016 – Published in Hydrol. Earth Syst. Sci. Discuss.: 9 March 2016 Revised: 28 July 2016 – Accepted: 1 August 2016 – Published: 31 August 2016
Abstract. The aim of the paper is to apply an object-based geomorphometric procedure to define the runoff contribu-tion areas and support a hydro-geomorphological analysis of a 3 km2Mediterranean research catchment (southern Italy). Daily and sub-hourly discharge and electrical conductivity data were collected and recorded during a 3-year monitor-ing activity. Hydro-chemograph analyses carried out on these data revealed a strong seasonal hydrological response in the catchment that differed from the stormflow events that oc-cur in the wet periods and in dry periods. This analysis en-abled us to define the hydro-chemograph signatures related to increasing flood magnitude, which progressively involves various runoff components (baseflow, subsurface flow and surficial flow) and an increasing contributing area to dis-charge. Field surveys and water table/discharge measure-ments carried out during a selected storm event enabled us to identify and map specific runoff source areas with homoge-neous geomorphological units previously defined as hydro-geomorphotypes (spring points, diffuse seepage along the main channel, seepage along the riparian corridors, diffuse outflow from hillslope taluses and concentrate sapping from colluvial hollows). Following the procedures previously pro-posed and used by authors for object-based geomorphologi-cal mapping, a hydro-geomorphologigeomorphologi-cally oriented segmen-tation and classification was performed with the eCogni-tion (Trimble, Inc.) package. The best agreement with the expert-based geomorphological mapping was obtained with weighted plan curvature at different-sized windows. By com-bining the chemical analysis and object-based hydro-geomorphotype map, the variability of the contribution ar-eas was graphically modeled for the selected event, which occurred during the wet season, by using the log values of
flow accumulation that better fit the contribution areas. The results allow us to identify the runoff component on hydro-chemographs for each time step and calculate a specific dis-charge contribution from each hydro-geomorphotype. This kind of approach could be useful when applied to similar, rainfall-dominated, forested and no-karst catchments in the Mediterranean eco-region.
1 Introduction
dle et al. (2000) in order to discriminate the VSA hydrologic sources and pathways, which refers to the connected hydro-geomorphic components of the catchments (hollow, hillslope and riparian corridor). Within a more general program for flood hazard assessment procedures, the hydro-geomorphic paradigm was used to generalize at basin and regional scale in southern Italy by Cuomo (2012), by means of hydro-geomorphology (Okunishi, 1991, 1994; Babar, 2005; Sidle and Onda, 2004; Goerl et al., 2012). Cuomo (2012) intro-duced and applied a new hydro-geomorphological basic unit, thehydro-geomorphotype, by using the Salerno Geomorpho-logical Mapping System (Dramis et al., 2011; Guida et al., 2012, 2015) as a framework for object-based geomorpho-logical mapping. Based on the up-to-date and shared the-oretical geomorphometric background (Baatz and Schäpe, 2000; Dragut and Blaschke, 2006; van Asselen and Seij-monsbergen, 2006; Anders et al., 2011; Dragut et al., 2013, 2014; Eisank et al., 2014), this proposal is currently un-der experimental calibration as an effective, object-based ge-omorphometric procedure for spatial individuation, objec-tive delimitation and automatic recognition of the hydro-geomorphotypes from the perspective of an object-based dis-tributed hydrological modeling (Cuomo et al., 2012).
Linking geomorphometry with hydrology towards hydro-geomorphology gives consistency to the suggestion made by Peckham (2009) with the aim of simplifying the issue of the computational cost and time of a fully distributed model.
In the past, many authors made extensive use of chemical and isotopic tracers in order to separate the runoff compo-nents recorded in the hydrographs and pinpoint distinctive sources and pathways by using the geochemical and isotopic signature of water at parcel scale or for small catchments (Klaus and McDonnell, 2013). However, applying only the hydro-chemograph and isotopic separation methods to an ex-perimental parcel cannot provide sufficient information on the spatial distribution of runoff sources and paths for basins as a whole, due to their spatial heterogeneity structure and time process variability.
Moreover, extensive use of the above-mentioned methods is more expensive and time-consuming than the quantity and quality of the data collected and the knowledge gained. As
ated (Cuomo and Guida, 2013; Guida and Cuomo, 2014). Starting from these premises, the paper describes the study area as a Mediterranean research catchment and presents the hydro-chemical data set recorded during the monitoring ac-tivity carried out in the 2013–2014 calibration period. In the next section an original procedure is described for de-termining the timing, type and hydro-chemical signature of the runoff components involved during storm events. With the aim of spatially defining these runoff sources, an object-based geomorphological map was then set by hydro-logically oriented segmentation and classification. Finally, the results of combined hydro-chemical and object-based hydro-geomorphometric analysis are discussed in order to determine the variability of the contributing area during a significant storm event (see the storm event hydro-chemical data set in the Supplement data).
2 Hydro-geomorphology and monitoring activity of the study area
The study area is a forested and hilly catchment located in the Bussento River drainage basin, the 3 km2 Ciciriello catchment in the Cilento and Vallo di Diano National Park– UNESCO Global Geopark, southern Italy (Fig. 1).
Figure 1.Hydrogeological map of the Ciciriello Experimental Catchment and location of the monitoring stations (modified from Cuomo and Guida, 2016). Legend: bedrock lithology: Ma, marly clay and argillite Tertiary formation, and base aquiclude; Ss, sandstone Miocene formation, and fractured general aquifer; Mf, marl, interlayered and perched aquifer.
westward groundwater flow, convergent toward the lower apex of the wedge-like hydro-structures (“hydro-wedge” in Cascini at al., 2008 and Cuomo and Guida, 2016), where the main permanent springs are located. In the headwaters, col-luvial hollows are situated at the bottom of the zero-order basins, and are considered to be the main headwater hydro-geomorphotypes by Cuomo (2012), where dominant satu-ration excess runoff occurs mainly during the wet season. The streamflow of both permanent springs from the bedrock aquifers and seasonal springs from colluvial headwater in-crease down valley.
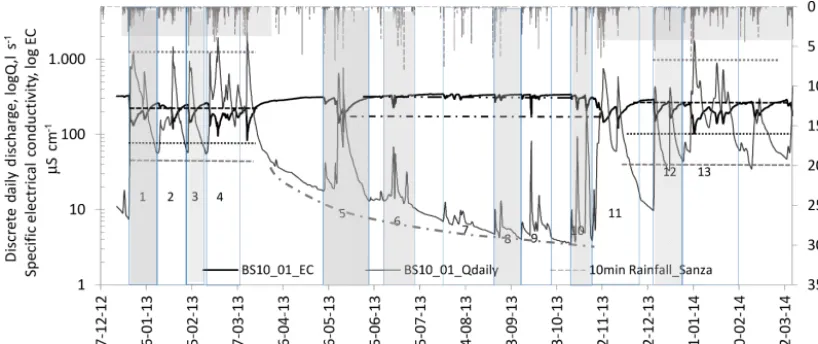
From December 2012, water depth (D), discharge (Q) and specific electrical conductivity (we used either sEC or EC in the following) were measured daily at the main station, hourly during the floods and weekly at the sub-stations dur-ing the inter-storm periods (Fig. 1). The Qmeasurements were obtained with the Swoffer 3000 current meter
(Swof-fer Inc., USA), and the EC parameter was measured with multi-parametric probe HI9828 (Hanna Instruments Inc., Ro-mania). The monitoring year 2013–2014 (Fig. 2) provided a complete hydro-chemical data set, which enabled us to carry out the analysis at seasonal and event timescales (Cuomo and Guida, 2014).
3 Hydro-geomorphological procedure for the contributing areas’ individuation
Figure 2.Plot of the hydro-chemograph data set recorded at the main monitoring station (BS16_01) and the 10 min rainfall plot at the Sanza rain gauge (from Cuomo and Guida, 2016). Legend: numbers indicate the selected events; horizontal lines are representative of the reference parameter ranges; black dashed-double dot lines indicate EC maxima in the dry period; the black dashed-dot line represents EC minimum during the dry period; the black dashed line indicates EC maxima in the wet period; the black dotted line represents an EC minimum in the wet period; the gray dashed line indicates theQminima in the wet period; the gray dotted line indicates the averageQmaximum in the wet period; finally, the gray dashed-dot curve indicates the theoretical annual baseflow curve of the catchment during the period under consideration.
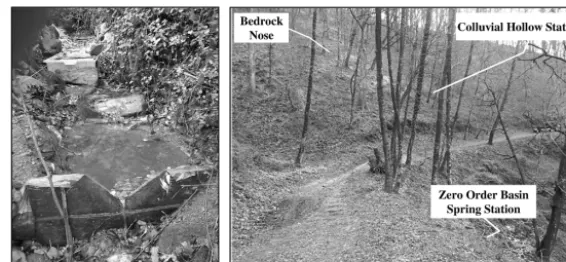
[image:4.612.78.517.338.661.2]Figure 4. (a)The V-notch weir at the BS16_01_01dx and(b)stations.
In the following sections, an integrated procedure is pro-posed that uses simple geomorphometric tools to take into account various hydrological and geomorphological factors that cause time–space runoff variability in the catchment case study.
The flowchart in Fig. 3 shows the three integrated ap-proaches used in the application.
The first approach on the left-hand side highlights the expert-based activities by geomorphological surveys and di-rect monitoring carried out at basin scale before and during the application event and the derivation of traditional, hand-drawn, expert-based geomorphological maps. The field-oriented flow accumulation scenarios were obtained from data collected at the control points (Fig. 1) for each event time step (five time steps) and each hydro-geomorphotype and by using the flow accumulation map derived from the second step described below. The expert-based activities are illustrated in Sect. 3.1. The second approach (see the flowchart in the center) shows the geomorphometric routine activities carried out during the application, as illustrated in Sect. 3.2. Starting from the topographic data source, a hydro-logically corrected DEM was obtained and the log of the flow accumulation map was derived, which was reclassified in the first approach in order to obtain the best agreement with the field evidence highlighted during the storm event at each hydro-geomorphotype. The field-oriented flow accumulation maps were obtained as a proxy for the contributing area sce-narios. As better explained in Sect. 3.2, after five elabora-tion steps, the geomorphometric analysis provided us with the object-based hydro-geomorphological map of the catch-ment, quantitatively defining the spatial extension of the ba-sic hydro-geomorphotypes. The hydro-geomorphotype map was calibrated with the hydro-chemical analysis illustrated in Sect. 3.3 and was then overlaid with the five contributing area scenarios, thus obtaining the final hydro-geomorphological scenarios maps.
3.1 Direct survey on the catchment during a storm event
Before and during the storm event in the period from 29 to 31 January 2015, one of the authors and field collaborators car-ried out direct field surveys by measuring EC and, wherever possible, theQparameters on the control points in Fig. 1, and repeated them at each time step of the storm event. The pre-event conditions were detected at 17:15 on 29 January 2015 by carrying out systematic surveys and taking mea-surements from the main stream and secondary channel sta-tions (Fig. 4a), where only groundwater feeds the discharge along the riparian corridors. After the beginning of rainfall, measurements were taken from 07:20 to 09:10 on 30 Jan-uary 2015 at the zero-order basin springs and hollow stations (Fig. 4b), where the soil became increasingly saturated and contemporarily new water was added from the riparian cor-ridor downstream.
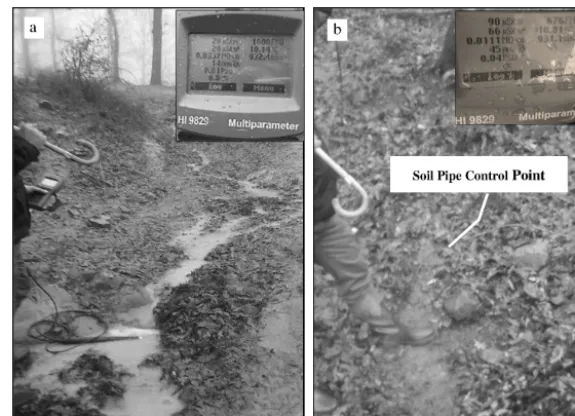
[image:5.612.156.439.66.197.2]col-Figure 5.Measurements at 12:00 in the dirt road point controls(a)and the soil pipe(b)with respective EC values.
Figure 6. (a)Hydro-chemograph plot of the 29–31 January 2015 storm event and related hydro-geomorphological phases, during which the runoff components are progressively added, according to Table 3;(b)Q-EC hysteretic cycle of the storm event.
luvial hollows, reaching approximatelyQ=1000 L s−1and sEC=100–120 µS−1. In addition to these values, firstly the macropore contribution is added. Finally excess infiltration runoff from the saturated areas becomes dominant, which progressively increases the discharge, reaching asymptotical sEC=80 µS−1values.
In order to obtain the contributing area scenarios, the flow accumulation map by means of the SAGA module imple-mented in QGIS was generated. More precisely, the log val-ues of the flow accumulation map were reclassified accord-ing to the actual conditions observed in streamflow and each hydro-geomorphotype during five different scenarios that oc-curred during the training storm event. The final contributing area scenario map shows the best agreement between the re-classified log values of the flow accumulation map and the field evidence.
3.2 Object-based hydro-geomorphological mapping
[image:6.612.154.442.65.273.2] [image:6.612.98.495.310.458.2]applications since it follows the general rule that it should be adequately sufficient at the local hillslope scale, mark-ing the transition in process dominance from hill slope to channel (Peckham, 2009). This DEM was used for creating an “object-based” hydro-geomorphological map that was ob-tained with a step-by-step rule set. During the first step, a ge-omorphometric analysis was performed by calculating plan and profile curvatures at increasing cell window sizes: 5, 7, 9, 11, 13, 15, 17, 19 and 21 cells. The multiscale analysis of curvatures was performed with Landserf free GIS software, thus obtaining a raster layer for each geomorphometric cal-culation.
During the second step the best agreement with expert-based geomorphological mapping was achieved with eCog-nition Developer software by means of an original mul-tiresolution segmentation algorithm, using appropriate land-surface parameters.
The multiresolution segmentation algorithm merges spa-tially contiguous pixels or cells into “image objects” (seg-ments) based on local homogeneity criteria of the input pa-rameters. These segments, bounded by discontinuities in the input variables, are then used as building blocks in the clas-sification, according to attributes such as average values of input variables, shape indexes, and topological relations of segments (Dragut et al., 2013).
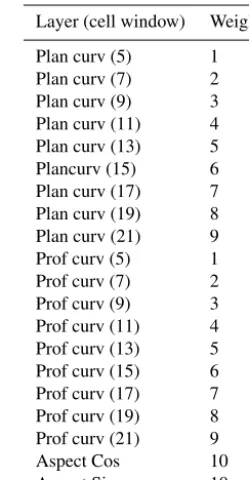
More precisely, the morphometric parameters obtained during the previous step (plan and profile curvatures at var-ious cell windows) are used with a proportional increased weight to the increasing cell window size for each raster layer (Table 1); sine and cosine of aspect were also used as input parameters. We did not consider the slope gradient since it is quite constant except for the valley bottom and hilltop and did not provide us with additional information for the seg-mentation procedure.
Other settings used for this algorithm are scale 7, shape 0.0002, and compactness 0.0002.
During this procedure, the segments obtained were com-pared to the expert-based geomorphological mapping by using the target-training procedure proposed in Guida et al. (2015) (Fig. 7a).
The image objects obtained from the segmentation are shown in Fig. 7b.
In the third step, the objects obtained during the previous step were classified. The classification procedure was car-ried out according to the criteria proposed by Hennrich et al. (1999), whose conceptual background was the “landscape catena” (Conacher and Dalrymple, 1977), which combines surface form and pedo–hydro–geomorphological processes at hillslope scale.
The classification was based on the sum of the planimet-ric curvatures that were re-classified according to the thresh-old values listed in Table 2. The interval values listed in Ta-ble 2 were achieved by a supervised classification. By only using the plane curvature sum computed with different win-dow sizes, we were able to obtain an object-based
hydro-Table 1.Weights assigned to each layer implemented in the eCog-nition developer software for the multiresolution segmentation al-gorithm.
Layer (cell window) Weight Plan curv (5) 1 Plan curv (7) 2 Plan curv (9) 3 Plan curv (11) 4 Plan curv (13) 5 Plancurv (15) 6 Plan curv (17) 7 Plan curv (19) 8 Plan curv (21) 9 Prof curv (5) 1 Prof curv (7) 2 Prof curv (9) 3 Prof curv (11) 4 Prof curv (13) 5 Prof curv (15) 6 Prof curv (17) 7 Prof curv (19) 8 Prof curv (21) 9 Aspect Cos 10 Aspect Sin 10
geomorphological map (Fig. 7c), which was in good agree-ment with the expert-based geomorphological map.
Finally, a spatial statistical analysis was performed on the object-based hydro-geomorphotype map (Fig. 7c) and the five contributing area scenarios maps in order to evaluate their spatial relationships for the training storm event that oc-curred in January 2015 (Fig. 6). The application at the storm event timescale is described in the next section.
3.3 Dynamic hydro-chemograph separation
[image:7.612.365.490.108.349.2]Figure 7. (a)Expert-based hydro-geomorphological map;(b)multiresolution segmentation map;(c)object-based hydro-geomorphological map obtained by classifying the multiresolution segmentation map using the plan curvature sum only.
Figure 8.Delimitation of the five inner fields that define the limits of seasonal response of the catchment (modified from Cuomo and Guida, 2016) and, in blue, the hysteretic cycle of the study event, from its beginning (blue circle) to its end (blue square). Legend: UH1 and W1, upper hyperbolic curve 1 and wet area 1, respectively (typical of theQ-EC mixed value of groundwater and groundwater ridging); UH2 and W2, upper hyperbolic curve 2 and wet area 2, respectively (typical of theQ-EC mixed value of groundwater, groundwater ridging and subsurface flow); UL3 and W3, upper linear curve and wet area 3, respectively, typical of theQ-EC mixed value of groundwater, groundwater ridging subsurface flow and direct runoff; LHg, lower hyperbolic curve typical of theQ-EC response when direct runoff is suddenly added to the groundwater following the heavy showers that occurred during the dry period;D, the dry area where theQ-EC typical of a dry fall for which only the groundwater flow feeds the streamflow;T, transition area, where theQ-EC typical values of a dry–wet or wet–dry fall, when the groundwater flows, groundwater ridging and soil pipe feed the streamflow.
In this study, these values were used for each phase of the field survey in order to verify the correspondence be-tween the end-member hydro-chemograph signature pro-posed by Cuomo and Guida (2013, 2016) and Guida and Cuomo (2014), and the starting runoff contributing area.
[image:8.612.155.442.372.514.2]spe-Table 2.Geomorphometric classification, geomorphological correspondence, hydro-geomorphotype definition and hydro-geomorphological behavior for each hydro-geomorphotype.
Sum of plan curvature class (SPC)
Geomorphometric parameters and to-pographic position
Landform, com-ponent or element (Dramis et al., 2011)
Hydro-geomorphotype (HGT in Cuomo, 2012)
Hydro-geomorphological behavior
SPC <−13.4 Convex, divergent flow-like, upslope
Upland, summit, peak, crest
Ridge Groundwater recharge on bare bedrock and dominant excess infiltration runoff af-ter storm
−13.4 >=SPC <−3.76 Light convex-divergent flow-like, up to mid-slope
Shoulder, side slope
Nose Shallow soil, groundwater recharge area, prevalently excess infiltration runoff
−3.76 >=SPC < 2.3 Light convex-planar, parallel flow-like, midslope
Scarps, back slope, foot slope, wash slope, talus,
Hillslope Debris, deep soil, shallow aquifer, excess
saturation excess and sub-surficial runoff 2.3 >=SPC < 11.6 Planar to light
con-cave, convergent flow-like, upslope
Glen, swallet, scar Hollow Deep soil, shallow aquifer, prevalently excess satura-tion, delayed runoff pro-duction
SPC=> 11.6 Concave, con-vergent mid- to down-slope
V-shaped stream, gully, bank, stream bed
[image:9.612.69.526.96.361.2]Riparian corridor Shallow soil, groundwater discharge, prevalently sub-surface, delayed return flow and groundwater ridging
Table 3.Hydro-chemical parameter range, distinctive for the wet (W), dry (D) and transition (T) period events. Legend: GW is for ground-water, SSF is for subsurface flow, and DR is the direct runoff (modified from Guida and Cuomo, 2016).
Field Processes and contributing areas ECquickrange ECslowrange Qthreshold
(mS cm−1) (mS cm−1) (L s−1) W1 GW from bedrock deep and perched aquifer 250–300 30–50
GW+GWridgingadded from riparian corridor 200–220 400
W2 GW+GWridgingalong the riparian corridor 200–220
GW+GWridging+SSF added from colluvial hollow 120–180 1000
W3 GW+GWridging+SSF 120–180 1000
GW+GWridging+SSF+DR added from soil pipe 70–180 1000
D GW 320–350 3–5
GW+GWridging 100–180 400
T GW+GWridging 100–180 400
GW+GWridging+DR added from soil pipes 100–120
cific mechanism, source area and timing of runoff produc-tion. The lower hyperbolic curve (LHg) delimits all the Q-EC values recorded during the dry period. The upper hy-perbolic (UH) curves delimit theQ-EC values that are typ-ical of groundwater and groundwater ridging for the UH1 curves. The second upper hyperbolic curves (UH2) start when the UH1 reaches its horizontal asymptote and the sub-surface mechanism starts, following which the upper lin-ear curve (UL) starts when the direct runoff and soil pipe
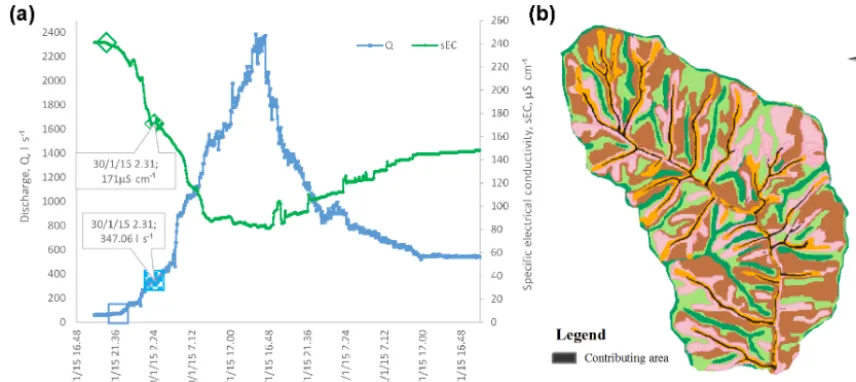
[image:9.612.95.500.408.578.2]Figure 9. (a)Pre-event hydro-chemograph conditions, just before the storm event, withQ=60 L s−1, filled blue square, and EC=240 µS−1, filled green diamond,(b)scenarios corresponding to groundwater and decreasing groundwater ridging contribution to streamflow running exclusively along the riparian corridor and main streamflow.
8, and 9 were assigned to the dry discharging period. More-over, the Q-EC relationship highlights three different types of hydrologic behavior occurring in the three hydrologic pe-riods: wet (W), dry (D) and transition (T). In this way, the boundary curves between the dry–wet and wet–transition events were obtained in order to define further inner fields. Figure 8 shows a typical “threshold hydro-geomorphological system”, where each source runoff remains independent dur-ing low magnitude events but interacts physically and func-tionally with other sources at higher event magnitudes, thus inducing superposed hydrological mechanisms and complex hydro-chemical water mixing by dilution, dispersion and dif-fusion. By identifying these five areas with respect to the hy-drologic behavior of the catchment, it was possible to carry out the analyses for delimiting the contributing area in the next section using the thresholds listed in Table 3.
By including the hysteretic cycle of the 29–31 Jan-uary 2015 study event in the plot of Fig. 8, the hydro-geomorphological response (see Supplement data) can be classified as typical for a wet period that occurred after a short transition period during which the aquifer began to fill and groundwater ridging decreased progressively. As ex-pected, during the event all the runoff components were pro-gressively activated when the Q-EC threshold values for each started. Consequently, the contributing areas enlarged the floodplain upslope, the riparian corridors and the zero-order basins upstream, encompassing theQ-EC value ranges listed in Table 3. These values were verified during the field survey reported in Sect. 3.1 and used for the hydro-geomorphological analyses of the next section.
4 Results
For the storm study, the variability of the contributing area was obtained by combining the hydro-chemical procedure and the object-based hydro-geomorphotype map. As a result of this analysis, contributing area space–time variability was obtained for the selected storm event by combining hydro-chemical procedure outcomes, the hydro-geomorphotype map and the contributing area scenarios.
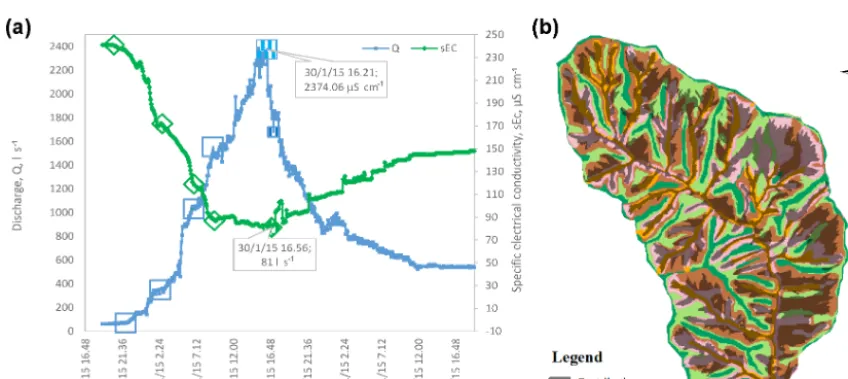
On the right-hand side of Figs. 9–13, hydro-chemograph evolution at the five time steps discussed in Fig. 6a is illus-trated, while on the left-hand side of Figs. 9–13, we can see the progressive expanding contributing areas shown on the hydro-geomorphotype map. Specific observations are pro-vided in the figure captions and the corresponding values for the increasing contributing area are listed in Table 4.
Figure 9 shows pre-event conditions, when only the base-flow and the decreasing groundwater ridging from previous events were activated.
By plotting the S vs. Qdata from Table 3 on a normal plot, we can follow the pattern of the progressive involve-ment of the runoff components as specific contributing areas in streamflow (Fig. 14).
In our case, a positive exponential function was obtained for each hydro-geomorphotype curve as shown in Fig. 14. This approach is similar to the calculations proposed by La-tron and Gallart (2007), but in this case the contributing area is calculated according to the baseflow component as well as the other components related to hydro-geomorphotypes. All the curves have a general exponential pattern (Eq. 1):
S(t )=S0eaQ(t ), (1)
[image:10.612.85.491.66.249.2]com-Figure 10.Initial hydro-chemograph conditions just after the beginning of the storm event, with approximatelyQ=350 L s−1, filled blue square, and approximately EC=170 µS−1, filled green diamond,(b)scenarios corresponding to increasing groundwater ridging and initial saturation excess contributions to streamflow. The first occurs along the riparian corridor, and the second at the apical transient channels just downstream from the colluvial hollows, respectively.
Figure 11. (a)Progressive hydro-chemograph conditions after approximately 60 mm of rainfall, with approximatelyQ=1000 L s−1, filled blue square, and approximately EC=120 µS−1, filled green diamond,(b)scenarios corresponding to a full saturation excess contribution to streamflow along the riparian corridor and at transient channels within the colluvial hollows, respectively.
ponent considered, and Q(t)is the discharge at the time of S(t).
Equation (1) can be re-written as
logS(t )=aQ(t )+logS0. (2)
The riparian contribution trend is higher than the hollow and hillslope trends for a discharge from 50 to 1000 L s−1, but the specific hollow and hillslope contributing areas progres-sively reach the same values as the riparian corridor in the event of high discharge. In fact, a slight increase in the dis-charge from the riparian corridor was observed during the
[image:11.612.83.511.66.257.2] [image:11.612.79.494.331.512.2]Figure 12.Advanced hydro-chemograph conditions, after approximately 80 mm of rainfall, with approximatelyQ= 1550 L s−1, filled blue square and approximately EC=90 µS−1, filled green diamond,(b)scenarios corresponding to a full saturation excess contribution to streamflow along the riparian corridor and the whole colluvial hollows, respectively.
Figure 13. Final hydro-chemograph conditions, after approximately 100 mm of rainfall inducing a peak discharge of approximately
Q=2400 L s−1, filled blue square, and about EC=80 µS−1, filled green diamond,(b)corresponding both to full saturation excess contri-butions to streamflow from the riparian corridor and colluvial hollows, as well as to macropore (soil pipe and fracture) and excess infiltration on noses and partially on the ridges, respectively.
Since 1970 authors have studied the relationships between the contributing area and the baseflow discharge (Fig. 15a). In fact, Ambroise (1986), Myrabo (1986) and Latron (1990) found good relationships for some catchments in which the increasing rate of the relative saturated area decreases with the increase in a specific discharge.
Dunne et al. (1975) observed that an increase in the sat-urated area leads to an increase in the discharge. More re-cently the same relationship was observed by Martinez-Fernandez (2005). Latron and Gallarat (2007) found a
lin-ear relationship between the specific discharge and the extent of the contributing area. The authors believe that, unlike the other catchments, the linear trend could be reasonable since the saturation of the catchment under study is not conditioned by its topography.
[image:12.612.85.509.330.519.2]Figure 14.Plot of the contributing area vs. discharge from data in Table 3.
Figure 15. (a)Relationship between the total extent of contributing saturated areas and the baseflow discharge in several small (less than 10 km2)catchments (modified from Latron and Gallarat, 2007);(b)relationship between the contributing areas and the specific discharge for each hydro-geomorphotype of the Ciciriello catchment.
When a low discharge occurs, the riparian corridor slowly contributes to the increasing discharge, and only for q=100 L s−1km−2does this hydro-geomorphotype widen its contributing areas. Fig. 15 shows the increase in faster contributing areas for hollow, hillslope and nose at specific discharges q=300, 200 and 100 L s−1km−2, respectively. In this case theseq values are considered as theqthreshold values for activating runoff mechanisms.
There is an evident anomaly regarding the riparian corri-dor, as it shows a percentage of contributing area over 100 %. In our opinion, this result is due to a DEM resolution and the riparian corridor must be carefully defined due to the possi-ble overlap with other hydro-geomorphotypes, especially the hollows. In Fig. 15 it is important to note the intersection be-tween all the curves at highqvalues. In our opinion, it shows the interaction between all the runoff mechanisms occurring in the catchment during high-magnitude events before reach-ing the stream, as assumed by Cuomo and Guida (2016).
One of the most interesting results of this study is the ex-perimental confirmation of the pre-event water contributions
to streamflow by the rapid mobilization of the capillary fringe inducing groundwater-ridging mechanisms. This mechanism is still poorly understood despite the number of processes proposed and widespread acceptance (Cloke et al., 2006). Therefore, this case study can be considered the preliminary identification, recognition and quantification of the mecha-nisms at catchment scale.
5 Conclusion
[image:13.612.88.503.263.406.2]3 600 197.58 0.015 0.0155 0.004783 4 1000 329.30 0.038 0.0400 0.012365 5 1900 625.68 0.420 0.447 0.138233 Nose 1 50 16.47 0.00008 0.00012 2.47×10⁻⁵
2 300 98.79 0.00020 0.00032 6.59×10⁻⁵ 3 600 197.58 0.001 0.00131 0.000272 4 1000 329.30 0.015 0.0241 0.005014 5 1900 625.68 0.119 0.188 0.039129 Hollow 1 50 16.47 0.007 0.00994 0.002297 2 300 98.79 0.015 0.02151 0.004972 3 600 197.58 0.050 0.07109 0.016432 4 1000 329.30 0.093 0.13316 0.030782 5 1900 625.68 0.450 0.64116 0.148211 Ridge 4 1000 329.30 0.00030 0.000814 9.88×10⁻⁵
5 1900 625.68 0.005 0.0145 0.001762
data acquisition, mapping, analysis, modeling and general-purpose applications. This is the general-purpose of object-based hydro-geomorphology, based on the methods for recogniz-ing and classifyrecogniz-ing distinctive hydro-objects within catch-ments, involving ontology and semantics of landforms and processes in significant catchment areas with distinctive hy-drological behavior and response in order to allow for their objective description, holistic analysis and inter-catchment comparison.
From this perspective, firstly by means of a recursive training-target approach (Guida et al., 2015), good agreement was observed between expert-based geomorphological map-ping and an object-based geomorphometric map.
Therefore, by combining hydro-chemical analysis and an object-based hydro-geomorphotype map, the variability of the contributing area during a significant storm event was spatially modeled using the log values of the flow accumula-tion. In spite of its simplicity, a good agreement was observed between the spatial distribution of these parameters with the observed contributing areas detected during the event by car-rying out direct surveys and taking surface and groundwater discharge measurements. The runoff components were de-termined for the storm event under study and specific runoff
discharge from each contributing hydro-geomorphotype was calculated for each time step on the hydro-chemograph.
This study is the experimental confirmation of the role and entity of pre-event water contributions to streamflow by the rapid mobilization of the capillary fringe inducing the groundwater-ridging mechanism in steep sloping terrains. This mechanism is still poorly understood despite the num-ber of processes proposed and widespread acceptance (Cloke et al., 2006); therefore, this case study can be considered as being a preliminary identification, recognition and quantifi-cation of this particular mechanism at catchment scale. Ac-cording to Marcus et al. (2004), this study emphasizes the fact that field-based process studies must “continue to form the underpinning of hydrologic application in GIS’s” and “GIScience should not come at the expense of sacrificing field-based studies of hydrologic processes and responses”.
[image:14.612.102.495.108.421.2]parsimo-nious and effective methodology for water resource assess-ment and manageassess-ment as suggested by the Biosphere2 pro-gram. In fact, in UNESCO International Designation Areas (such as the Cilento Global Geopark), the Global Geopark Network mission must guarantee hydro-geodiversity in com-pliance with the regulations laid down by the World Heritage Cultural Landscape Management, and natural and managed ecosystems (A1) must be safeguarded as established by the MAN AND BIOSPHERE program.
From this perspective, geomorphometry plays a funda-mental role in quantifying and objectively mapping hydro-geomorphological entities with hydrological relevance that require monitoring and modeling in production, transferring and routing the flows between the various units in the catch-ments, as the base knowledge of progressive ecological plan-ning for the sustainable use of water resources and best prac-tices in land use improvements.
6 Data availability
The underlying research data can be publicly accessed and are available from the Supplement.
The Supplement related to this article is available online at doi:10.5194/hess-20-3493-2016-supplement.
Competing interests. The authors declare that they have no conflict of interest.
Acknowledgements. The paper was financed with ORSA155417 University of Salerno research funds. The authors would like to thank Pasqualino Lovisi for taking field measurements, Giuseppe Benevento for his scientific support (CUGRI), Aniello Aloia and Angelo De Vita, Cilento Global Geopark manager and director, for their institutional support, and Mauro Biafore for the rainfall data obtained from the Campania region monitoring system. Edited by: A. Guadagnini
Reviewed by: two anonymous referees
References
Ambroise, B.: Role hydrologique des surfaces saturées en eau dans le bassin du Ringelbach à Soultzeren (Hautes-Vosges), France, “Recherches sur l’Environnement dans la Région”, Actes du 1er Colloque Scientifique des Universités du Rhin Supérieur, Uni-versité Louis Pasteur – Conseil de l’Europe, Strasbourg, France, 27–28 June 1986, 620–630, 1986.
Anders, N. S., Seijmonsbergen, A. C., and Bouten, W.: Segmenta-tion optimizaSegmenta-tion and stratified object-based analysis for semi-automated geomorphological mapping, Remote Sens. Environ., 115, 2976–2985, doi:10.1016/j.rse.2011.05.007, 2011.
Baatz, M. and Schäpe, A.: Multiresolution Segmentation: an opti-mization approach for high quality multi-scale image segmenta-tion, in: Angewandte Geographische Informa tionsverarbeitung XII, edited by: Strobl, J., Blaschke, T., Griesebner, G., and Wichmann-Verlag, H., 12–23, 2000.
Babar, M.: Hydrogeomorphology, Foundamental applications and techniques, New India Publishing Agency, New Delhi, India, 2005.
Barling, R., Moore, I., and Grayson, R.: A Quasi-Dynamic Wetness Index for Characterizing the Spatial Distribution of Zones of Sur-face Saturation and Soil Water Content, Water Resour. Res., 30, 1029–1044, 1994.
Betson, R.: What is watershed runoff?, J. Geophys. Res., 69, 1541– 1551, 1964.
Buchanan, B., Easton, Z., Schneider, R., and Walter, M.: Incorporat-ing Variable Source Area Hydrology into a Spatially Distributed Direct Runoff Model, J. Am. Water. Resour. As., 48, 43–60, doi:10.1111/j.1752-1688.2011.00594.x, 2012.
Cascini, L., Cuomo, S., and Guida, D.: Typical source areas of May 1998 flow-like mass movements in the Campania region, South-ern Italy, Eng. Geol., 96, 107–125, 2008.
Cloke, H., Anderson, M., McDonnell, J., and Renaud, J.-P.: Using numerical modelling to evaluate the capillary fringe groundwa-ter ridging hypothesis of streamflow generation, J. Hydrol., 316, 141–162, 2006.
Conacher, A. J. and Dalrymple, J. B.: The nine unit landsurface model: An approach to pedogeomorphic research, Geoderma, 18, 1–154, 1977.
Cuomo, A.: The contribute of the Hydro-Geomorphology in the evaluation of the flood discharge in the Campania region, Phd thesis, University of Salerno, Fisciano, Italy, 2012.
Cuomo, A. and Guida, D.: Discharge-electrical conductivity rela-tionship in the Ciciriello Torrent, a reference catchment of the Cilento, Vallo Diano and Alburni European Geopark (Southern Italy), Rendiconti on line Società Geologica Italiana, 28, 36–40, 2013.
Cuomo, A. and Guida, D.: Using hydro-chemograph analyses to reveal runoff generation processes in a mediterranean catchment, Hydrol. Process., doi:10.1002/hyp.10935, accepted, 2016. Cuomo, A., Guida, D., Palmieri, V., and Rossi, R.:
Hydro-Geomorphotype: A New Object-Based Unit in Hydro-Geomorphological Analysis and Modelling. IAG/AIG In-ternational Workshop on “Objective Geomorphological Repre-sentation Models: Breaking through a New Geomorphological Mapping Frontier”, Abstract book, University of Salerno, 15–19 October 2012, 37–40, 2012.
Dragut, L. and Blaschke, T.: Automated classification of landform elements using object-based image analysis, Geomorphology, 81, 330–344, doi:10.1016/j.geomorph.2006.04.013, 2006. Dragut, L., Minár, J., Csillik, O., and Evans, I. S.: Land-surface
seg-mentation to delineate elementary forms from Digital elevation Models, Geomophometry, 1–5, 2013.
Dragut, L., Csillik, O., Eisank, C., and Tiede, D.: Auto-mated parameterisation for multi-scale image segmentation on multiple layers, ISPRS J. Photogramm., 88, 119–127, doi:10.1016/j.isprsjprs.2013.11.018, 2014.
Source Watershed in the Northeast United States, Water Resour. Res., 43, W03413, doi:10.1029/2006WR005076, 2007. 2008. Easton, Z. M., Fuka, D. R., White, E. D., Collick, A. S., Biruk
Asha-gre, B., McCartney, M., Awulachew, S. B., Ahmed, A. A., and Steenhuis, T. S.: A multi basin SWAT model analysis of runoff and sedimentation in the Blue Nile, Ethiopia, Hydrol. Earth Syst. Sci., 14, 1827–1841, doi:10.5194/hess-14-1827-2010, 2010. Eisank, C., Smith, M., and Hillier, J.: Assessment of
mul-tiresolution segmentation for delimiting drumlins in dig-ital elevation models, Geomorphology, 214, 452–464, doi:10.1016/j.geomorph.2014.02.028, 2014.
Goerl, R. F., Kobiyama, M., and dos Santos, I.: Hydrogeomorphol-ogy: principles, concepts, processes and applications, Revista Brasileira de Geomorfologia, 12, 103–111, 2012.
Guida, D. and Cuomo, A.: Using discharge-electrical conductivity relationship in a Mediterranean catchment: the T. Ciciriello in the Cilento, Vallo Diano and Alburni European Geopark (South-ern Italy), Eng. Geol. for Society and Territory, Torino, Springer International Publishing, Switzerland, 3, 201–205, 2014. Guida, D., Cestari, A., Cuomo, A., Dramis, F., Palmieri, V., Paron,
P., and Siervo, V.: The geomorphological informative mapping system of Salerno University: an overview, Proceedings of the IAG/AIG International Workshop on “Objective Geomorpholog-ical Representation Models: Breaking through a New Geomor-phological Mapping Frontier”, University of Salerno, Fisciano, Italy, 71–72, 2012.
Guida, D., Cuomo, A., Cestari, A., Dramis, F., Palmieri, V., and Siervo, V.: The Salerno University Geomorphological Informa-tive Mapping System: the Licosa polygentic case study (Cilento European Geopark, southern Italy), in: Geomorphometry for Geosciences, Adam Mickiewicz University in Poznan, Institute of Geoecology and Geoinformation, International Society for Geomorphometry, edited by: Jasiewicz, J., Zwolinski, Z., Mi-tasova, H., and Hengl, T., 53–56, 2015.
Hengl, T.: Finding the right pixel size, Computers & Geosciences, 32, 1283–1298, doi:10.1016/j.cageo.2005.11.008, 2006. Hennrich, K., Schmidt, J., and Dikau, R.: Regionalization of
ge-omorphometric parameters in hydrologic modelling using GIS, Regionalization in Hydrology, edited by: Diekkruger, B., Kirkby, M., and Schroder, U., IAHS Publication 254, Proceedings of the Conference on Regionalization in Hydrology at Braunschweig, March 1997, International Association of Hydrological Sciences, Wallingford, UK, 181–191, 1999.
bassin versant versant du Strengbach (Aubure), Memoire de Maıtrise, UFR de Géographie, CEREG, Université Louis Pas-teur, Strasbourg, France, 1990.
Latron, J. and Gallart, F.: Seasonal dynamics of runoff-contributing areas in a small mediterranean research catchment (Vallcebre, Eastern Pyrenees), J. Hydrol., 335, 194–206, 2007.
Longobardi, A., Guida, D., Cuomo, A., and Villani, P.: Chemical streamflow analysis as a support for hydrograph filtering in small size watersheds: the Ciciriello experimental catchment (Cilento, Vallo di Diano and Alburni European and Global Geopark), in: WSEAS, edited by: Ceron Breton, J. G., Quartieri, J., Guida, M., Guida, B., and Guarnaccvia, C., Vietri (SA), Italy, 96–102, 2014. Longobardi, A., Villani, P., Guida, D., and Cuomo, A.: Hydro-geo-chemical streamflow analysis as a support for digital hydrograph filtering in a small, rainfall dominated, sandstone watershed, J. Hydrol., 539, 177–187, 2016.
Lyon, S., Walter, M. T., Gerard-Marchant, V., and Steenhuis, T.: Using a Topographic Index to Distribute Variable Source Area Runoff Predicted with the SCS Curve-Number Equation, Hydrol. Process., 18, 2757–2771, 2004.
Marcus, A. W., Aspinall, R. J., and Marston, R. A.: Geographic information systems and surface hydrology in mountains, In M. P. Bishop and J. F. Shroder Jr, Geographic information science and mountain geomorphology, Chilchester, UK, Springer-Praxis, 344–370, 2004.
Martinez Fernandez, J., Ceballos Barbancho, A., Hernández San-tana, V., Casado Ledesma, S., and Morán Tejeda, C.: Proce-sos hidrológicos en una cuenca forestada del Sistema Central: Cuenca experimental de Rinconada, Cuadernos de Investigacion Geografica 31, 7–25, 2005.
Moore, I., Burch, G., and Mackenzie, D.: Topographic Effects on the Distribution of Surface Soil Water and the Location of Ephemeral Gullies, Transaction ASAE, 31, 1098–1107, 1988. Myrabo, S.: Runoff studies in a small catchment, Nord. Hydrol., 17,
335–346, 1986.
National Research Council: New strategies for America’s watrshed. Wasshinghton, D.C., National Academy Press, New York, USA, 1999.
Okunishi, K.: Hydrogeomorphological interactions: A review of ap-proach and strategy, Trans. Jpn. Geomorph. Union, 12, 99–16, 1991.
Peckham, S. D.: Geomorphometry and spatial hydrologic mod-elling, in: Geomorphometry: concets, software, applications, edited by: Hengl, T. and Reuter, H. J., Elsevier, Amsterdam, the Netherlands, 579–602, 2009.
Pionke, H., Gburek, W., Sharpley, A., and Schnabel, R.: Flow and Nutrient Export Patterns for an Agricultural Hill Land Water-shed, Water Resour. Res., 32, 1795–1804, 1996.
Sidle, R. C. and Onda, Y.: Hydrogeomorphology: overview of an emerging science, Hydrol. Process., 18, 597–602, 2004. Sidle, R. C., Tsuboyama, Y., Noguchi, S., Hosoda, I., Fujieda, M.,
and Shimizu, T.: Stormflow generation in steep forested headwa-ters: a linked hydrogeomorphic paradigm, Hydrol. Process., 14, 369–385, 2000.
van Asselen, S. and Seijmonsbergen, A. C.: Expert-driven semi-automated geomorphological mapping for a mountain-ous area using a laser DTM, Geomorphology, 78, 309–320, doi:10.1016/j.geomorph.2006.01.037, 2006.
Vander Kwaak, J. and Loague, K.: Hydrologic-Response Simu-lations for the R-5 Catchment with a Comprehensive Physics-Based Model, Water Resourc. Res., 37, 999–1013, 2001. White, E., Easton, Z., Fuka, D., Collick, A., Adgo, E., Mc-Cartney,
M., Awulachew, S. B., Selassie, Y. G., and Steenhuis, T. S.: De-velopment and Application of a Physically Based Landscape Wa-ter Balance in the SWAT Model, Hydrol. Process., 25, 915–925. doi:10.1002/hyp.7876, 2011.