A MULTI-DIMENSIONAL DATABASE MODEL FOR RESEARCH
PERFORMANCE ANALYSIS
Fatin Shahirah Zulkepli, Roliana Ibrahim, Aryati Bakri, Nor Hawaniah Zakaria, Haza Nuzly Abdull Hamed,
Hazimah Khalid and Mohd Aizaini Maarof
Department of Information System, Faculty of Computing, Universiti Teknologi Malaysia, Johor Bahru, Johor, Malaysia E-Mail: [email protected]
ABSTRACT
Business Intelligence (BI) system mix operational data with analytical tools to represent descriptive and complicated data to groups of decision maker. BI aim to enhance the features and accuracy of data to the decision making process. Nowadays, BI are widely applied in industry as BI aid in decision making and strategic planning. In order to achieve that, BI pulls and gathers information from variety sources of information systems. To make BI data meaningful, a conceptual dimensional database is needed to represent all data stored in one particular BI. Multi-dimensional database (MDB) is one type of database which possessed ability to process database rapidly so the results can be generated in no time. MDB also optimized the functionalities of data warehouse. Although business intelligence and MDB is broadly used in business institutions, research related about them is limited especially in academic performance area. Therefore, this research study aim to develop a BI framework for online reporting system. Hence, the objective of this paper is to review and discuss the relationship of BI with MDB for Universiti Teknologi Malaysia (UTM) research performance. In the future, this research study expected to propose a data model of online reporting system for upper management dashboard.
Keywords: business intelligence, multi-dimensional database, information management, research performance.
INTRODUCTION
Business intelligence (BI) offer huge potential for business institution to gain insights into their daily operation, as well as longer term opportunities and threats. BI help in fasten and improve decision making process and enhance operational efficiency. A conceptual dimensional database is needed to represent all data stored inside a business institution. BI work by pulling data from data warehouse. To sort large amount of data according to decision makers’ requirements, that’s where multi -dimensional database (MDB) plays role. A MDB system able to pull and accept data in database in no time so that the answers or decision can be made rapidly. A MDB able to store a specific amount of data in a large memory. Hence, this paper is structured as follows: first section will discussed in depth regarding business intelligence. This is followed by discussion related with multi-dimensional database. Then, we will go in details with MDB approaches in business dimensions and last section will explained the initial results of MDB approaches in UTM research performance.
BUSINESS INTELLIGENCE
Business Intelligence (BI) system mix operational data with analytical tools to represent descriptive and complicated data to groups of decision [9]. Solomon stated that BI is used to grasp the capabilities available in a business institution; future directions and trends in the markets, state of the business institution, environment which business institutions operating and the technologies. While [6], stated in his paper, BI cover a mixture of applications, tools, and techniques that enable business institution to collect data from variety sources, prepare it for analysis and data cleaning, develop and run queries against the historical data, and create dashboards, data
visualizations and reports to make the analytical results available to associate decision makers.
BI was barely used back then, but [5] stated in one of his papers, at year 1989, he was credited as one of the first proposing a data analysis approach to support business decision making processes. On the other hand, BI comes with lots of benefits including improving and fasten duration of decision making, increasing operational efficiency, optimizing internal business processes, and driving new revenues [6]. BI also help business institution to spot business institution flaws that need to be fixed and recognized market trends. In a research study done by [9]. BI helps in oversee business activity and decision support. BI also assists in decision making and operational level in order to corporate performance management and meet requirements from the top management.
This research study define BI systems as follows; Business Intelligence is the methods of transforming data into information and from information into knowledge. In addition, the term knowledge in this research study is
basically about client’s decision making processes, the competitors, client’s needs, and cultural trends,
environment of business institutions and also financial status of a business institution. The idea of this definition is BI systems ensure desirable information delivered at the right time, at the right location and in the right form to help decision makers. As stated earlier, the objective of BI is to improve the flow and quality of inputs to the decision process, hence facilitating top management business institution.
paid by the business institution is for the data analysis and the usage of data warehouse. By using this approach, it shows that the companies are well process-oriented than in the past [2]. In addition, in order to cut the costs and in line with the market, they are applying a strategy where both customers and suppliers are involved to match all the business activities. Meanwhile, each companies have their own strategy set through metrics-driven management. It is vital for them to fully understand the significance to accomplish [11].
Business intelligence elements
Most of the time, BI refers to instant response, which is refer to online decision making. It also refers to limiting time frame hence the intelligence is still useful to the decision maker. According to [5], important elements of proactive BI are;
Real time data warehouse Data mining
Exception detection and automated anomaly Automatic learning and refinement
[image:2.595.308.545.185.376.2] Seamless workflow
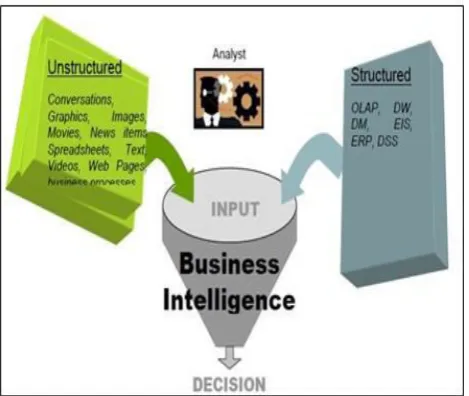
Figure-1 shows the range of data inputs available to provide and support the intelligence needed in decision making.
Figure-1. Data inputs to BI systems (Solomon Negash, 2004).
Figure-1 shows input to BI systems. As shows at figure above, there are two types of data which is unstructured and structured data. Structured data consists of data warehouse, On-Line Analytic Processing (OLAP), Data Mining (DM), Enterprise Requirement Planning (ERP) and Executive Information Systems (EIS). While unstructured data consists of conversations, graphics, images, text and etc. The description of unstructured data is used for all uncategorized data which is not sorted neatly into flat files or relational, which is called structured data. BI is a natural progression that was created in the previous system before it was redesigned to
[image:2.595.52.287.403.601.2]support the decision-making process. The redesigned process will lead to desired systems and providing advanced capabilities in terms of software. As stated before, BI pulls information from many other system. Figure-2 shows the information systems that are used by BI.
Figure-2. BI relation to other information systems (Solomon Negash, 2004).
Figure-2 shows BI relation to other information systems used where CRM represent Customer Relationship Management and GIS represent Geographic Information Systems. BI will amend all these data into information and, through human analysis, it will then convert into knowledge. According to [9], BI performs such following tasks such as;
Ad hoc access different scenarios and the impacts of changes
A “what if” analysis of the effect of changes and
alternative scenarios.
Prediction based on historical data, past and ongoing performances and predict the performance of business institution
Whereas according to [9], BI combines a broad set of data for analysis. Among the examples of the data set including mobile BI, company reports, real-time BI, BI operations, open source BI, analytics and ad hoc querying, BI cloud and software as a service, location intelligence, online analytical processing (OLAP) and BI cooperation. He also said BI technology along with the tools to build a BI dashboard and scorecard that displays performance data visualization software described and to design charts and other information.
using data integration and data quality tools to ensure that decision makers analyze precise and persistent [10].
Business intelligence architecture
Data warehouse
Data warehouse is a data storage which compiled a broad range of data from multiple sources within a company. These data will be used as a guide for management decision. The construction of data warehouse involving data cleaning, integration and transformation and all of these are vital processing steps in data mining. According to [1], the characteristics of data warehouse are subject oriented, separate, not dynamic, time variant and integrated performance. Data warehouse is characterized as a subject oriented because data warehouse is revolving around big data such as, time, supplier, sales and etc. Besides, data warehouse is always different in terms of physical data as it differs from traditional on-line transaction processing environments because data were adjusted and amended according to requirements.
Third characteristics of data warehouse is data warehouse is not dynamic. It means when the data is revised and updated, it is not done on individual basis but done periodically. Next, data warehouse is an integrated performance which means data requested by the end users has to perform well on all types of integration. This is why data cleaning and data integration techniques are used to verify consistency in naming dimensions, structures and attributes. And last but not least, data warehouse must be time variant. In details, problems have to be identified, data trends have to be explored.
An efficient data warehouse need to analyze business processes, business environment and also dimensions. After data warehouse logical schema is obtained, set it up through the application of transformation into the source of logical schema. Due to different perspectives of decision makers, construction of complex and large building applied. These perspectives combined to form a framework that represents a bottom-up, top-down, business-driven, or owner's perspective, as well as builder-driven, or view to implementing information systems. All these structures cubes, measures and dimensions interact with each other to provide a very solid reporting environment. The multi-dimensional database (MDB) used within a decision support and business institution framework is specific. In general, there can be classify into special traditional relational database management which form multi-dimensional schemas such as star schema which will be explain in later part of this paper.
However, all these data need to be separated from one dimension into many dimensions as required per business dimensions mappings. Onto next section, this paper will discuss more about multi-dimensional database and discuss more on data cleaning and integration before moving to the making of multi-dimensional model.
MULTI-DIMENSIONAL DATABASE
A multi-dimensional database (MDB) is one of the database type which is enhanced for data warehouse. A MDB is generated using existing data from relational database. A MDB system possessed the capability to accept the data in database in no time so that the answers or decision can be made rapidly. How data is stored and each user interfaces differs for each MDB. In MDB, applications are user friendly since there are no uniform specifications exist. The special database systems do not support extensive query [1]. There are four different views related to the design of data warehouse which are data source view, data warehouse view, top-down view and business query view. Firstly, top down view grant selection of chosen data to be stored inside data warehouse. Data source view display information being store, captured and managed by the operational systems. These data will be stored in detail and accurately, from individual data source tables to integrated sources of data tables. Data sources are always present in a form traditional data model approach such as entity-relationship diagram (ERD) or computer aided software engineering (CASE) tools. Next, data warehouse view join fact tables and dimension tables. So, in total, all the data will combine to form historical scenarios. Finally, the business query view is the requirement of data in data warehouse from the viewpoint of end users.
Multi-dimensional modeling known as a method in formalizing and visualizing data to a set of measures that defined by similar aspects in business institution. A very basic multi-dimensional modeling has two basic concepts which are facts and dimension. Facts or as well-known as measures is a group of related data items, consist of business measures. Measures are defined by a continuously valued results that describe facts. Fact aim of interest for the decision making business process and it is consider as a business statistics.
Figure-3. (a) A Multi-dimensional database as set of cubes (b) Elements in a cube (Fernando &Raul 2001).
Figure-4. (a) Some drill relationship between cubes. (b) A dimension for salesman (Fernando & Raul, 2001).
According to [3], each domain of a cube is called a Dimension Level, and a range is called a Measure (Figure-3 (b)). There is only one difference between a dimension level and a measure which is the role in a cube. A measure is also a dimension level. A tuple built with one element from each dimension level of a cube is called a Coordinate. Thus, a cube is a function from a set of coordinates into a measure. Note that, the set of coordinates of a cube is a finite set because all domains are finite. Figure-3 (a) and (b) both shows example of a multi-dimensional database in a business institution view.
Some cubes in the database could relate by a Drill relationship (up or down) (Figure-4 (a)). This relationship is induced by a Drill-Up relationship among some domains from each one of the involved cubes (Figure- 4).
A set of dimension levels with its Drill Up relationship is called a Dimension. In Figure-4(b), a dimension exposing its Drill Up relation is represented. This relation has two face: One between levels (the intension) and one between level elements (the extension). In the levels face, the Drill Up relationship is a partial order between levels called Level Hierarchy or Drill up Hierarchy. This hierarchy may present alternative paths through different levels. In the level elements face, an element in a level is related with at most one element in each higher level in the hierarchy.
The Drill Up relationship over cubes is induced by the Drill Up relationship over the involved levels. In Figure-2 (a), the cube (3) is related to (or “is computed
from”) the cube (1) because the Salesman level is under
All measures from cube (1) grouped by this “movement” in the hierarchy of Salesmen, must be summarized by the sum of operations to compute the measure in cube (3).
In summary, these following statements are conclusions made from the benefits of dimensions and measures methodology in MDB.
1. Data retrieval is quick because;
The data is dynamic and in accordance to any combination of dimension members. Data retrievals is easy with just a single input or command. All the data arranged is clustered tightly in a
multidimensional array.
One of the compulsory values in a cube is time. So any data will be calculated ahead of time.
The data is usually small and can reside completely in database memory.
2. MDB cubes storage is adequate because The cube blocks contain only data
A single index locates the block corresponding to a combination of scattered dimension numbers. A single small index usually resides completely in
memory.
MULTI-DIMENSIONAL DATABASE APPROACH INBUSINESS DIMENSION
A multi-dimensional technique has come a long way since its first discovery which is around 30 years ago. According to [1], a MDB is a unique methods that divide the information into measures and dimensions by giving further understanding regarding business institution process and user requirements. MDB views data as multi-dimensional cubes that are well suited for data analysis. Through MDB, a collective amount of data can be analysed for decision-making purposes.
Institution data warehouse. Such a model can be adopted with star schema or snowflake schema. As stated before, the core of MDB is data cubes. Data cubes contain large data sets (measures) and dimensions. Business dimensions are entities or perspective with respect to business institution that wants to keep information. MDB is based on three key concepts which are dimensions, cube and measures and modelling business rules. In a world of technology which pack with large amount of data, a MDB technology is the solution for decision-making processes. MDB model is proposed based on relational elements. Dimensions are modelled as dimension relations. Data mining is one of the process cleaning and filtering data set to search for unknown patterns, trends and relationships of data inside the MDB data structures. MDB models aim to help end users to fully understand the information, facts from different views in a way that he can relates the data with his understanding in the business environment.
In business dimension, MDB techniques came in a handy way since MDB promotes data mining, analytical processing and the information processing. In aspect of information processing, MDB made data querying and statistical analytics easier. While in analytical processing, as shown at figure 4 earlier, using dimensions with OLAP
will includes OLAP operations. For instances, drill-down, roll-up, drill-through and etc. And last but not least, by using data mining, it supports and helps to detect hidden patterns while performing classification, data cleaning, and prediction and etc. Last but not least, one of the big advantage using MDB in a business institution is it is a low-cost-web based application.
MULTI-DIMENSIONAL DATABASE APPROACH IN RESEARCH STUDY
UTM research performance analysis
Universiti Teknologi Malaysia (UTM) is one of universities in Malaysia carry Research University (RU) status. This RU status was obtained by possessing great achievements in research and publication and also by achieving KAI (Key Amal Indicators) or generally known as Key Performance Indicators (KPI) set by Ministry of Higher Education (MOHE), Malaysia. In order to maintain the RU status, the top management level (decision makers)
request a model and conceptual database which can display and analysis the trend of academic and research publications in UTM (business institution). Each UTM academic staff own a data dictionary which contain their personal data and job performance. Each of these data was kept in different data sources hence whenever the management level request to look multiple data from various data sources, the process to retrieve the data required is a time consuming. In perspective of research and performance analysis, a business intelligence dashboard is needed to monitor research accomplishment and performance analysis. Because of that, UTM tempt to create a multidimensional model database to overcome these problems. By applying business intelligence especially in research performance field, the data will be shared effectively and efficiently with upper management level in no time.
Figure-5 shows these research study methodology in order to build a BI MDB for UTM research performance. BI Research Methodology consists of six phases which are justification phase, planning phase, business analysis phase, design phase, construction phase, and deployment phase. First phase which is justification phase is a stage for identifying the problems from the decision makers. Second phase is planning phase. During planning phase, it is compulsory to set research study work schedule so every task is following the milestones. Third phase is a business analysis phase, during this phase, we are required to grasp the workflow of UTM research performance and do a literature review to give further understanding on the research. Fourth phase is a design phase. In this phase, we collect data from multiple data sources such as Research and Development Information System (RADIS), Research Management Centre (RMC), Perpustakaan Sultanah Zanariah (PSZ) and other data sources and do data cleansing and data integration
according to the users’ requirements. Fifth phase in this
research study is construction phase where the development of BI MDB is built. Last phase of this research study is the deployment phase where the MDB model test with end users.
Figure-6. Component of insights for MDB UTM.
KPI monitoring insights is divided into two parts which are research and publication. For KPI monitoring
research insights, it revolves around the staff’s
achievement and amount of grants received. By referring to Figure-7, it is clearly stated that the staff’s performance indicator is depend on several aspects which are age, staff position and grade, number of grants received, approved and also active grants for the past five years. All these aspects were determined by the decision makers. Next, based on Figure-8, the insights is different from the previous figure. This insight emphasizes more on quality of researchers based on several aspects which are
researcher’s role and research grants related matters.
Technically, same process was repeated for two others component.
Moving into next step, we obtained a large amount of data from UTM Research and Development
Information System (RADIS) related to UTM staffs’
performance. From the large amount of data, we classify the data according to the data list decision and verified each of the data with the RADIS entity-relationship diagram (ERD). Due to data confidentiality, we unable to show in details of data verification process. These step is important as it is to clarify the relationship between the database ERD diagram and the database itself. Data confidentiality is a data type, usually in terms of the legislation, the data is barred from any disclosure to the public. In terms of RADIS data, "confidentiality" refers to legal measures that prevent unauthorized disclosure of certain parties either directly or indirectly. It also refers to the procedure to prevent the disclosure of confidential data, including the rules applicable to staff, the rules when disseminating data collection, preparation of records, etc.
Next step is building a star-schema diagram. Star-schema is the simplest form of data warehouse and a special design technique for MDB representations. Star-schema diagram contains of a fact table for a specific business process (for instance, Product analysis would take Product as fact table) with a single table for each dimension table. Star-schema diagram enhance data query operations instead of data update. It is called a star-schema because the entity-relationship diagram fact tables and dimensions resembles with a star like structure where one fact table is connected to multiple dimensions. The benefits using star-schema diagram is the performance of the data will increase and the user tend to understand the data easily.
In order to build a star-schema diagram, we have to identify a business process for analysis. Then, we have to recognize measures or facts and lists the dimensions for facts. In star-schema, every dimension will have a primary key (PK) and also a dimension table will not have any parent table. Based on this research study progress, we had achieved some of our goals which are to investigate requirements and criteria of BI framework and to develop a BI framework for UTM research performance analysis. As for now, this research study is still ongoing. Our next milestone is testing data queries for database before we proceed onto the MDB model development.
Figure-8. KPI monitoring research insights.
CONCLUSIONS
In conclusion, this paper help us to enlighten our comprehensibility with the multidimensional structure related to business intelligence, business processes and dimensions. Multi-dimensional data model combined with facts and context dimensions using Star-schema. To the end of this paper, we discussed the implementation of BI into MDB building for UTM research performance analysis. The main target of using a business insight as it will be able to drill down the desired data. However, this research is solely for the use of UTM staffs. . It is unfortunate we unable to show the results in details as the data is confidential but we hope in the future, this MDB model can used in other educational field.
ACKNOWLEDGEMENTS
This research study has been fully funded by Faculty of Computing (FC). The authors would like to thank the management of Universiti Teknologi Malaysia (UTM), and Research and Development Information System (RADIS) for the continuous support in making this research study a success.
REFERENCES
[1] Agrawal Akshat and Sushil Kumar. 2015. "Analysis of Multidimensional Modeling Related To Conceptual Level." Analysis, pp. 119-123.
[2] Baina K., Tata S. and Benali K. 2013. A Model for Process Service Interaction. In Proceedings 1st Conference on Business Process Management (EindHoven, The Netherlands.
[3]. Carpani, Fernando and Raul Ruggia. 2001. “An Integrity Constraints Language for a Conceptual
Multidimensional Data Model.” SEKE. Vol.1.
[4] Chaudhuri, Surajit, Umeshwar Dayal and Vivek Narasayya. 2011. “An overview of business
intelligence technology.” Communications of the
ACM 54.8, pp. 88-98.
[5] Dresner, Daniel and Joy Garfield. 2014. “Balancing Risk Appetite and Risk Attitude in Requirements: a Framework for User Liberation”.
[6] Horkoff Barone et al. 2014. “Strategic business
modeling: representation and reasoning.” Software &
Systems Modeling, Vol. 13, No. 3, pp. 1015-1041.
[7]. Kaplan R.S. and Norton D.P. 1992. The Balanced Scorecard Measures that Drive Performance. Harvard Business Review, Vol. 70, No. 1.
[8] Langseth Justin and Nithi Vivatrat. 2003. “Why Proactive Business Intelligence is a Hallmark of the Real-Time Enterprise: Outward Bound.” Intelligent Enterprise, Vol. 5, No.18, pp. 34-41.
[9] Negash, Solomon. 2004. “Business Intelligence.” The communications of the Association for Information Systems, Vol. 13, No.1, p.54.
[10] Sharda, Ramesh, Jay E. Aronson and David King. 2008. Business Intelligence: A managerial approach. Upper Saddle River: Pearson Prentice Hall.