Imaging with Second-Harmonic Generation Nanoparticles
Thesis by
Chia-Lung Hsieh
In Partial Fulfillment of the Requirements
for the Degree of
Doctor of Philosophy
California Institute of Technology
Pasadena, California
Publications contained within this thesis:
1. C. L. Hsieh, R. Grange, Y. Pu, and D. Psaltis, "Three-dimensional harmonic holographic microcopy using nanoparticles as probes for cell imaging," Opt. Express 17, 2880–2891 (2009).
2. C. L. Hsieh, R. Grange, Y. Pu, and D. Psaltis, "Bioconjugation of barium titanate nanocrystals with immunoglobulin G antibody for second
harmonic radiation imaging probes," Biomaterials 31, 2272–2277 (2010). 3. C. L. Hsieh, Y. Pu, R. Grange, and D. Psaltis, "Second harmonic
generation from nanocrystals under linearly and circularly polarized
excitations," Opt. Express 18, 11917–11932 (2010).
4. C. L. Hsieh, Y. Pu, R. Grange, and D. Psaltis, "Digital phase conjugation
of second harmonic radiation emitted by nanoparticles in turbid media," Opt. Express 18, 12283–12290 (2010).
5. C. L. Hsieh, Y. Pu, R. Grange, G. Laporte, and D. Psaltis, "Imaging
Acknowledgements
During my five-year Ph.D. studies, I have thought a lot about science and life, but I have never thought of the moment of writing the acknowledgements of my thesis. At
this moment, after finishing writing six chapters of my thesis, I realize the acknowledgment is probably one of the most difficult parts for me to complete. I have got support and help from so many people, and it is hard to put all my gratitude into
words. This thesis cannot be accomplished without them.
I would like to thank my advisor Professor Demetri Psaltis, who gave me the
opportunity to experience this challenging and rewarding journey. He has taught and guided me during my studies with enormous trust and encouragements. He offered me the chance of being on detached duty for four years working with him at EPFL in the
beautiful city of Lausanne in Switzerland, which makes my Ph.D. life extraordinary. In these years, his vision and creativity have been the crucial input of my
accomplishments.
In my Ph.D. studies, I have been dedicated to the “SHRIMP” project in which I worked closely with my colleagues and also collaborators Ye Pu and Rachel Grange.
Working in the “SHRIMP team” is a unique and wonderful experience. The close cooperation within the team makes my research life delightful. Ye is an expert both in
optics and chemistry who always comes up with the ideas and suggestions. His rich experience has helped me do the right thing in the right way. Rachel is a great person to work with in the lab. She is a careful and patient experimentalist who is also full of
energy and passion. She has helped me save great amount of time in the experiment. I would also like to thank the two young members of the SHRIMP team, Thomas
SHRIMP project has been bumpy and challenging, and I cannot accomplish this far
without them.
I have been greatly benefited from the discussion and collaboration with scientists and professionals in nanotechnology and biology when pursuing the SHRIMP project.
For their help and supports, I would like to thank Paul Bowen in Powder Technology Lab at EPFL for kindly providing high-quality nanocrystals; Marc Chambon, Nathalie
Ballanfat and Sylviane Reymond in Biomolecular Screening Facility at EPFL for preparing biological cells; Arne Seitz, Thierry Laroche and Artacho José in Bioimaging and Optics Platform at EPFL for helping setup the confocal microscope;
Keith Harshman, Johann Weber, Floriane Consales, Marie-Agnes Doucey, John Wang and Pei-Jiun Chen in Protein and DNA Array Facility at University of
Lausanne for the advices and support of antibody conjugation, Ulrike Haessler, Miriella Pasquier, Witold Kilarski, Melody Swartz in Lymphatic and Cancer Bioengineering Lab at EPFL for live animal experiments.
I would also like to thank my colleagues, Andreas Vasdekis, Jae-Woo Choi, Alexandre Goy, Wuzhou Song, Julien Cuennet, Ioannis Papadopoulos, Grégoire
Laporte, and Jianhang Yang, who have provided me a friendly and supportive working environment. Especial thanks to Carole Berthet and Lucinda Acosta for the administrative support.
Finally, I want to thank my dear family, and also my dearest girlfriend, Ping-Hui Lin, for their endless love and support, which has reminded me that I am never alone
Abstract
Second-harmonic generation (SHG) nanoparticles show promise as imaging probes due to their coherent and stable signals with a broad flexibility in the choice of
excitation wavelength. In this thesis, barium titanate (BaTiO3) nanoparticles are
developed as “Second Harmonic Radiation IMaging Probes (SHRIMPs).” The thesis presents the fundamental study on the SHG from the nanoparticles, biochemical
functionalization of the nanoparticles, and also novel imaging systems using the SHG nanoparticles as imaging probes, including scan-free 3D imaging and imaging
through scattering medium.
We study the absolute SHG efficiency of single BaTiO3 nanoparticles both
theoretically and experimentally. The polarization-dependent SHG responses of
individual nanoparticles are studied in detail. From the measured polar response of a nanoparticle, we are able to find the orientation of the nanoparticle. We also examine
the SHG response of the nanoparticles under different excitation polarizations, including linearly and circularly polarized excitations.
Motivated by the stable SHG signal of the nanoparticle with high contrast in
biological cellular environment, we develop BaTiO3 nanoparticles as long-term cell
imaging probes. The BaTiO3 nanoparticles are surface functionalized with primary
amine groups for stable colloidal dispersion and also for further bio-molecule conjugation. We observe no toxicity of the functionalized nanoparticles to biological cells. To achieve specific labeling of proteins of interest, we couple antibodies
The coherent SHG signal radiated from the nanoparticles offers opportunities for
new imaging techniques. Using interferometric detection, namely harmonic holography (H2), both amplitude and phase of the SHG field at a two-dimensional (2D) digital camera can be captured. Through digital beam propagation, three-dimensional
(3D) SHG field distribution, reflecting 3D distribution of nanoparticles, can be reconstructed. Therefore, a 3D imaging of nanoparticles can be achieved without
scanning. We demonstrate the scan-free 3D imaging of nanoparticles in biological cells by the H2 microscope with sub-micron spatial resolution.
Moreover, we exploit the coherent SHG signal for imaging through scattering
media by performing optical phase conjugation (OPC) of the SHG signal. We demonstrate an all-digital OPC of the SHG signal originated from a nanoparticle by
combining H2 and dynamic computer-generated holography using a spatial light modulator. The phase-conjugated SHG scattered field retraces the scattering trajectory and allows us to create a clean focus on the nanoparticle placed inside a scattering
medium. The nanoparticle acts as a beacon of light; it helps us find the tailored wavefront for concentrating light at the nanoparticle inside the scattering medium.
When the scattering medium is thin, imaging through scattering media can be achieved by raster-scanning the phase-conjugated focus in the vicinity of the nanoparticle without losing the locality of the focus. We build a phase conjugate
scanning microscope to demonstrate imaging through a thin diffusive screen by using SHG beacon nanoparticles, in which a clear image of a target placed behind a ground
Table of contents
Acknowledgements iv
Abstract vi
Table of contents viii
List of figures x
Chapter 1 Introduction...1
1.1 Second-harmonic generation (SHG) imaging ... 3
1.2 SHG scattering from nanoparticles ... 6
1.3 Outline of the thesis ... 8
Chapter 2 Material and optical characterization of SHG nanoparticles ...11
2.1 Barium titanate (BaTiO3) nanoparticles ... 11
2.2 Optical characterization of SHG signal from individual BaTiO3 nanoparticles ... 14
2.3 Polarization-dependent SHG response from BaTiO3 nanoparticles ... 20
2.3.1 Theory for plane-wave excitation ... 20
2.3.2 Theory for tightly focused excitation ... 25
2.3.3 Measurements of SHG polar response of the nanoparticles ... 30
2.4 Linearly and circularly polarized excitations ... 36
Chapter 3 Cellular imaging with SHG nanoparticles ...46
3.1 Cytocompatibility of BaTiO3 nanoparticles ... 46
3.2 Nonspecific cell labeling by endocytosis ... 49
3.3 Surface functionalization and antibody conjugation of the nanoparticles . 52 3.3.1 Materials ... 52
3.4 Specific labeling in an antibody microarray ... 56
3.5 Specific cell membrane protein labeling via immunostaining ... 60
Chapter 4 3D imaging of SHG nanoparticles ...63
4.1 SHG 3D scanning microscopy ... 63
4.1.1 In vitro cell imaging ... 64
4.1.2 In vivo mouse imaging ... 66
4.2 Scan-free 3D holographic microscopy ... 69
4.3 Off-axis and on-axis digital holography ... 72
4.4 Harmonic holographic (H2) microscopy ... 76
4.4.1 Experimental setup ... 76
4.4.2 Point spread function of the H2 microscope ... 78
4.4.3 Scan-free 3D imaging of SHG nanoparticles ... 80
Chapter 5 Imaging through scattering media by digital phase conjugation ...85
5.1 Overview of imaging through scattering media ... 85
5.2 Concentrating light on nanoparticles behind scattering layers ... 90
5.2.1 Sample preparation and experimental setup ... 91
5.2.2 Results and discussion ... 95
5.3 Imaging through scattering layers by using SHG beacon nanoparticles .. 100
5.3.1 Concepts ... 100
5.3.2 Experimental details ... 102
5.3.3 Results and discussion ... 106
Chapter 6 Conclusions and future extensions ...114
Bibliography ...119
List of figures
Fig. 1-1 Schematic diagram of SHG (scattering) from a spherical nanoparticle ... 7
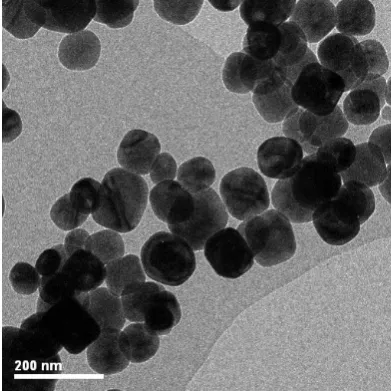
Fig. 2-1 Bright-field TEM image of BaTiO3 nanoparticles ... 12
Fig. 2-2 SEM image of BaTiO3 nanoparticles ... 12
Fig. 2-3 (a) Zeta potential of BaTiO3 nanoparticles colloidal suspension as a
function of the pH of the solution. (b) Size distribution of the BaTiO3
nanoparticles colloidal suspension measured by dynamic light scattering ...13
Fig. 2-4 Schematic diagram of the SHG wide-field microscope for SHG signal characterization. /2: half-wave plate, L1: 5 cm lens, OBJ: microscope objective, L2: 20 cm lens. The red beam shows the excitation at 800 nm, while the blue illustrate the SHG signal radiated from the nanoparticles under excitation. ... 15
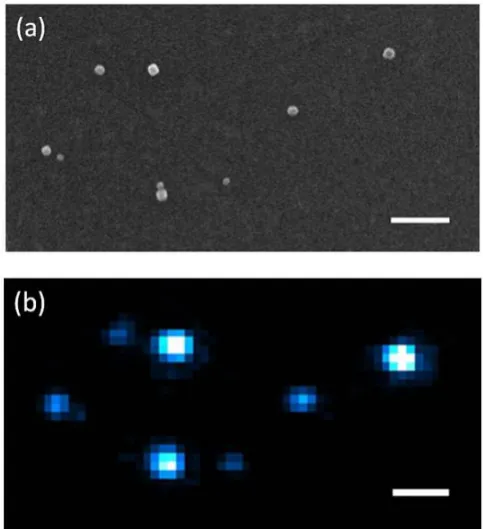
Fig. 2-5 (a) SEM image of BaTiO3 nanoparticles. (b) Wide-field SHG
microscopic image of the corresponding BaTiO3 nanoparticles.
One-to-one correspondence can be seen between (a) and (b). The scale bars are 500 nm. ... 16
Fig. 2-6 Power dependence of the SHG signal from BaTiO3 nanoparticles in
double logarithmic scale. The squares are measured results and the solid line is the linear fit with the slope of 2.2. The inset shows the SHG optical spectrum centered at 400.6 nm with a full-width half-maximum of 5 nm. ... 16
Fig. 2-7 Long-term imaging with SHG nanoparticles. (a) Wide-field SHG image of an isolated BaTiO3 nanoparticle. The size of the image is 15 μ 15
m2. (b) The time-lapse SHG signal of the nanoparticle under 5 hour continuous excitation. The dots represent experimental measurements and the line shows the average of the signal. The signal intensity remains unchanged after the emission of > 109 photons. ... 18
Fig. 2-8 Schematic diagram of a BaTiO3 nanoparticle oriented at an arbitrary
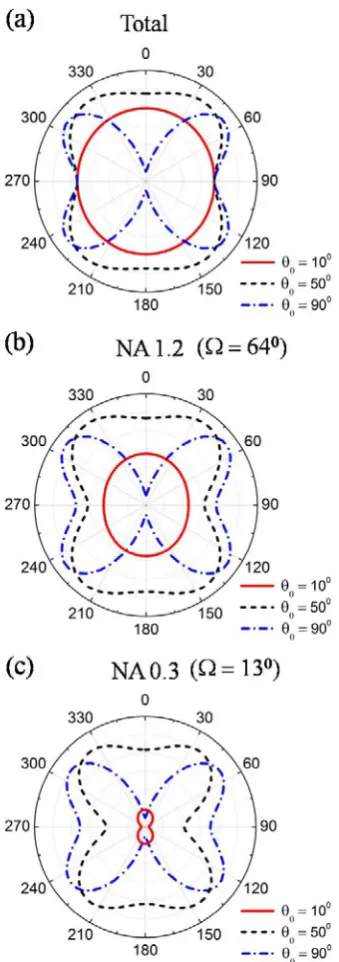
Fig. 2-9 Theoretical calculation of polarization-dependent SHG response of a BaTiO3 nanoparticle under a plane-wave excitation. (a) The
polarization dependency of the total SHG response of a BaTiO3
nanoparticle. (b)(c) The polarization dependency of the SHG response of a BaTiO3 nanoparticle where the SHG signal is collected by a (b)
NA 1.2 water-immersion objective and (c) NA 0.3 water-immersion objective ... 23
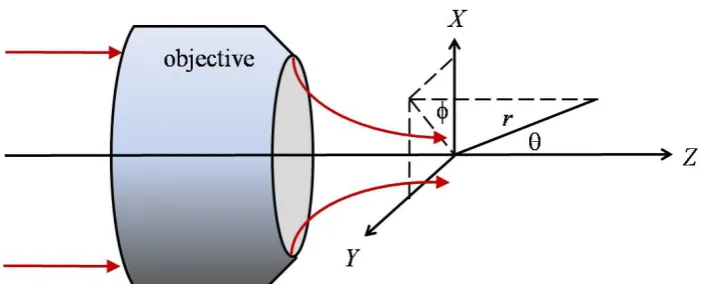
Fig. 2-10 Schematic diagram of a tightly focused excitation by using a microscopic objective. ... 26
Fig. 2-11 Theoretical calculation of the tightly focused LP (X-polarized) excitation. The magnitude (a)–(c) and the phase (d)–(f) of the electric field of X-, Y-, Z-polarizations at the focused beam waist (Z = 0). The incidence is an X-polarized plane-wave of 812 nm wavelength which is focused by a NA 1.2 water-immersion objective in an index-matching environment. The size of the images are 6 μ 6 m2. ... 27
Fig. 2-12 Theoretical calculation of the polarization-dependent SHG response of a BaTiO3 nanoparticle in a scanning image with a tightly focused
excitation (NA 1.2 water-immersion objective). (a) The polarization dependency of the total SHG response of a BaTiO3 nanoparticle. (b) (c)
The polarization dependency of the SHG response of a BaTiO3
nanoparticle where the SHG signal is collected by a (b) NA 1.2 water-immersion objective and (c) NA 0.3 water-water-immersion objective ... 29
Fig. 2-13 SEM image of isolated BaTiO3 nanoparticles randomly deposited on an
ITO coated glass substrate for SHG polarization measurement ... 30
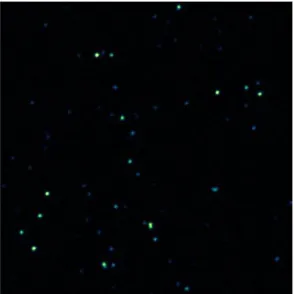
Fig. 2-14 Scanning confocal SHG image of BaTiO3 nanoparticles on an ITO
coated glass substrate. The size of the image is 30 μ 30 m2. ... 31
Fig. 2-15 Scanning confocal SHG images of BaTiO3 nanoparticles under
different LP excitation orientations. From (a)–(d), the excitation polarizations were 20, 40, 60, and 80 degrees, respectively, as indicated in the individual figures. The size of the images is 3 μ 3 m2. ... 32
scanning confocal microscope. The orientation of the nanoparticle in the calculation is at = 0 degrees. ... 33
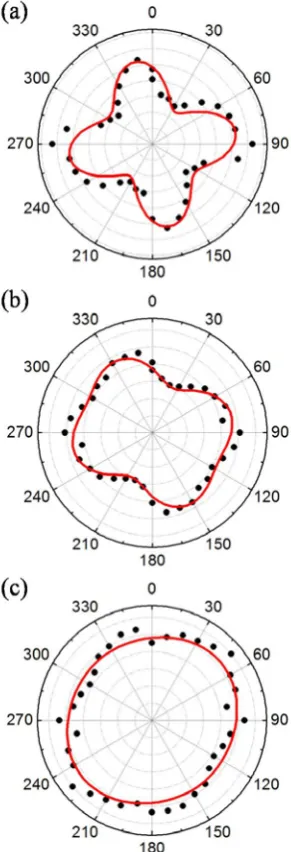
Fig. 2-17 (a)–(c) Polarization-dependent SHG response of three representative BaTiO3 nanoparticles measured by a scanning confocal microscope.
The experimental data are shown as black dots and the theoretical fits are shown as red curves. The three nanoparticles were found oriented at ( = 70 ± 5degrees, = 35 ± 5 degrees), ( = 50 ± 5degrees, = 115 ± 5 degrees), and ( = 10 ± 5 degrees, = 50 ± 5 degrees), respectively. The 10 degree resolution of the fitting is due to the accuracy of the measurement. ... 35
Fig. 2-18 Theoretical calculation of the normalized SHG response of a BaTiO3
nanoparticle as a function of nanoparticle orientation under a CP plane-wave excitation. Different detection schemes are considered: total SHG response (black solid curve), collected by an NA 1.2 water-immersion objective (red dash curve), and collected by an NA 0.3 water-immersion objective (blue dash-dot curve). ... 37
Fig. 2-19 Theoretical calculation of the normalized SHG response of a BaTiO3
nanoparticle as a function of nanoparticle orientation under a rotating LP plane-wave excitation. Different detection schemes are considered: total SHG response (black solid curve), collected by an NA 1.2 water-immersion objective (red dash curve), and collected by an NA 0.3 water-immersion objective (blue dash-dot curve). ... 39
Fig. 2-20 Theoretical calculation of the normalized SHG response of a BaTiO3
nanoparticle as a function of nanoparticle orientation under a CP tightly focused excitation. Different detection schemes are considered: total SHG response (black solid curve), collected by an NA 1.2 water-immersion objective (red dash curve), and collected by an NA 0.3 water-immersion objective (blue dash-dot curve). ... 40
Fig. 2-21 Theoretical calculation of the normalized SHG response of a BaTiO3
1.2 water-immersion objective (red dash curve), and collected by an NA 0.3 water-immersion objective (blue dash-dot curve). ... 41
Fig. 2-22 Relative SHG response of 39 BaTiO3 nanoparticles under tightly
focused CP and rotating LP excitations correlated to the nanoparticle orientations. The red solid curve is the theoretical calculation considering a tightly focused excitation, while the blue dots are the experimental results. ... 44
Fig. 2-23 Evaluation of the ellipticity effect in the excitation polarization on the relative SHG response of BaTiO3 nanoparticles under CP and LP
tightly focused excitations correlated to the nanoparticle orientations. The black/red curve is the theoretical calculation considering with/without ellipticity in the excitation introduced by the system, while the blue dots are the experimental results. ... 45
Fig. 3-1 Surface functionalization of BaTiO3 nanoparticles with amino-silanes
for stable water-soluble colloidal suspension ... 48
Fig. 3-2 Cell viability measurement after incubating the HeLa cells with different concentrations of the BaTiO3 nanoparticles for 24 hours. The
results have been normalized to the control experiment. ... 49
Fig. 3-3 Scanning confocal section images of the BaTiO3 nanoparticles inside
the myeloid cells via endocytosis. (a) Transmission channel. (b) SHG channel. (c) Merge image of (a) and (b). The size of the images is 130
μ 130 m2. ... 51
Fig. 3-4 Scheme of covalent bioconjugation of IgG antibody onto the surface of BaTiO3 nanoparticle for specific labeling imaging application ... 55
Fig. 3-5 The fluorescent microscopic image of the primary-antibody microarray labeled by the secondary antibody-Cy5 ... 57
observed at the locations of the target primary antibodies, showing a highly specific labeling of the 2nd-Ab-SHRIMPs. ... 59
Fig. 3-7 Quantitative analysis of Fig. 3-6. The ratio of the number of SHRIMPs presenting at the four samples was 1: 0.03: 0.03: 0.05 (Mouse IgG: Goat IgG: Rabbit IgG: Buffer Solution), measured from the integrated SHG intensity. The error bar shows the standard deviation of the four spots of each sample. ... 59
Fig. 3-8 Confocal section images of HeLa cells labeled with the 2nd-Ab-SHRIMPs. (a)–(d) The cells were first labeled with the primary antibody specific to the HLA class I molecules present on the cell membrane and then labeled with the 2nd-Ab-SHRIMPs; (e)–(h) The control sample where the cells were not labeled with primary antibody but under otherwise identical conditions; SHG images are shown in green in (a) and (e); two-photon fluorescence images are shown in red in (b) and (f); transmission images are shown in (c) and (g); and the merged images of SHG images and fluorescence images are shown in (d) and (h). The size of the images is 105×105 m2. ... 62
Fig. 4-1 Confocal section series of a calcein-stained HeLa cell (in red) with SHG nanoparticles (in green) inside it at successive depths (indicated below the images), from the top to the bottom of the cell. The size of the images is 30 μ 30 m2. ... 65
Fig. 4-2 Confocal section images of a calcein-stained HeLa cell (in red) with SHG nanoparticles (in green) inside it. 3D localization of the nanoparticles inside the cell is clearly observed. The scale bar is 5 m. .... 66
Fig. 4-3 In vivo SHG imaging of the nanoparticles in a living mouse tail. (a) The photograph of the experimental scenario. (b) The SHG section image (XY plane) at 100 m deep in the mouse tail where two isolated nanoparticles can be seen. (c) The SHG cross-section image (XZ plane) of the sample along the dashed line in (b), in which both the endogenous SHG from the muscles on the surface of the tail and also the two nanoparticles inside the tail are clearly observed ... 68
Fig. 4-4 Off-axis holographic imaging system ... 72
Fig. 4-6 H2 microscope experimental setup. BS1 and BS2, beam splitters; M, mirror; L1 and L2, lens; S, sample; OBJ, microscope objective; BE, beam expander; F, band-pass filter centered at 400 nm. BS1 splits the laser into signal and reference beams. In the signal arm, L1 slightly focuses the excitation beam into the sample with nanoparticles. OBJ and L2 form a 4F imaging system to collect and optically magnify the SHG image. The EMCCD is placed away from the 4F imaging plane. Bandpass filters are placed in front of the EMCCD to remove the excitation from the SHG signal. The reference beam goes through a motorized delay stage and a BBO crystal so that the coherent reference SHG laser pulses are generated and can be temporally and spatially overlapped with the signal on the EMCCD. The signal and reference beams are combined collinearly by BS2 and therefore an on-axis digital hologram is recorded on the EMCCD. ... 77
Fig. 4-7 Section and cross-section SHG images of two isolated BaTiO3
nanoparticles, reconstructed from a single on-axis digital hologram. Sub-micron 3D localization of the SHG nanoparticle is achieved. The bar in the image is 1 m. ... 78
Fig. 4-8 Optical successive section images of an isolated BaTiO3 nanoparticle at
different depths (indicated in the figures), reconstructed from a single on-axis digital hologram. The size of the images is 1.5 μ 1.5 m2. ... 79
Fig. 4-9 Images of SHG nanoparticles embedded in PDMS. (a)–(d): SHG images of the nanoparticles on four different planes, focusing by moving the optics with a conventional microscope. (e)–(h): Holographic reconstructed images of the corresponding nanoparticles, focusing by digital reconstruction. The relative depths of these four planes are 0, 9.4, 17.2, and 20.3 m, respectively. Scale bars are 2 m. .... 81
different planes with relative depths of 0 m, 3.12 m, and 6.24 m, respectively. The white arrows show the nanoparticles that are in focus, while the gray arrows show the nanoparticles that are out of focus. The group labeled with number 4 is a big cluster so that it is bright both in (b) and (c). (e) Normalized intensity line profiles of the six nanoparticles when they are on focus through digital reconstruction. The scale bars are 5 m. ... 84
Fig. 5-1 Schematic diagram of projecting an image through a scattering medium by wavefront optimization ... 87
Fig. 5-2 Schematic diagram of projecting an image through a scattering medium by phase conjugation ... 89
Fig. 5-3 The schematic diagram of the sample structure ... 92
Fig. 5-4 Digital phase conjugation experimental setup. /2, half wave plate; PBS, polarization beam splitter; M, mirror; DI, dichroic mirror; L1–L4, lens; OBJ1 and OBJ2, microscope objectives; S, sample; BS1–BS3, non-polarizing beam splitters; BF, band-pass filter centered at 400 nm. The laser power for excitation and phase conjugation can be controlled by the /2 and the PBS. A translation stage was used to overlap the signal and the reference pulses temporally for the H2 microscopy. Band-pass filters are placed in front of the CCD cameras to remove the excitation from the SHG signal. ... 94
Fig. 5-5 Digital phase conjugation through a clear medium. (a) The epi-SHG image of the nanoparticle under excitation. (b) The conjugated phase pattern of the recorded SHG field emitted from the nanoparticle, showing a Fresnel zone plate. (c) The phase-conjugated focus formed at the sample by using the Fresnel zone plate shown in (b). The FWHM of the bright spots in (a) and (c) is 1.95 m. The scale bars in the figures are 5 m. ... 96
conjugation. No focus is observed. Note that (b) and (c) are measured with the same power of the phase-conjugated beams and they are normalized by the same factor in the image processing. The scale bars in the figures are 5 m. ... 97
Fig. 5-7 Comparison of the measured diffraction limited focus and the phase-conjugated focus. Black: the normalized intensity profile of the diffraction limited focus; red: the normalized intensity profile of the phase-conjugated focus. The FWHMs of the diffraction limited focus and the phase-conjugated focus are 1.95 m and 2.3 m, respectively. ... 97
Fig. 5-8 Two steps of imaging through turbid media in a phase conjugate scanning microscopy. (a) Recording the scattered SHG field radiated from a nanoparticle by digital holography. (b) Scanning the phase-conjugated focus on the imaging plane by illuminating the same region of the turbid medium (shown as the red circular region) with the phase-conjugated beam at different angles ... 101
Fig. 5-9 (a) The experimental setup of the harmonic holographic microscopy for recording the complex scattered SHG field. Inset: The illustrative diagram of the sample structure. (b) The experimental setup of the phase conjugate scanning microscope. Note that (a) and (b) show the same setup with different light illuminations for different steps of the experiment. The light not in use is blocked in the experiment and is not shown in the figures. DI, dichroic mirror; L1–L4, lens; OBJ1 and OBJ2, microscope objectives; S, sample; BS1–BS3, non-polarizing beam splitters; BF, band-pass filter centered at 400 nm; M, mirror ... 103
between the tilt and the shift of the SLM for the scanning are in the main text. ... 105
Fig. 5-11 Focusing through the turbid medium without and with phase conjugation. (a) The speckle pattern on the image plane when focusing directly through the turbid medium by the objective without phase conjugation. (b) The conjugated phase pattern projected on the SLM for phase conjugation. The grayscale from black to white represents the phase modulation from 0 to 2. (c) The phase-conjugated focus on the image plane. The inset shows the magnified image of the focus. The scale bar in the inset is 5 m. The size of the images in (a) and (c) is 195 μ195 m2. ... 107
Fig. 5-12 Angular response of the tilted phase-conjugated focus. Note that the tilt angle in this figure is the tilt angle at the sample position. The experimental data is shown as black dots and the fitting based on the theory of optical memory effect is shown as the red line. ... 108
Fig. 5-13 (a) The wide-field transmission image of the target. The target is a 130 nm thick gold pattern on a glass substrate prepared by photolithography. The bright region in this figure indicates the transparent area while the dark region indicates the gold film. (b) The corresponding phase conjugate scanning image of the target. The target is clearly resolved. The intensity profile along the dashed line is plotted in Fig. 5-14. (c) The scanning image of the same target without phase conjugation. Since the focus is severely distorted by the turbid medium, the image is completely blurry. The size of the images are 140 μ 140 m2. ... 111
Chapter 1 Introduction
Light has been an important tool in studying science. Through light-matter interactions, such as scattering, reflection, refraction, absorption, and photoemission,
the propagating light field carries the information of the object under study, which allows us to observe it at a distance. Light introduces minimal perturbation during the observation and it readily propagates in free space. Therefore, light is extremely
useful and convenient for sensitive detections. Technological advances in light sources, optical filters, computer hardware, and photon-counting detectors have been
extensively employed in optical imaging systems. Extremely sensitive imaging systems have been demonstrated [1–5], which allows us to quantitatively analyze the chemical reactions on the single-molecule level [1, 2].
Every imaging system needs a contrast mechanism. One of the most efficient methods of creating a contrast in an imaging system is to change the color of the
signal away from the color of illumination. By using optical filters, one can efficiently reject the illuminating wavelength and allow only signal wavelength to arrive at the detector. Photoluminescence is the most widely used mechanism for wavelength
conversion in imaging. In particular, fluorescent imaging probes are especially popular in the study of biology due to their satisfactory brightness, biocompatibility,
and small physical size [1–7]. Fluorescent proteins can be encoded into genes and introduced into living cells, and the cells will produce these fluorescent proteins when expressing the gene, which is convenient in biological studies [1, 5, 8]. Besides
photons simultaneously, resulting in the two-photon fluorescence [7, 9, 10]. Besides
fluorescence, phosphorescence and upconversion have also been demonstrated as wavelength conversion mechanism for imaging [11–14].
Photobleaching may be the major problem of fluorescent probes [15, 16].
Photobleaching is an irreversible photochemical degradation of a fluorescent probe, leading to the permanent loss of the fluorescent signal. This is especially problematic
in long-term time-lapse measurement. Besides photobleaching, fluorescent intermittency or “blinking” is another potential problem of fluorescent probes, which is due to the stochastic switching between bright and dark states of the probe [17, 18].
Many efforts have been made to develop more robust and more stable fluorescent probes. Semiconductor quantum dots have been shown to be much more resistant to
photobleaching and also less prone to blinking [19, 20]. Fluorescent diamond nanocrystals with nitrogen-vacancy defects also show a stable signal resistant to photobleaching [21, 22].
The challenges of imaging with photoluminescent signal can be solved by nonlinear optical (NLO) processes which are also known for wavelength conversion.
In NLO processes, the light-induced polarization of the material responds nonlinearly to the electric field of the excitation light, leading to radiations at harmonic optical frequencies [23]. Since the NLO processes do not involve any real-state transition, so
the problems of photobleaching and blinking are circumvented [23]. Among all the NLO processes, second-order nonlinearity, such as second-harmonic generation
1.1
Second-harmonic generation (SHG) imaging
SHG microscopy has been developed as a standard nonlinear microscopy since the 1970s [24, 25]. The excitation wavelength is usually in NIR and the SHG signal is at exactly half the excitation wavelength, which is in the visible spectrum. Such a SHG
scanning microscope is compatible with two-photon fluorescence scanning microscopy [26, 27]. The quadratic dependency of the signal to the excitation power
provides the optical sectioning capability in the axial direction, which is appealing to three-dimensional (3D) scanning imaging [28, 29]. The multi-photon microscopy is also ideal for deep tissue imaging because the scattering of the sample is less severe at
longer excitation wavelengths [28, 29]. SHG scanning microscopy has been used for examining endogenous structures in label-free biological samples [26, 30–32].
Ordered and highly polarizable biological structures, such as collagen [32], muscle [33], and microtubules [30] are efficient in SHG, and therefore they show high contrast in a mostly isotropic environment in SHG images. In biological samples, the
molecular structures and orientations determine the nonlinear susceptibility. As a result, the polarization-dependent measurement of the SHG signal can be used to
study the molecular structures of biological samples [32–35].
While the endogenous SHG signal is attractive for label-free non-invasive imaging, exogenous SHG markers are also desirable due to the flexibility of having
the SHG contrast from any target of interest. The development of SHG contrast agents began from organic dipolar molecular systems where the optical nonlinearity
the biological membrane, which satisfies the non-inversion symmetry requirement for
an efficient SHG process [39]. Interestingly, the SHG signal intensity of the dye molecule is sensitive to the local electric potential [31, 40], and it has been shown as a novel approach for high-resolution detection for dynamic electrical activity of neurons
[41].
In addition to SHG-active molecules, SHG studies of nanomaterials have become
a very active field very recently. Thanks to the advancement in nanotechnology and molecular chemistry, SHG has been observed from various types of nanomaterials, including metals [42–45], semiconductors [46–51], dielectric [52–57], and organic
nanomaterials [58–60]. Since SHG only takes place in a non-centrosymmetric environment under electric dipole approximation [23], nanomaterials of
centrosymmetric crystal structures are efficient in SHG. Nanomaterials of non-centrosymmetric crystal structures include BaTiO3 [56, 61–63], ZnO [48–51],
KTiOPO4 (KTP) [52, 54, 64], Fe(IO3)3 [55, 65], KNbO3 [57], etc. The size of these
nanomaterials ranges from 10–100 nm. As the SHG conversion efficiency of these nanomaterials is sufficiently high, these SHG nanomaterials have shown promise as
alternative imaging probes due to their non-bleaching and non-blinking signal [50, 61, 65, 66].
We refer to these SHG nanomaterials as “Second Harmonic Radiation IMaging
Probes (SHRIMPs).” It should be emphasized that, due to their unique optical properties, these SHG nanoprobes offer opportunities that are not available with
1. Stable: SHG does not involve any real-state transition, so the problems of
photobleaching and blinking are circumvented [23]. Such stable signal is ideal for dynamic and long-term imaging.
2. Tunable: SHG wavelength is exactly half of the excitation wavelength. Therefore,
SHG wavelength tuning can be done by tuning the excitation wavelength [57]. Moreover, SHG at nano-scale is a nonresonant process (without phase-matching
requirement), providing a broad flexibility of choosing the best excitation wavelength or the emission SHG wavelength.
3. Coherent: The virtual-state transitions of SHG processes lead to the coherence
between the signal and the excitation. As a result, SHG nanoprobes act as subwavelength coherent photon sources [57, 67, 68]. This is a great advantage,
allowing us to detect the complex SHG signal of the SHRIMPs by interferometric approaches [61, 64, 69, 70]. For example, the complex field information of the SHG signal offers opportunities for new imaging techniques, such as scan-free 3D
imaging [61, 69, 70] and imaging through turbid media by optical phase conjugation [67, 68].
4. Fast: As the excitation lifetime of common fluorescent probes is on the order of nanoseconds [71, 72], SHG response time is only limited by the bond electron response time, which is less than femtoseconds [23]. This means the SHG
emission is almost instantaneous to the excitation, allowing for ultrafast modulation and coherent control of the SHG signal.
offering a new degree of freedom for controlling and detecting the SHG signal
[32–35, 47, 52, 55, 56].
Motivated by the advantages of SHG imaging probes listed above, many efforts have been made toward developing SHG nanoparticles as bio-imaging probes recently.
By exploiting the flexibility in the selection of the excitation wavelength, SHG nanoparticles have also been demonstrated as deep tissue imaging probes [65].
Through surface functionalization and bioconjugation, specific labeling of the nanoparticles has been demonstrated [50, 62]. It has also been shown that SHG nanoparticles can be used for in vivo imaging [66].
1.2
SHG scattering from nanoparticles
The effective phenomena of SHG from nanoparticles can be seen as hyper-Rayleigh
scattering (HRS). HRS was first studied with molecules where the nonlinear optical signal comes from the optical hyperpolarizability of the molecules [73, 74]. SHG from nanoparticles is therefore very different from SHG in bulk materials where the
SHG is usually governed by phase matching condition [23]. The SHG scattering from a spherical nanoparticle is described schematically in Fig. 1-1. The excitation is a
plane wave at fundamental frequency and the induced SHG fields scatter in all
directions. The SHG scattering from nanoparticles can be studied from calculating the linear scattering of the excitation field at fundamental frequency within and around
the nanoparticles. The excitation field then induces microscopic SHG sources (dipoles and multipoles) at the locations where the second-order susceptibility is nonzero. The SHG sources of the nanoparticles can be classified into surface and bulk contributions,
materials of the nanoparticle and the surrounding environment. The overall SHG
radiation of the nanoparticle is the coherent addition of the SHG fields radiated by each individual microscopic SHG dipole and multipole [75, 76].
Fig. 1-1 Schematic diagram of SHG (scattering) from a spherical nanoparticle
As was pointed out in the previous section, nanoparticles comprised of non-centrosymmetric and highly polarizable crystal structures are capable of efficient SHG. This is due to the strong second-order susceptibility within the volume of the
nanoparticles inducing strong SHG dipole sources within the nanoparticles. Such bulk contribution is referred to as the locally excited electric dipole contribution. For
nanoparticles of non-centrosymmetric crystal structure, such bulk nonlinearity usually dominates the SHG response [47, 48, 52, 55, 56, 59–61, 75]. For the application of imaging probes, nanoparticles of strong bulk nonlinearity are certainly desirable as it
leads to strong SHG conversion efficiency.
For nanoparticles of centrosymmetric material, the bulk contribution disappears
has been exploited to the study of interfaces properties between two centrosymmetric
materials [77–80]. Interestingly, this surface contribution vanishes when the shape of the nanoparticle is centrosymmetric, such as a perfect sphere. This is because the SHG sources at different parts of the surface of a sphere interfere with each other, and
the overall SHG radiation vanishes due to the symmetry of the problem. It is worth noting that any deviation in shape from centrosymmetry leads to a nonvanishing SHG
response [45, 81].
Following the above discussion, for a nanoparticle of centrosymmetric material and of perfect spherical shape, such as a gold spherical nanoparticle, the SHG sources
are from neither the bulk nor the surface under locally excited electric dipole approximation. Therefore, the SHG from such nanoparticles is weak. The SHG
response from those nanoparticles can be explained under multipole expansion [42, 43]. The leading-order SHG contributions are a nonlocal excited electric dipole moment and a local excited electric quadrupole moment. The former is treated as
surface contribution because it requires a nonlocal excitation mechanism where the phase variation of the excitation across the surface of the nanoparticle is considered.
The later is treated as bulk contribution through a local excitation mechanism.
1.3
Outline of the thesis
This thesis presents the development of BaTiO3 nanoparticles as SHG biological
imaging probes for novel imaging applications. It includes fundamental studies on SHG from nanoparticles, chemical treatments of nanoparticles for biological
Chapter 2 addresses the fundamental study of SHG in BaTiO3 nanoparticles. It
starts with material studies and SHG characterization of BaTiO3 nanoparticles. The
polarization-dependent SHG response of BaTiO3 nanoparticles are investigated both
experimentally and theoretically. From the SHG polar response of the nanoparticle,
we are able to retrieve the crystal orientation of the nanoparticle. The absolute SHG conversion efficiency of the BaTiO3 nanoparticle is also studied on
single-nanoparticle level. We also explore the possible excitation geometries and polarizations for superior SHG response from the nanoparticles, including plane wave and tightly focused excitations of linear and circular polarizations.
Chapter 3 presents the biochemical development of BaTiO3 nanoparticles as
bio-imaging probes. Cytocompatibility of the nanoparticles is examined with biological
cells. Stable aqueous colloidal suspension of nanoparticles is prepared through surface functionalization with amine groups. We also demonstrate a bioconjugation scheme for covalently attaching antibodies onto the nanoparticles. The antibody nanoparticle
conjugates are able to label target proteins specifically. We demonstrate specific labeling in a protein microarray and also in cell membrane proteins.
Chapter 4 demonstrates 3D imaging capability of SHG nanoparticles, including the conventional scanning SHG microscope and the novel microscope system named “harmonic holographic microscopy.” In vitro 3D cell imaging and in vivo 3D animal imaging with SHG nanoparticles is demonstrated with a scanning microscope. Then, the advantages of holography in 3D imaging are discussed. Holographic imaging
Chapter 5 shows the use of SHG nanoparticles as beacons of light for focusing
and imaging through turbid media. This work aims to solve the challenges of imaging and light delivery in biological tissue due to scattering. We demonstrate an all-digital optical phase conjugation system. By performing phase conjugation of the SHG field
originated from the nanoparticles, we show that light can be delivered through a scattering medium and focus onto the nanoparticles. We also demonstrate imaging
through a thin diffusive medium by scanning the phase-conjugated focus in the vicinity of the nanoparticle.
Chapter 6 summarizes the thesis and discusses the future extension of SHG
nanoparticles for imaging.
Chapter 2 Material and optical
characterization of SHG nanoparticles
It is essential to understand the SHG mechanism in nanoparticles in order to use them
as imaging probes. In this chapter, the SHG from BaTiO3 nanoparticles will be
discussed in detail. It includes the theoretical calculations and also experimental
characterizations. The chapter starts with the material studies on BaTiO3 nanoparticles.
Sample preparation and basic optical characterization on SHG signal will then be presented. After that, the polarization-dependent SHG response from nanoparticles
under various excitations will be studied. Overall, the scope of this chapter is to understand explicitly the SHG from nanoparticles for using them as imaging probes in
microscopy.
2.1
Barium titanate (BaTiO
3) nanoparticles
BaTiO3 nanoparticles in dry powder were commercially available from TechPowder
(TechPowder S.A. Lausanne, Switzerland) and NanoAmor (Nanostructured &
Amorphous Materials, Inc. Houston, TX, USA). X-ray diffraction data from the
supplier confirms that the crystal structure is tetragonal, which is
non-centrosymmetric, allowing for efficient SHG without any further treatment. A
bright-field transmission electron microscope (TEM) image of BaTiO3 nanoparticles is
shown in Fig. 2-1, and a scanning electron microscope (SEM) image of the
nanoparticles is shown in Fig. 2-2. The nanoparticles are nearly spherical in shape and
Fig. 2-1Bright-field TEM image of BaTiO3 nanoparticles
[image:30.595.218.414.72.268.2]
Fig. 2-2 SEM image of BaTiO3 nanoparticles
For the use of nanoparticles in imaging applications, stable colloidal suspension of the nanoparticles is often preferred in order to avoid cluster aggregation. To stabilize
the BaTiO3 nanoparticles in colloidal suspension, we dispersed the dry powder in 1.25
mM aminomethylphosphonic acid with the particle concentration of 1010 particles/mL. We treated the colloidal suspension with ultrasound (Branson digital sonifier 450) for
10 minutes to break the clusters into individual particles. The suspension was then stirred for 24 hours. The phosphonic acid was adsorbed on the particle surface and
by electrostatic force from the ionization of the amine group in solution. Finally, we
filtered out the big clusters from the suspension by flowing it through a membrane
with pore size of 0.22 m (Millipore Express PLUS). The surface charge of the
stabilized particle was determined by the degree of ionization of the amine groups on
the particle, which can be tuned by changing the pH of the solution. The zeta potential (i.e., the electrokinetic potential difference between the dispersion medium and the stationary layer of fluid attached to the dispersed nanoparticle) of the monodispersed
colloidal suspension was obtained by light scattering measurement (Brookhaven Instruments Corp. ZetaPALS). We observed that the zeta potential decreases from 10
mV to -40 mV when the pH of the solution increases from 2 to 9, as shown in Fig. 2-3 (a). The pH tuning was done by adding HNO3 and KOH. We also measured the
nanoparticle size distribution in suspension by dynamic light scattering (Brookhaven
Instruments Corp. 90Plus) showing that most of the particles were well dispersed, while less than 10% of the particles were clusters of double the size (Fig. 2-3 (b)).
With the stable colloidal suspension, it was now possible to prepare samples of individual nanoparticles for optical characterization.
Fig. 2-3 (a) Zeta potential of BaTiO3 nanoparticles colloidal suspension as a function
2.2 Optical
characterization of SHG signal from
individual BaTiO
3nanoparticles
We prepared isolated individual nanoparticles on an indium-tin-oxide (ITO) coated glass substrate for SHG characterization. The ITO-coated glass substrate is
conductive which allowed us to image the nanoparticles by electron microscope. The ITO-coated glass substrate is also transparent, and therefore it is available for
transmission optical measurement. We first imaged the sample by a SEM. With the help of the marks on the substrate, we imaged the same area with a SHG wide-field microscope shown in Fig. 2-4. For optical characterizations, the nanoparticles were
embedded into index-matching oil, sandwiched between the ITO-coated glass and a cover glass. The excitation was a linearly polarized Ti:sapphire oscillator (150 fs
pulse duration centered at 800 nm wavelength with a 76 MHz repetition rate). The
excitation polarization can be controlled by a half-wave plate (/2 in Fig. 2-4). The
laser beam was slightly focused by a lens of 5 cm focal length (L1 in Fig. 2-4) to
reach the peak intensity of 1 GW/cm2 on the sample. The SHG signal was collected by a 100X 1.4 numerical aperture (NA) oil-immersion objective (UPLSAPO 100XO, Olympus) in the forward direction and imaged directly on an electron multiplying
charge coupled device (EMCCD, Andor iXonEM+ 885) with a lens of 20 cm focal length (L2 in Fig. 2-4). The excitation was removed by using narrow band-pass filters centered at 400 nm.
The SEM image of BaTiO3 nanoparticles randomly deposited on ITO-coated glass
is shown in Fig. 2-5 (a). The nanoparticles are well isolated and good for optical
2-5 (a) and (b). The spatial resolution in Fig. 2-5 (b) is limited by the diffraction of
light at the SHG wavelength. The average SHG photon flux generated from a 90 nm BaTiO3 nanoparticle is on the order of 105 photons/second under the peak excitation
intensity of 1 GW/cm2 (150 fs pulse width, 76 MHz repetition rate), which is sufficient for imaging applications. The SHG intensity of individual nanoparticles is different due to the varying sizes and nanoparticle orientations. The
polarization-dependent SHG response will be discussed in the next section. To confirm the signal observed on the EMCCD was indeed SHG, we measured the power dependency and optical spectrum of the signal. In the power dependency measurement, we changed
the excitation (pump) peak intensity from 0.1 to 4 GW/cm2, and we captured one SHG image for each excitation condition. The SHG signal was calculated from image,
and the relationship between the excitation intensity and the SHG signal is plotted in Fig. 2-6. The measured quadratic dependency indicates the signal is generated from a
second-order process. We further measured the optical spectrum of the signal, which showed a clean signal at SHG wavelength at 400 nm (as shown in the inset of Fig.
2-6).
Fig. 2-4 Schematic diagram of the SHG wide-field microscope for SHG signal characterization. /2: half-wave plate, L1: 5 cm lens, OBJ: microscope objective, L2: 20 cm lens. The red beam shows the excitation at 800 nm, while the blue illustrate the SHG signal radiated from the nanoparticles under excitation.
Fig. 2-5 (a) SEM image of BaTiO3 nanoparticles. (b) Wide-field SHG microscopic
image of the corresponding BaTiO3 nanoparticles. One-to-one correspondence can be
[image:34.595.197.439.72.337.2]seen between (a) and (b). The scale bars are 500 nm.
Fig. 2-6 Power dependence of the SHG signal from BaTiO3 nanoparticles in double
logarithmic scale. The squares are measured results and the solid line is the linear fit with the slope of 2.2. The inset shows the SHG optical spectrum centered at 400.6 nm with a full-width half-maximum of 5 nm.
[image:34.595.159.453.422.633.2]Next, we verified the stability of the SHG signal radiated from BaTiO3
nanoparticles. The SHG process is lack of real-state transition, so a stable SHG signal is expected. Such stable signal makes SHG nanoparticles promising as long-term imaging probes. We used a similar SHG wide-field microscope as shown in Fig. 2-4
for stability measurement. The excitation laser beam of 258 mW average power was
slightly focused by a lens down to an excitation area of 100 m in diameter. The peak
excitation intensity was 6.85μ107 W/cm2. The SHG signal was collected by a 20X 0.42 NA long working distance objective (Edmund Optics, NT46-145) in the forward direction and imaged directly on the EMCCD with a lens of 30 cm focal length. The
excitation was removed by using narrow band-pass filters centered at 400 nm. Fig. 2-7 (a) shows the wide-field SHG images of an isolated 300 nm diameter BaTiO3
nanoparticle. The acquisition time of the EMCCD was set to be 0.1 second with gain
of 30, and the SHG signal is sufficient for imaging. The total number of SHG photons arrived on the EMCCD was measured as 5.7μ104 photons/second. The stability measurement was performed by taking one SHG image of the nanoparticle every one minute for 5 hours under continuous excitation. The SHG signal was extracted from each image after background subtraction. The total collected SHG strength was
measured by integrating the SHG signal within the bright spot in the image. We plotted the SHG signal as a function of time in Fig. 2-7 (b) where the signal intensity
remains unchanged after 5 hour continuous excitation. The total emission SHG photon is estimated to be more than 109, showing that the SHG signal from the nanoparticle is extremely stable. The relative standard deviation of the signal is 5.23%
Fig. 2-7 Long-term imaging with SHG nanoparticles. (a) Wide-field SHG image of an isolated BaTiO3 nanoparticle. The size of the image is 15 μ 15 m2. (b) The
time-lapse SHG signal of the nanoparticle under 5 hour continuous excitation. The dots represent experimental measurements and the line shows the average of the signal. The signal intensity remains unchanged after the emission of > 109 photons.
To describe the brightness of BaTiO3nanoparticles more quantitatively, we define
the SHG cross section as follows:
. (2-1)
where is the total SHG radiated power from a nanoparticle, /2 is
the excitation intensity, and is the wave impedance of the medium. The concept of
SHG cross section is very similar to the two-photon fluorescent cross section, which has been widely used to describe the brightness of two-photon fluorescent markers.
nanoparticle simply describes how efficient a nanoparticle can scatter at the SHG
frequency under excitation at the fundamental frequency. On the other hand, two-photon fluorescence involves a two-two-photon absorption followed by a fluorescence
emission. As a result, the two-photon (action) cross section of two-photon
fluorescent markers is the product of the two-photon absorption cross section and the fluorescent quantum efficiency. Despite the differences in the two mechanisms, it is
very helpful to compare the SHG cross section with two-photon fluorescent
cross section σ P, especially when using SHG nanoparticles as imaging probes of
nonlinear microscopy. The unit of and σ P is Goeppert-Mayer (1 GM = 10-50 cm4 sec photon-1).
Based on equation (2-1), can be measured experimentally since both the
SHG radiation power and the excitation intensity are measurable. We have
measured the of a single 100 nm BaTiO3 nanoparticle to be on the order of 103
GM [63]. This experimental observation agrees well with our theory which will be
discussed shortly in the next section. Notice that has a sixth-order scaling rule on
the diameter of the nanoparticle, so the size effect on SHG efficiency is significant
[46]. As a reference, the of the commonly used fluorescent bio-markers are listed: ~ 104 GM for 5 nm quantum dots [7]; ~ 102 GM for fluorescent proteins [83] and organic dyes [84]. In general, the two-photon fluorescent efficiency depends strongly on the excitation wavelength due to the resonant absorption. In our laboratory, it has been demonstrated the SHG efficiency can be enhanced by 500 times by creating a
2.3
Polarization-dependent SHG response from BaTiO
3nanoparticles
In this section, the polarization-dependent SHG response from nanoparticles of noncentrosymmetric materials will be discussed in detail. It includes theoretical
calculations of SHG signal from nanoparticles under plane wave and tightly focused excitation. The plane wave excitation is for SHG wide-field microscopy, while the
tightly focused excitation is for SHG scanning microscopy. We use BaTiO3
nanoparticles as the example of our calculations, but the theory is valid for any nanoparticle of known bulk second-order nonlinearity. The section ends with
experimental observations which match well with the theoretical calculations.
2.3.1 Theory for plane-wave excitation
We start the study with a nanoparticle under a uniform linearly polarized (LP) excitation using BaTiO3 nanoparticles. The crystal structure of the BaTiO3
nanoparticle is tetragonal, which is uniaxial and belongs to symmetry class 4 [23].
Due to the crystal symmetry, the SHG response is determined only by the orientation
of the c-axis of the nanoparticle, and the rotation of the nanoparticle around the c-axis
has no influence on the SHG response. The orientation of an object in a
three-dimensional (3D) space can be defined by three Euler angles in an Euler coordinate.
To define the orientation of the c-axis in space, the degree of freedom is reduced to
two angles which can be described in a spherical coordinate. The orientation of the
c-axis of the nanoparticle can be uniquely defined by the angles and in the
spherical coordinate, as shown in Fig. 2-8. The incident excitation propagates along
the axis and the excitation polarization angle can be rotated in the plane by a
Fig. 2-8 Schematic diagram of a BaTiO3 nanoparticle oriented at an arbitrary direction
under a LP plane-wave excitation. The SHG signal is collected by a microscope objective.
Assuming the shape of the nanoparticle is spherical and the size is small compared with the wavelength of excitation, the nanoparticle can be considered as a Rayleigh
particle [85]. By further ignoring the material birefringence, the electric field inside
the nanoparticle can be found to be in-phase and uniform as
3 ⁄ 2 [85] , where is the incident
electric field in the surrounding medium in the absence of the particle, and and
are the linear permittivities of the particle and the surrounding medium, respectively.
The electric field at the fundamental frequency is then decomposed into three
orthogonal components along the three axes in the crystal frame, i.e.,
where , , and are unit vectors in the crystal
frame as shown in Fig. 2-8. The SHG polarizations along the three crystal axes are
0
0 00 00 0 0 00
00 0 2
2 2
, (2-2)
where is the second-order susceptibility tensor of the bulk BaTiO3 crystal. The
values we used in the simulation are = -41×10-9 esu, = -43×10-9 esu, and
= -16×10-9 esu [23].
Because of the subwavelength particle size, the electrostatic approximation holds,
and the induced SHG polarizations are uniform inside the particle. By assuming also
that the size of the particle is much smaller than the SHG wavelength, the SHG
polarizations within the particle can be regarded as three orthogonal SHG dipoles with
the amplitudes proportional to the strengths of the polarizations. These three
orthogonal SHG dipole moments radiate like antennas at the SHG frequency. The
total SHG radiation power can be found as [86]
, (2-3)
where is the speed of light, is the wave number at the SHG frequency, is the
volume of the nanoparticle, and is the vacuum permittivity. Following equations
(2-2) and (2-3), one can find that the total SHG power radiated from these three
orthogonal dipoles is dependent on the orientation of the nanoparticle and the
excitation polarization. Without losing generality, we assume that the c-axis of the nanoparticle is oriented at = 0 degrees in the following theoretical calculation. In
Fig. 2-9 (a), we calculate and plot the total SHG power radiated by these three
axis as shown in Fig. 2-8) when the nanoparticle is orientated at = 10, 50, and 90 degrees.
Fig. 2-9 Theoretical calculation of polarization-dependent SHG response of a BaTiO3
nanoparticle under a plane-wave excitation. (a) The polarization dependency of the total SHG response of a BaTiO3 nanoparticle. (b)(c) The polarization dependency of
the SHG response of a BaTiO3 nanoparticle where the SHG signal is collected by a (b)
In nonlinear microscopy, the SHG signal is usually collected by a microscope
objective. Since the SHG radiation is generally not a simple spherical wave, we
further consider the collection efficiency provided by the objective to obtain an
accurate estimation of the polarization-dependent SHG response of a nanoparticle.
The collection efficiency is determined by the overall far-field SHG intensity
radiation pattern of the three orthogonal dipoles within the cone angle introduced by
the objective. To calculate the collection efficiency, the three orthogonal dipoles are
first projected back into the lab frame, namely ,
where , , and are unit vectors in the lab frame. Each of the three new defined
SHG dipoles radiates SHG field in the form of dipole radiation pattern [86]. Therefore,
the SHG electric field radiation pattern in spherical coordinates can be related to
as: 0 cos cos sin 0 cos sin cos 0 sin 0 , (2-4)
where , , and are the unit vectors in the spherical coordinate of the lab frame.
The collection efficiency can be easily found as the ratio of the SHG field intensity
within the cone angle of the objective (0 Ω, 0 2 ) over the total SHG
field intensity:
Ω
. (2-5)
It is worth noting that is a function of the cone angle Ω, the nanoparticle
orientation, and the excitation polarization. We consider two cases where the SHG
signal is collected by a high NA microscope objective (NA 1.2 water-immersion, Ω =
64.46 degrees) and a low NA microscope objective (NA 0.3 water-immersion, Ω =
detected polarization-dependent SHG responses for these two cases in Fig. 2-9 (b) and
(c), respectively. In Fig. 2-9, it is obvious that higher NA detection gives a response closer to the total SHG signal. A substantial difference between Fig. 2-9 (a)–(c) takes
place when is small. This is because a stronger axial dipole component ( )
appears when is small and the objective has a lower collection efficiency of the
axial dipole than the transverse dipoles ( and ).
2.3.2 Theory for tightly focused excitation
Laser scanning microscopy, such as scanning confocal microscopy, is the most popular SHG microscopy where a high NA objective tightly focuses the excitation
beam to reach a high local intensity for efficient nonlinear phenomena to take place. The focus is scanned across the sample to form an image [31, 87]. The tightly focused excitation generates transverse and axial field components, which is known as the
depolarization effect [88]. The depolarized excitation polarizations at the focus then participate in the SHG and can significantly modify the overall
polarization-dependent SHG response [89, 90]. For the detection, the SHG signal is either collected by the same objective in epi-geometry or by another objective in the transmission geometry. A similar depolarization effect should also be considered in
the detection for an accurate estimation.
We simulate the SHG response of a nanoparticle in a scenario of a scanning
microscope, such as a scanning confocal microscope. It is convenient to introduce
spherical polar coordinates as shown in Fig. 2-10. An LP ( -polarized for example)
plane-wave excitation propagating in the direction of 812 nm wavelength is tightly
Fig. 2-10 Schematic diagram of a tightly focused excitation by using a microscopic objective.
The focused field at the beam waist can be written as [88]:
EX r, i f r f r cos 2
EY r, if r sin 2
, 2 sin ,
(2-6)
where
√cos sin 1 cos sin
Ω
√cos sin sin
Ω
√cos sin 1 cos sin
Ω
,
(2-7)
and √ 0, 0 2 , and · is the Bessel function of the first kind
and order .
The magnitudes and the phases of the three perpendicularly polarized fields at the
beam waist | , , , , are plotted in Fig. 2-11 (a)–(c) and (d)–(f),
respectively. Besides the field at the original polarization (i.e., | ), a considerable
Fig. 2-11 Theoretical calculation of the tightly focused LP (X-polarized) excitation. The magnitude (a)–(c) and the phase (d)–(f) of the electric field of X-, Y-, Z-polarizations at the focused beam waist (Z = 0). The incidence is an X-polarized plane-wave of 812 nm wavelength which is focused by a NA 1.2 water-immersion objective in an index-matching environment. The size of the images are 6 μ 6 m2.
In a scanning microscope, the calculated complex excitation patterns shown in Fig. 2-11 are scanned across a nanoparticle and a scanning image of a nanoparticle is
formed. The pixel size in Fig. 2-11 is 60 μ 60 nm2, corresponding to a scanning step size of 60 nm. Assuming the nanoparticle is much smaller than the focused spot of the
excitation, while the excitation patterns are scanned across, it will pick up the local
excitation fields calculated at each pixel as a plane-wave excitation and emit SHG
signal as described in the previous section. Under this assumption, the theoretical
SHG scanning image can be obtained by calculating the SHG signal from the
nanoparticle pixel-by-pixel based on the excitation patterns. The finite size of the
nanoparticle in reality would make the measured SHG response deviate from this
theoretical estimation. We integrate the SHG intensity over the whole scanning image
to represent the SHG response of a nanoparticle at certain orientation and under a
The theoretical polarization-dependent SHG response of a nanoparticle under a
tightly focused excitation (NA 1.2 water-immersion objective) is plotted in Fig.
2-12 where the nanoparticles orientated at = 10, 50, and 90 degrees are considered. Similar to the analysis of plane-wave excitation, we calculate the total SHG signal and
also the signal collected by NA 1.2 and NA 0.3 water-immersion objectives, as shown
in Fig. 2-12 (a), (b), and (c), respectively. We find Fig. 2-12 (a)–(c) to have a similar behavior as Fig. 2-9 (a)–(c), i.e., the decrease of the collected SHG signal when the
NA decreases at small , which is due to the collection efficiency of the objective.
We also find that a tightly focused beam results in a slightly different SHG polar
response from a uniform excitation: where the uniform excitation gives a weak SHG
signal, such as = 90 degrees and = 0 degrees, the tightly focused excitation gives
a stronger SHG signal due to the depolarization effect. In other words, the
depolarization effect induces new excitation polarizations, which results in an
Fig. 2-12 Theoretical calculation of the polarization-dependent SHG response of a BaTiO3 nanoparticle in a scanning image with a tightly focused excitation (NA 1.2
water-immersion objective). (a) The polarization dependency of the total SHG response of a BaTiO3 nanoparticle. (b) (c) The polarization dependency of the SHG
response of a BaTiO3 nanoparticle where the SHG signal is collected by a (b) NA 1.2
water-immersion objective and (c) NA 0.3 water-immersion objective
2.3.3 Measurements of SHG polar response of the nanoparticles
We used a standard scanning confocal microscope (Leica SP5) to excite and to detect
SHG signal from individual BaTiO3 nanoparticles randomly deposited on an
ITO-coated glass substrate. The nanoparticles were immersed in water for the confocal
microscope measurement with a water-immersion objective. Fig. 2-13 is a typical
SEM image of the nanoparticles prepared on an ITO coated glass slide. It shows that
most of the nanoparticles on the glass slide are isolated single nanoparticles. The
excitation light source was a Ti:sapphire oscillator (Chameleon Ultra II, Coherent)
generating 140 fs laser pulses at 812 nm wavelength and 80 MHz repetition rate. The
average excitation power is approximately 15 mW. The excitation was tightly focused
by a 63X NA 1.2 water-immersion objective and the SHG signal was collected by the
same objective in an epi-geometry. The SHG signal was detected by a photomultiplier
(R6357, Hamamatsu) and the ambient light was rejected by a narrow bandpass optical
filter centered at 406 nm with 15 nm bandwidth. The excitation polarization is
controlled by a half-wave plate or a quarter-wave plate placed in the excitation beam
before it enters the confocal microscope.
Fig. 2-13 SEM image of isolated BaTiO3 nanoparticles randomly deposited on an ITO
Fig. 2-14 shows a typical SHG confocal image of the nanoparticles under an LP
excitation, where the sample was prepared in a similar way as for the SEM
measurement. The SHG signal from individual nanoparticles shows great contrast.
The background SHG from the ITO/water interface is relatively weak. The pixel size
in Fig. 2-14 is 60 μ 60 nm2. The full-width at half-maximum (FWHM) of the SHG imaging spot size of the BaTiO3 nanoparticle is about 300 nm, which matches well
with the diffraction-limited spot size at the SHG wavelength based on a tightly
focused excitation beam described in the previous section. The SHG intensity of
individual nanoparticles varies due to the size-dependent and also the
polarization-dependent SHG signal. Based on the SHG efficiency of BaTiO3 nanoparticles
described by equation (2-3), we estimate the average power of the SHG signal from
We measured the polarization-dependent SHG response from individual
nanoparticles by rotating LP excitation with a half-wave plate. One SHG confocal
image was captured for each excitation polarization direction. The excitation
polarization was rotated from 0 to 180 degrees with a 10 degree angular step size. We
calibrated the excitation power at the sample position as it varies about 5% when the
excitation polarization changes due to the polarization-dependent response of the
confocal microscope. Fig. 2-15 shows the images of three isolated nanoparticles under LP excitations of different polarization orientations. The polarization-dependent SHG
[image:50.595.153.484.330.662.2]signal is clearly observed.
Fig. 2-15 Scanning confocal SHG images of BaTiO3 nanoparticles under different LP
The SHG response of individual nanoparticles was found by integrating the SHG
signal within the bright spot in the confocal image, while the background SHG from
the ITO/water interface was subtracted. From the measured responses, we can retrieve
the orientations of the nanoparticles by fitting with theoretical calculation. The
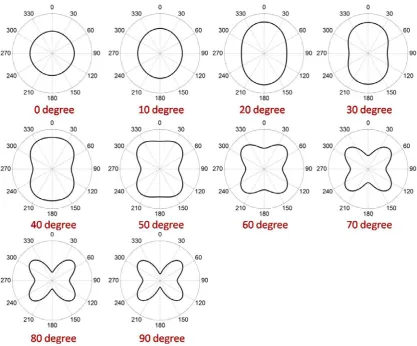
theoretical calculations for the fitting are plotted in Fig. 2-16 where = 0 degrees
and = 0, 10… 90 degrees. As can be seen in Fig. 2-16, the fitting of the orientation
of the nanoparticle is unique because each ( , ) pair gives a different polar
[image:51.595.110.528.316.662.2]response except the ambiguity between and + 180 degrees.
Fig. 2-16 Theoretical calculations of the polarization-dependent SHG response of BaTiO3 nanoparticle at various orientation angles of , measured by a scanning